1100
Accurate Estimation of Microscopic Diffusion Anisotropy Using Multi-shell Double Diffusion Encoding1Champalimaud Neuroscience Programme, Champalimaud Centre for the Unknown, Lisbon, Portugal, 2Centre for Medical Image Computing, Department of Computer Science, University College London, London, United Kingdom, 3Center of Functionally Integrative Neuroscience (CFIN), Aarhus University, Aarhus, Denmark, 4Department of Physics and Astronomy, Aarhus University, Aarhus, Denmark
Synopsis
Advanced diffusion MRI acquisitions, such as double diffusion encoding (DDE), have been used to provide estimates of microscopic anisotropy, and the majority of DDE studies to date have acquired data at a single b-value. This study shows in simulations and ex-vivo experiments that the D(O)DE derived microscopic anisotropy metric strongly depends on the choice of b-value and proposes a multi shell estimation scheme which provides accurate measurements.
Introduction
Accurate estimation of tissue microscopic anisotropy (μA) has become an important research focus, with applications to both brain and cancer imaging1,2. Estimations of µA typically rely on double diffusion encoding (DDE) sequences3, although other schemes have been proposed under various assumptions 4. To date, most DDE sequences have been typically employed with a single b-value at long mixing times3,5-7, and it was assumed that higher-order terms are negligible. Here, we show both in simulations and experiments that the μA is extremely sensitive to the choice of b-value, which in turn biases µA estimation. We propose a multi shell estimation scheme which can provide a nearly unbiased µA metric.Methods
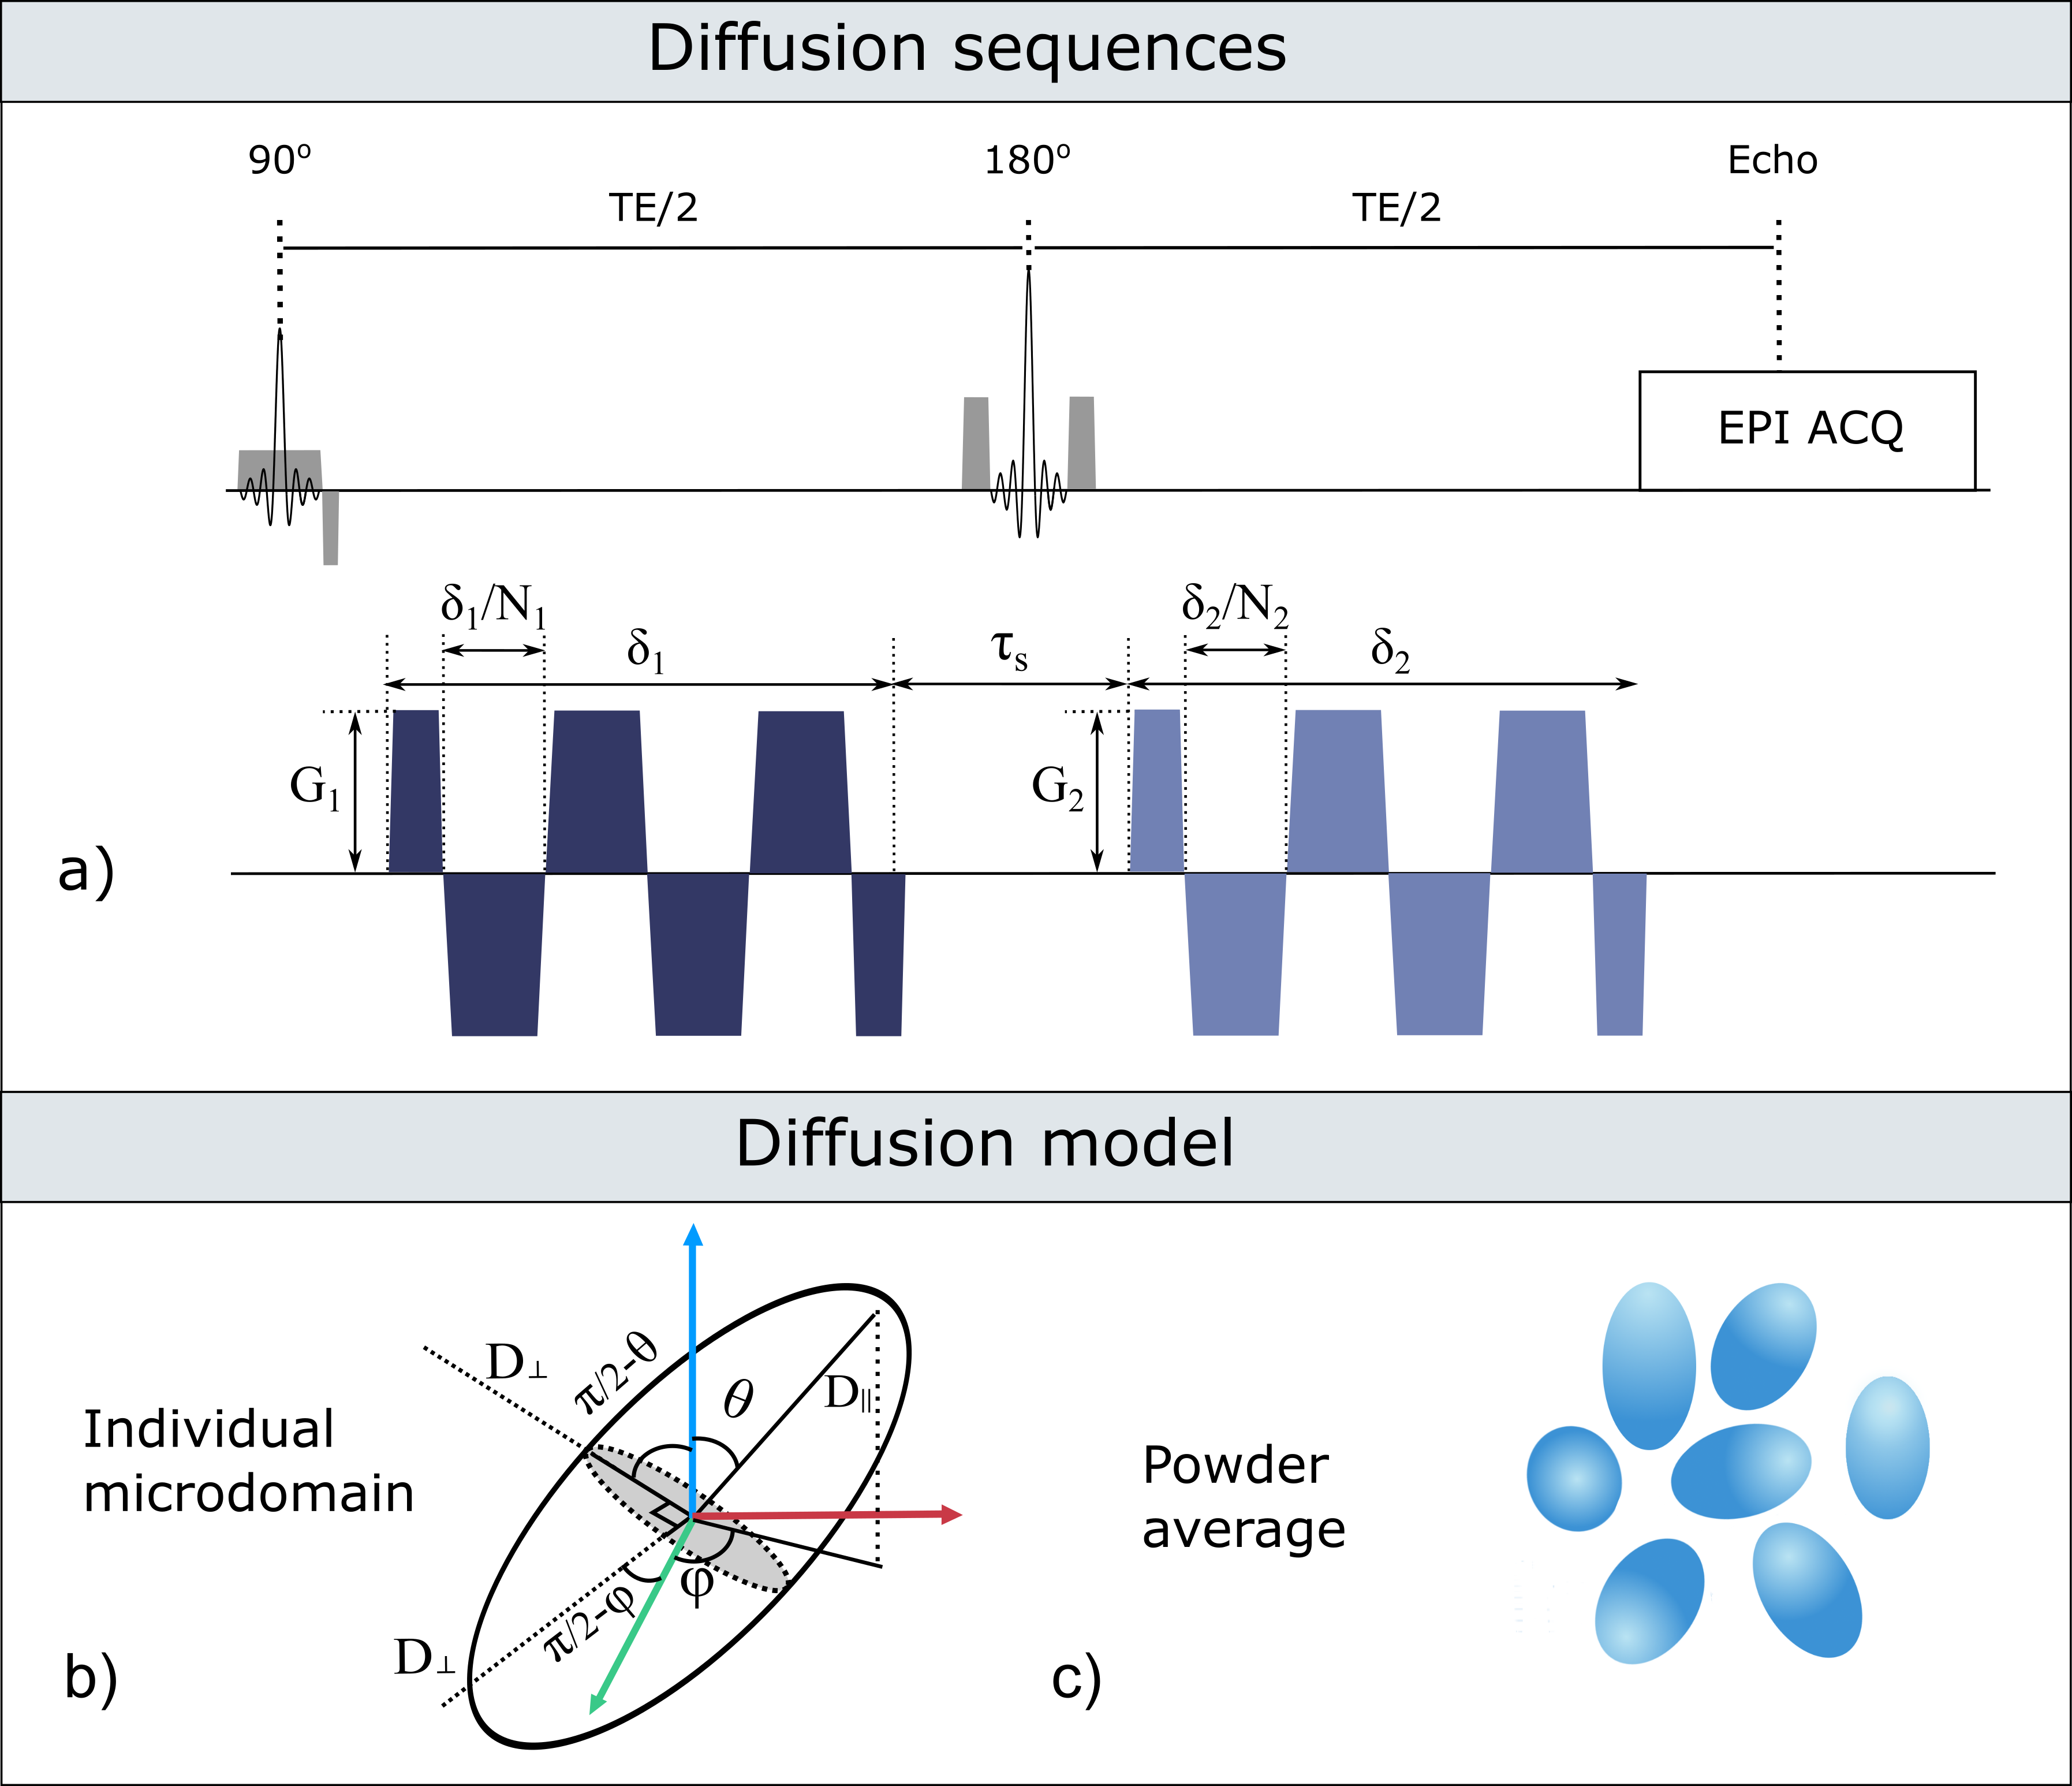
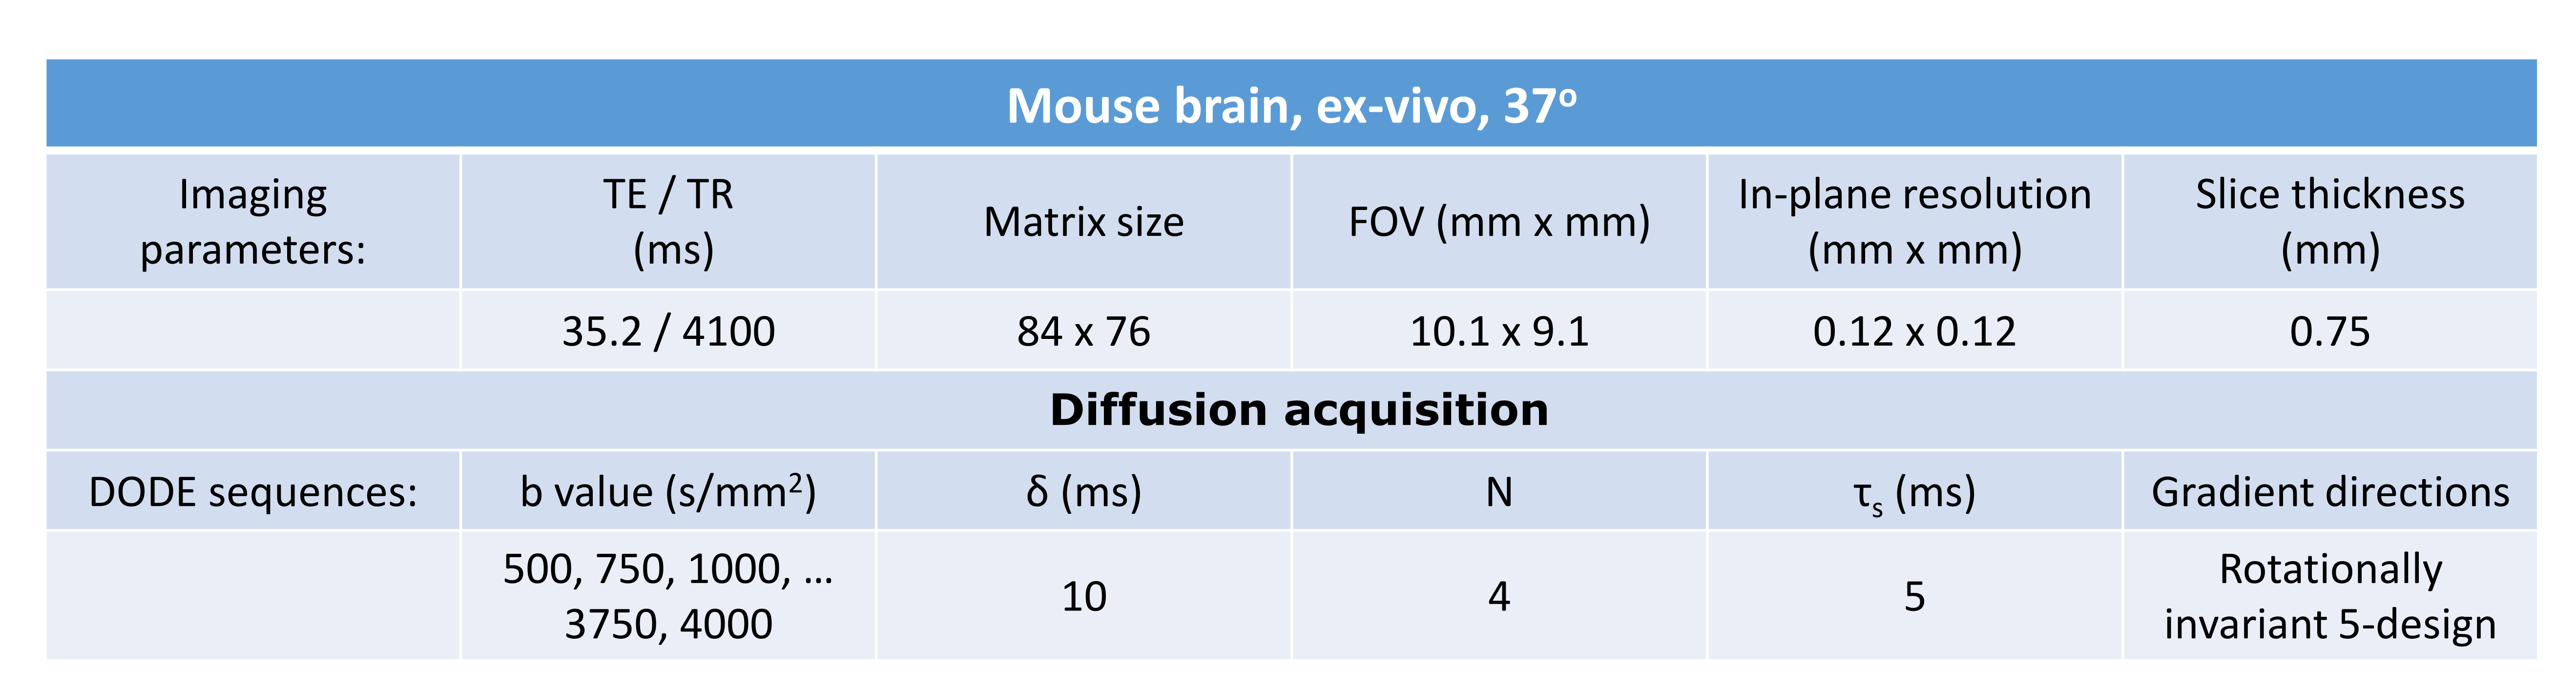
Diffusion sequences: To investigate the b-value dependence of the estimated μA, double oscillating diffusion encoding (DODE) sequences, illustrated in Figure 1, were simulated following the 5-design from 8. DODE was chosen as its mixing time dependence is negligible 9, thus reducing the complexity of the parameter space. Specific sequence parameters are given in Table 1.
Microscopic anisotropy estimation: For randomly oriented microdomains with frequency-dependent parallel and perpendicular diffusivities (D‖(ω) and D⊥(ω)), Figure 1 b) and c), μA can be derived from the powder averaged DODE signal constructed by using the 5-design. Thus, the cumulant expansion up to second order in b, yields the following expression 10:
$$\log(\frac{1}{12}\sum S_∥)-\log(\frac{1}{60}\sum S_⊥)= b^2 \frac{2}{15} (D(ω)_∥-D(ω)_⊥ )^2+O(b^3), $$
and the microscopic anisotropy estimated at a given b-value is calculated as
$$\tilde{μA}^2=(\log(\frac{1}{12}\sum S_∥)-\log(\frac{1}{60}\sum S_⊥)) /b^2 =\frac{2}{15} (D(ω)_∥-D(ω)_⊥ )^2.$$
This expression includes only second order terms, which might introduce a bias when higher order terms are not vanishing. To correct for this effect, we can include the next order terms:
$$ \log(S_∥^{(p.a.)} )-\log(S_⊥^{(p.a.)} )= μA^2 b^2+P_3 b^3 $$
where μA2 denotes the corrected microscopic diffusion anisotropy metric and P3 reflects the contribution of 3rd order terms.
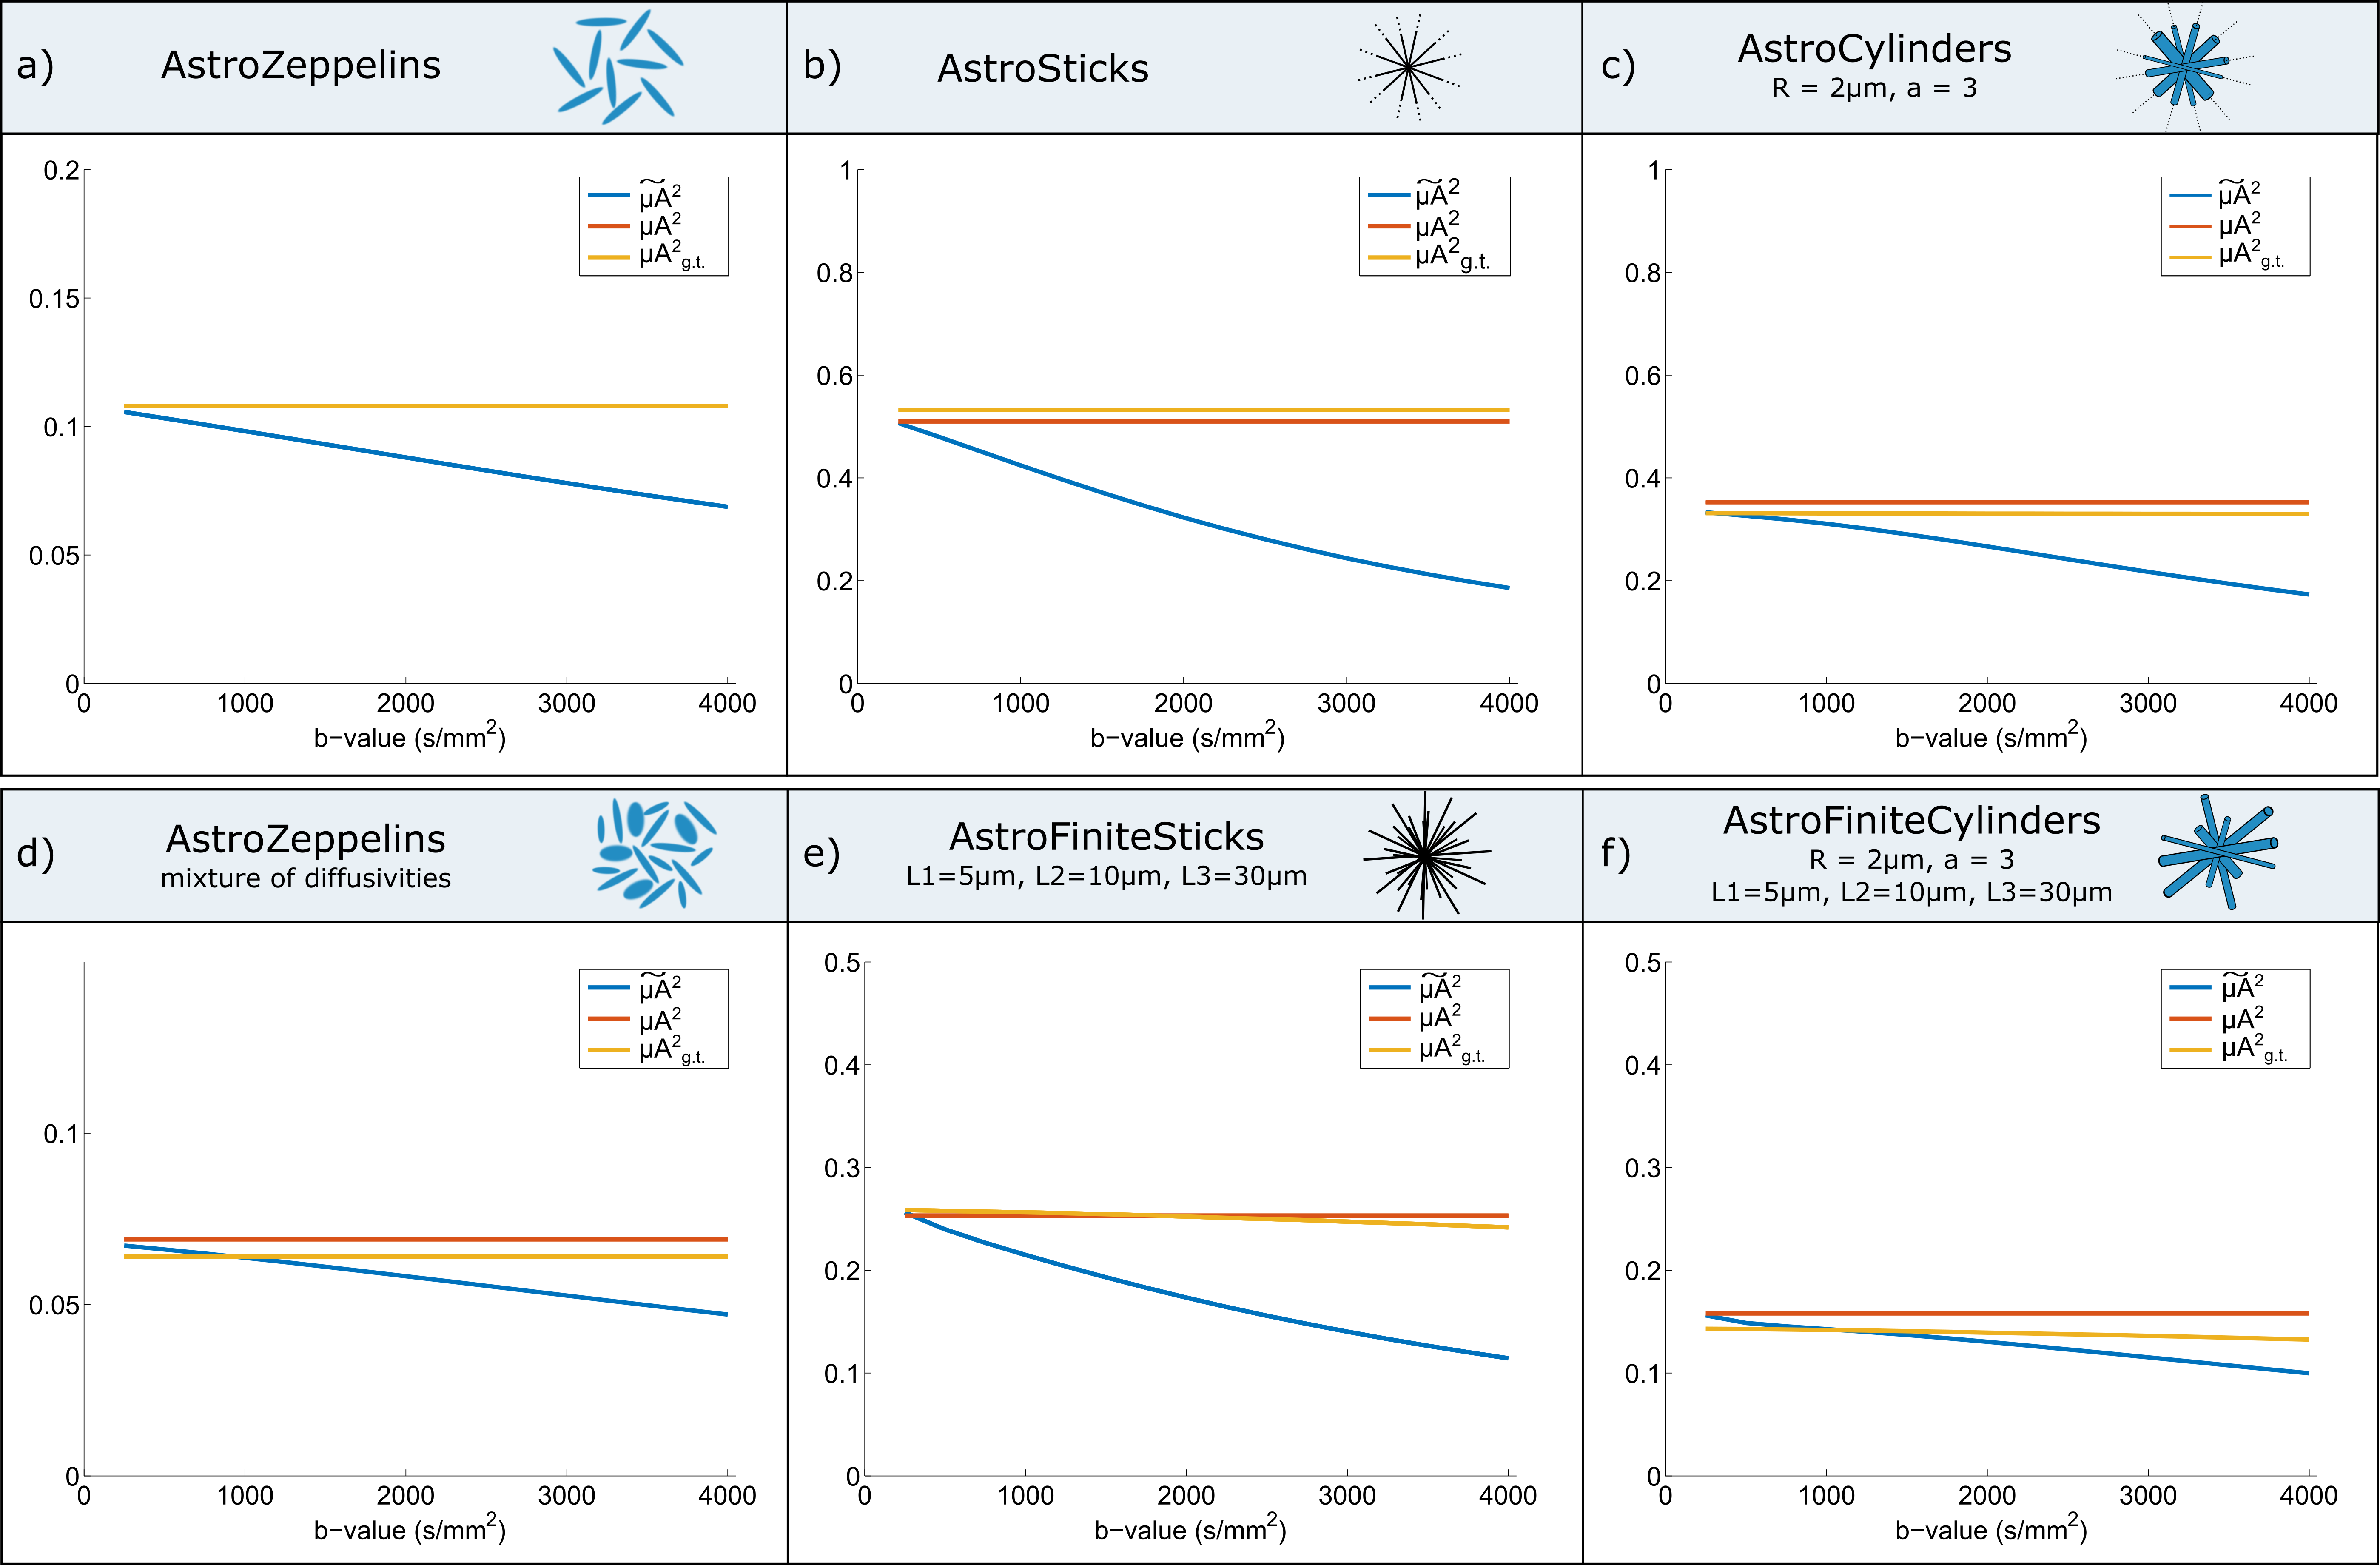
Simulations: We use the MISST toolbox11,12 to simulate the diffusion signal in different tissue models as illustrated in Figure 2. Then, for each substrate, we compare the ground truth value (μA2g.t.) with the estimated microscopic anisotropy at different b-values as well as the corrected metric.
Experiments: All experiments were preapproved by the Institution’s animal ethics committee and performed on 16.4 T scanner. The brain was perfused from a healthy mouse, immersed in gadoterate meglumine 2.5mM for 24h before scanning and placed in a 10mm NMR tube filled with Fluorinert. The specimen was kept at 37oC during scans. Acquisition parameters are detailed in Table 1, and the analysis is performed using normalised signals.
Results
Simulations: Figure 2 plots the apparent microscopic anisotropy $$$\tilde{µA}$$$2 at a range of b-values (blue curves), the corrected metric (yellow curve) and the ground truth values (orange curve) for different models of microstructure featuring either Gaussian diffusion (Figure 2a, 2b and 2d) or restricted diffusion (Figure 2c, 2e and 2f). The results show that metrics estimated from each b-value independently are biased, and the bias increases with b-value. When µA2 is computed using the information from all b-values to correct for higher order terms, similar values to the ground truth are obtained.
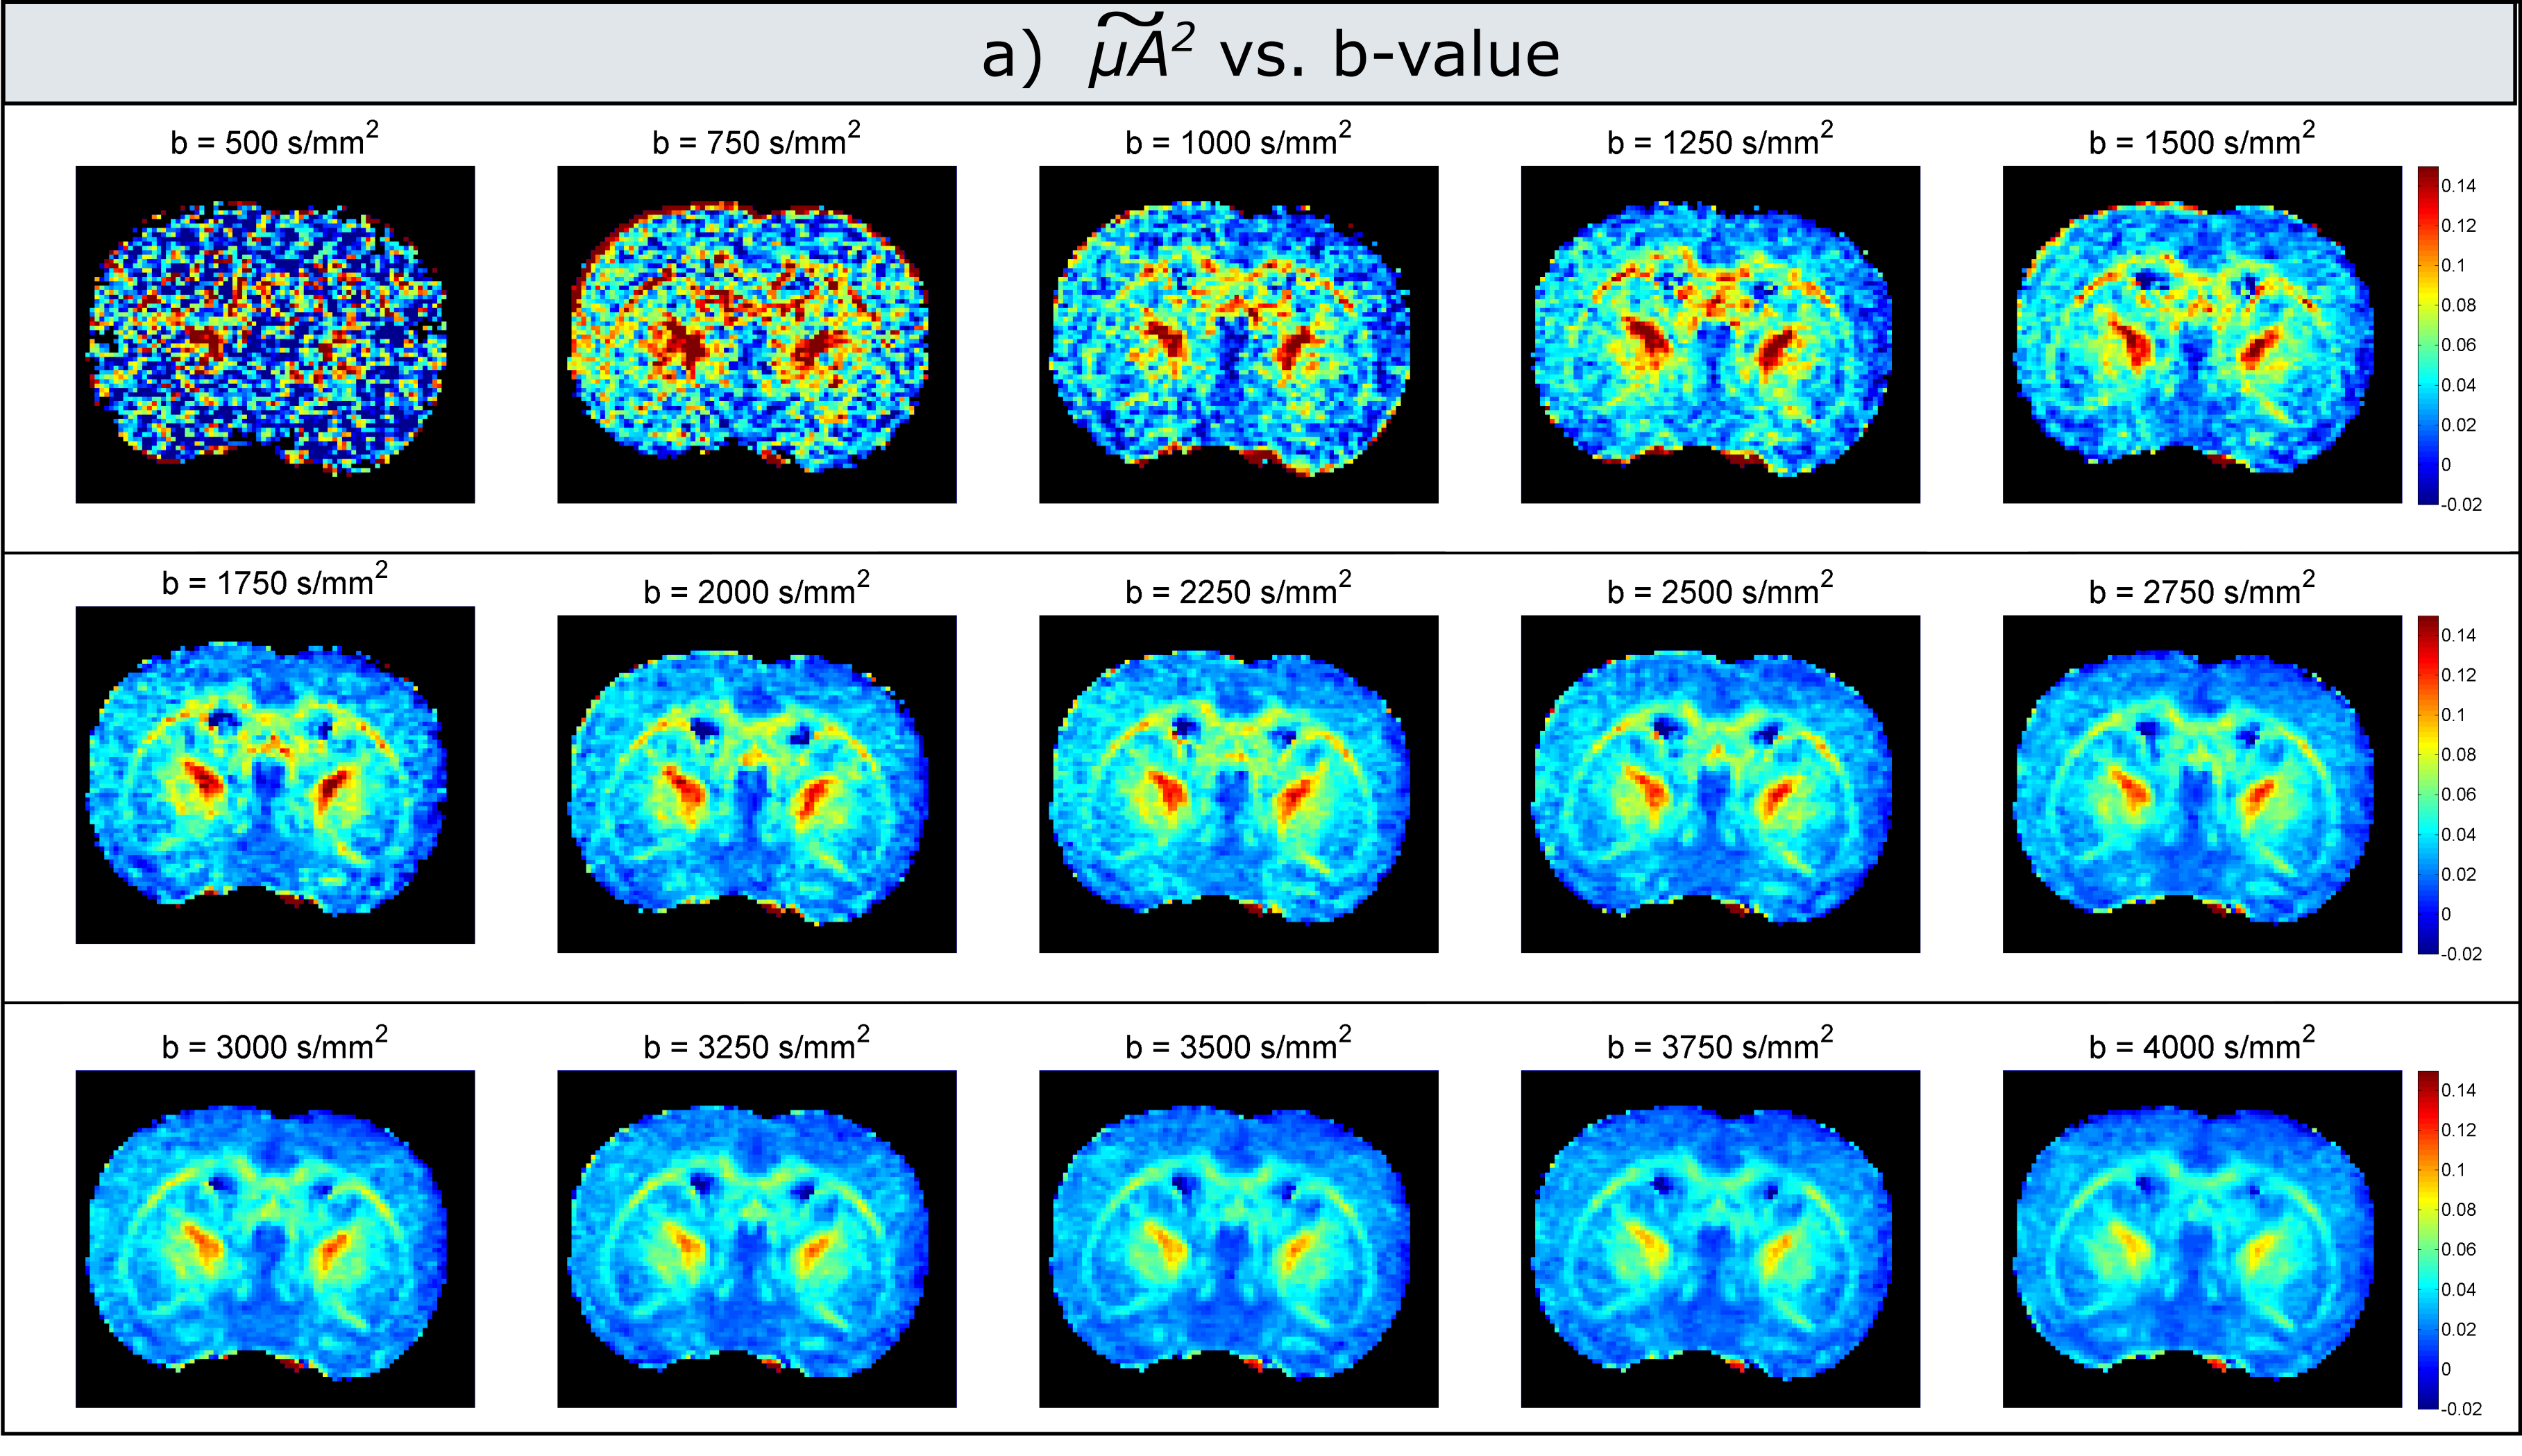
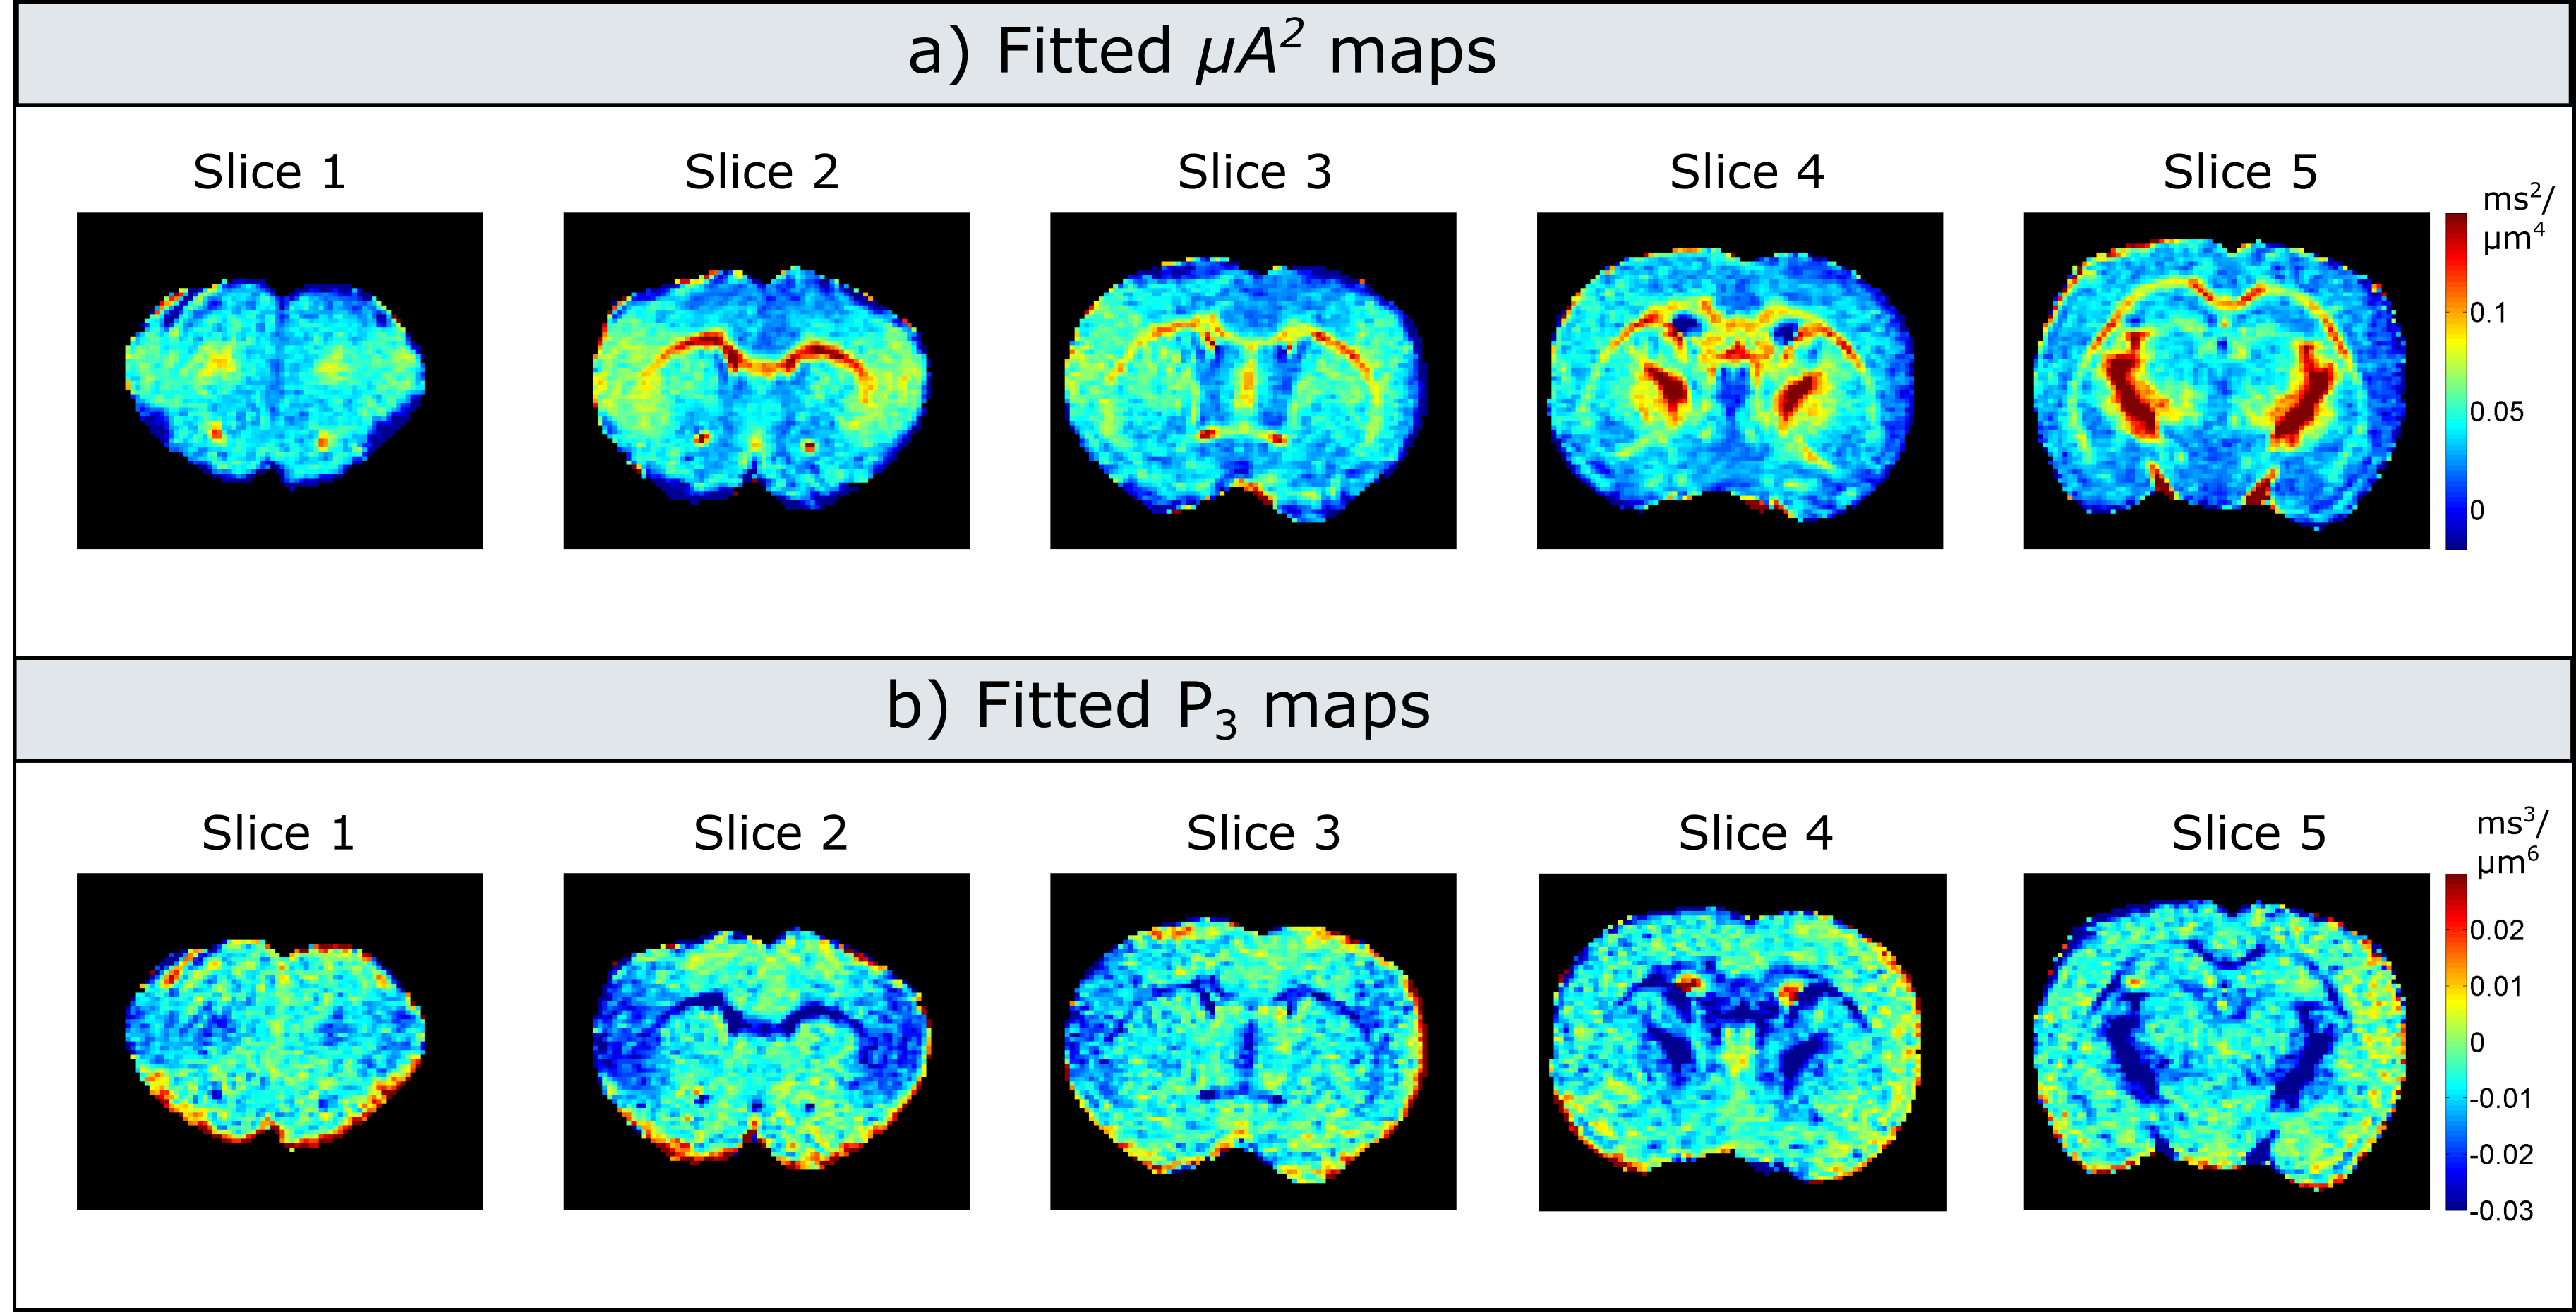
Experiments: Figure 3 illustrates maps measured at each b-value. Indeed, the values decrease with increasing b-value, with a more pronounced dependence in white matter. For low b-values (<1000s/mm2) the maps are very noisy, as the difference between measurements with parallel and perpendicular gradients is very small. Figure 4 presents the corrected microscopic anisotropy maps, as well as the fitted polynomial coefficient (P3) corresponding to the third order term in b.
Discussion
Simulations show that our multi b-value approach provides excellent accuracy when compared to the ground truth values. As expected, slight departures exist in substrates with a mixture of sizes, as the emergence of higher order terms is compartment size-dependent. Experiments equally show that the multi b-value estimates are closer to what is expected in tissue, and emphasise how single b-value DDE acquisitions underestimates μA. Although here we use DODE sequences, all conclusions are equally valid for multi b-value DDE (data not shown). Furthermore, the method is easily adaptable to the clinic, since the technique may be used with as little as two b-values instead of the polynomial fitting.Conclusions
This study shows in simulations and ex-vivo experiments that the multi shell estimation scheme proposed here provides more accurate and robust measurements of μA compared to single b-value D(O)DE techniques that can underestimate μA, which is essential if this potential biomarker is to be translated to the clinic.Acknowledgements
This study was supported by funding from the European Research Council (ERC) under the European Union’s Horizon 2020 research and innovation programme (Starting Grant, agreement No. 679058), EPSRC (grant number M507970), Danish National Research Foundation (CFIN), and The Danish Ministry of Science, Innovation, and Education (MINDLab). The authors are thankful to Dr. Daniel Nunes for preparing the brain specimens.References
1. Lawrenz, M., S. Brassen, and J. Finsterbusch, Microscopic diffusion anisotropy in the human brain: Age-related changes. . NeuroImage, 2016. 141: p. 313-325.
2. Szczepankiewicz, F., et al., The link between diffusion MRI and tumor heterogeneity: Mapping cell eccentricity and density by diffusional variance decomposition (DIVIDE). NeuroImage, 2016. In Press.
3. Mitra, P.P., Multiple Wave-Vector Extensions of the NMR Pulsed-Field-Gradient Spin-Echo Diffusion Measurement Physical Review B, 1995. 51: p. 15074-15078.
4. Lasic, S., et al., Microanisotropy imaging: quantification of microscopic diffusion anisotropy and orientational order parameter by diffusion MRI with magic-angle spinning of the q-vector. . Frontiers in Physics, 2014. 2.
5. Cheng, Y. and D. Cory, Multiple scattering by NMR. J. Am. Chem. Soc, 1999. 121: p. 7935-7396.
6. Shemesh, N., et al., Noninvasive bipolar double-pulsed-field-gradient NMR reveals signatures for pore size and shape in polydisperse, randomly oriented, inhomogeneous porous media. J Chem Phys, 2010. 133: p. 044705.
7. Shemesh, N. and Y. Cohen, Microscopic and compartment shape anisotropies in gray and white matter revealed by angular bipolar double-PFG MR. Magn Reson Med, 2011. 65: p. 1216-27.
9. Ianus, A., et al., Double Oscillating Diffusion Encoding and Sensitivity to Microscopic Anisotropy. Magn Reson Med, 2016. 78: p 550–564.
8. Jespersen, S.N., et al., Orientationally invariant metrics of apparent compartment eccentricity from double pulsed field gradient diffusion experiments. NMR Biomed, 2013. 26: p. 1647-62.
10. Ianus, A., et al. Time dependence of microscopic anisotropy in the mouse brain measured with double oscillating diffusion encoding (DODE) MRI. in Annual Meeting of the International Society for Magnetic Resonance in Medicine. 2017. Honolulu, HI, USA.
11. Drobnjak, I., et al., The matrix formalism for generalised gradients with time-varying orientation in diffusion NMR. J Magn Reson, 2011. 210: p. 151-7.
12. Ianus, A., D.C. Alexander, and I. Drobnjak, Microstructure Imaging Sequence Simulation Toolbox, in SASHIMI 2016, S.A. Tsaftaris, Editor. 2016, Springer. p. 34-44.
Figures