1098
What is the feasibility of estimating axonal conduction velocity from in vivo microstructural MRI?1CUBRIC, Cardiff University, Cardiff, United Kingdom
Synopsis
Microstructural MRI provides non-invasive measures of the microstructure of white-matter axons, including diameter and g-ratio. These can theoretically be used to infer axonal conduction velocity (CV). However, several other morphological and physiological parameters also contribute to CV, which are not accessible through MRI. Using sensitivity analysis on a comprehensive model of axon electrophysiology, we test the feasibility of modelling CV and associated uncertainty using only MRI-accessible parameters. Results show 88.5% of the variance in CV is accounted for by axon diameter and g-ratio and uncertainty due to non-imageable parameters can be easily modelled by a simple linear function. When these measurements can be made reliably it is feasible to obtain estimates of axonal CVs from micro-structural parameters obtained from MRI.
Background
Recent developments in microstructural MRI provide non-invasive estimates of axon diameter [1,2], myelination [3,4] and g-ratios [5–7], tempting speculation that this information might be used to predict inter-individual differences in conduction velocity (CV). Rushton [8] suggested that CV depends principally on g-ratio and axon diameter. However, CV also depends on additional parameters not currently accessible via MRI, and yet have high variability across fibre populations and across individuals. These include the nodes of Ranvier, inter-nodal spacing, and axonal/myelin membrane electrical properties. Using a detailed model of axon electrophysiology, we quantify the impact of such variability on CV. We ask the important question of how well we can predict CV from MRI-accessible parameters. We fit the expected value and variance in CV for two parameters that are potentially accessible from MRI, namely axon diameter and g-ratio, to a simple model using only these paramaters.Methods
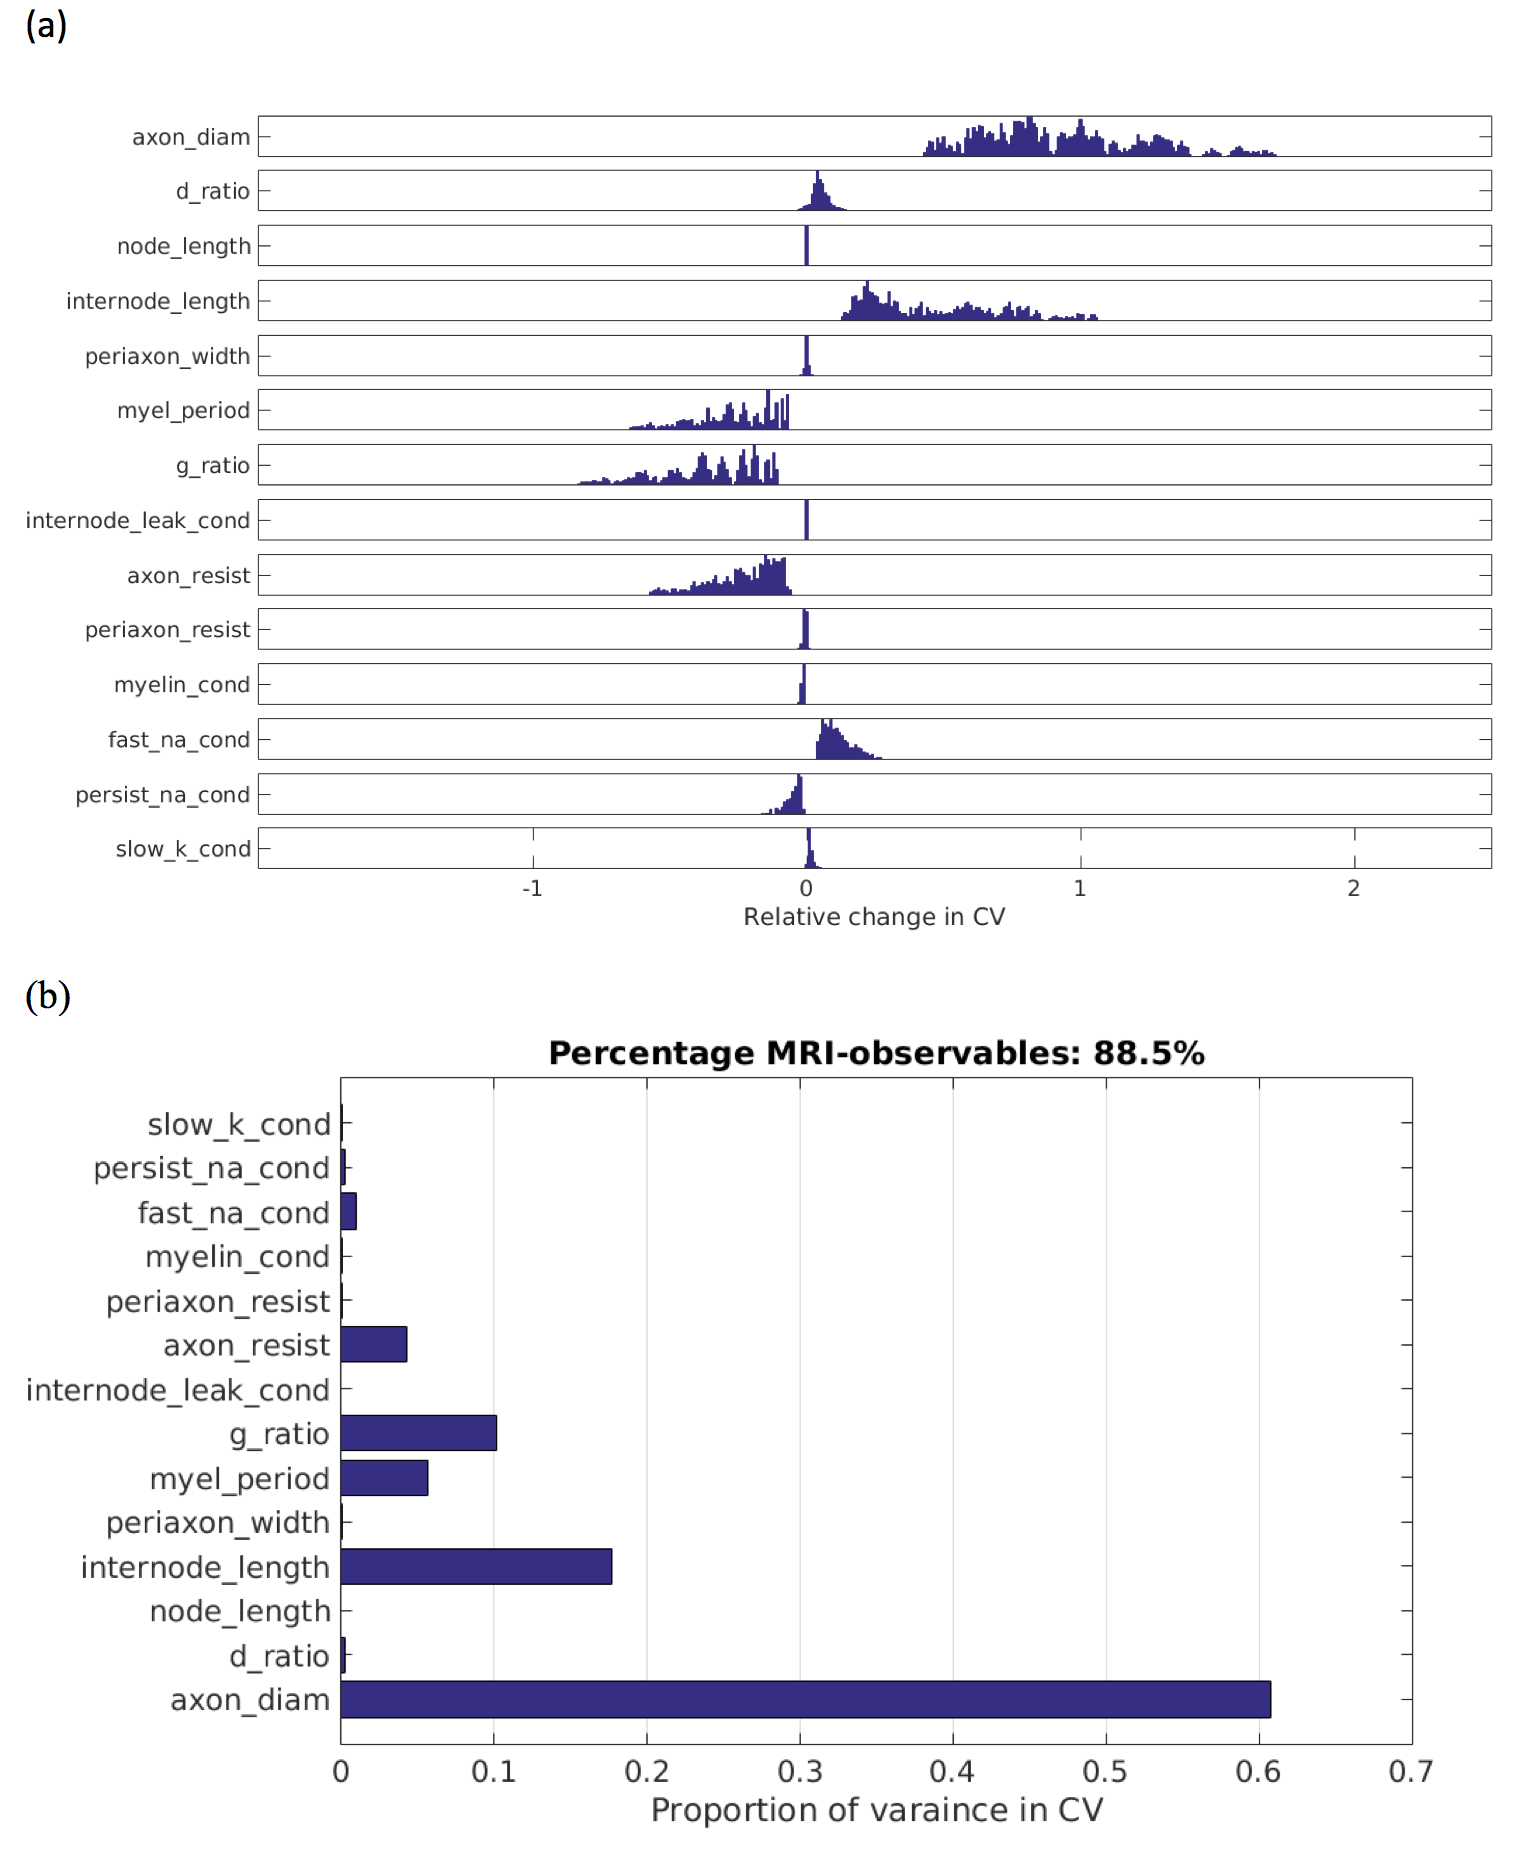
Axonal Modelling: Richardson et al.’s axon ‘Model C’ [9] was used to analyse the sensitivity of CV to variance in 14 different parameters (listed in Table 1). Model parameters derived from optic nerve [10] were used as a proxy for CNS axons. Some parameters were assumed to be well constrained across individuals and fibre populations and thus not tested (Table 1). Others, including number of myelin wraps and myelin thickness, are dependent on g-ratio, axon diameter and myelin periodicity, and so were not directly manipulated. Each model axon was stimulated with 3nA for 10μs applied to the first node. The resultant CV was then measured between the 6th and 13th node. For each simulation, we ensured that action potentials were propagated consistently, with membrane potential peaks of at least -40mV.
Sensitivity Analysis: An exhaustive analysis of 214=16,384 comparisons was made by sampling the corners of a 14-dimensional hypercube in the parameter space, i.e., for every possible combination of positive and negatives changes in each parameter. The dimensions of the hypercube were set to ±1 s.d., where s.d. was determined from experimental observations in optic nerve [10,11], or ±20% where no such data were available.
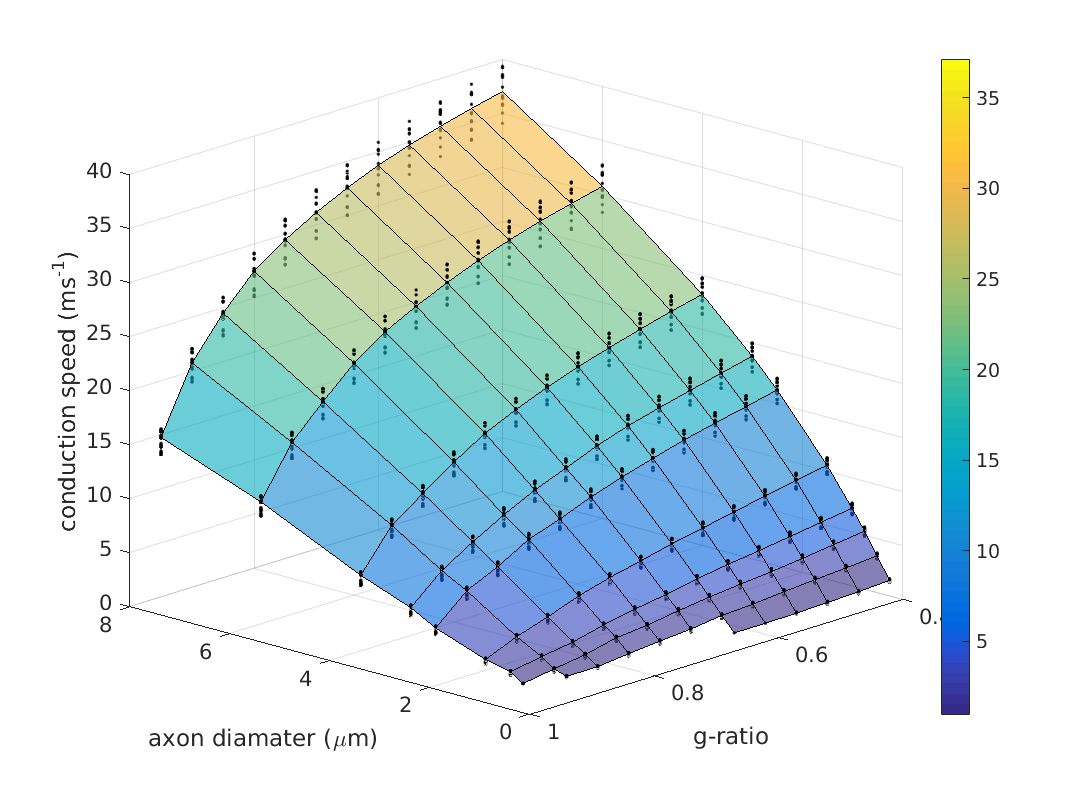
A Model To Predict CV From MRI-Accessible Parameters: We aimed to derive an expression for CV (and associated variance) from the two MRI-accessible parameters of g-ratio (g) and internal axon diameter (d). We tested the model across a grid comprising 10 values of d (0.25 to 8 μm) and 12 values of g (0.4 to 0.95). For each grid-point, we repeated the sensitivity hypercube analysis by running ‘Model C’ [9] across all possible combinations of the remaining non-MRI accessible parameters, to generate a distribution of CVs for each point on the grid. This resulted in 10×12×212=491,520 model runs. The mean and standard deviation of CV at each point was derived. We then fitted the original Rushton formula [8] for CV, and an alternative model that better fits the CV estimates.
Results
Figure 1(a) show the distributions of relative changes in CV, due to change in each model parameter. Figure 1(b) shows the total variances in CV due to variance in each parameter. The majority of the variance is explained by d, followed by internode length (non-MRI-accessible) and then g. Combined, d and g explain 88.5% of the model variance in CV. The distribution of CVs across d and g are shown in Figure 2. The mapping of CV to d appears to follow a square-root function, while g follows an square-root log function, similar to that given by Rushton [8]:
$$v=pd\sqrt{-\log(g)}$$
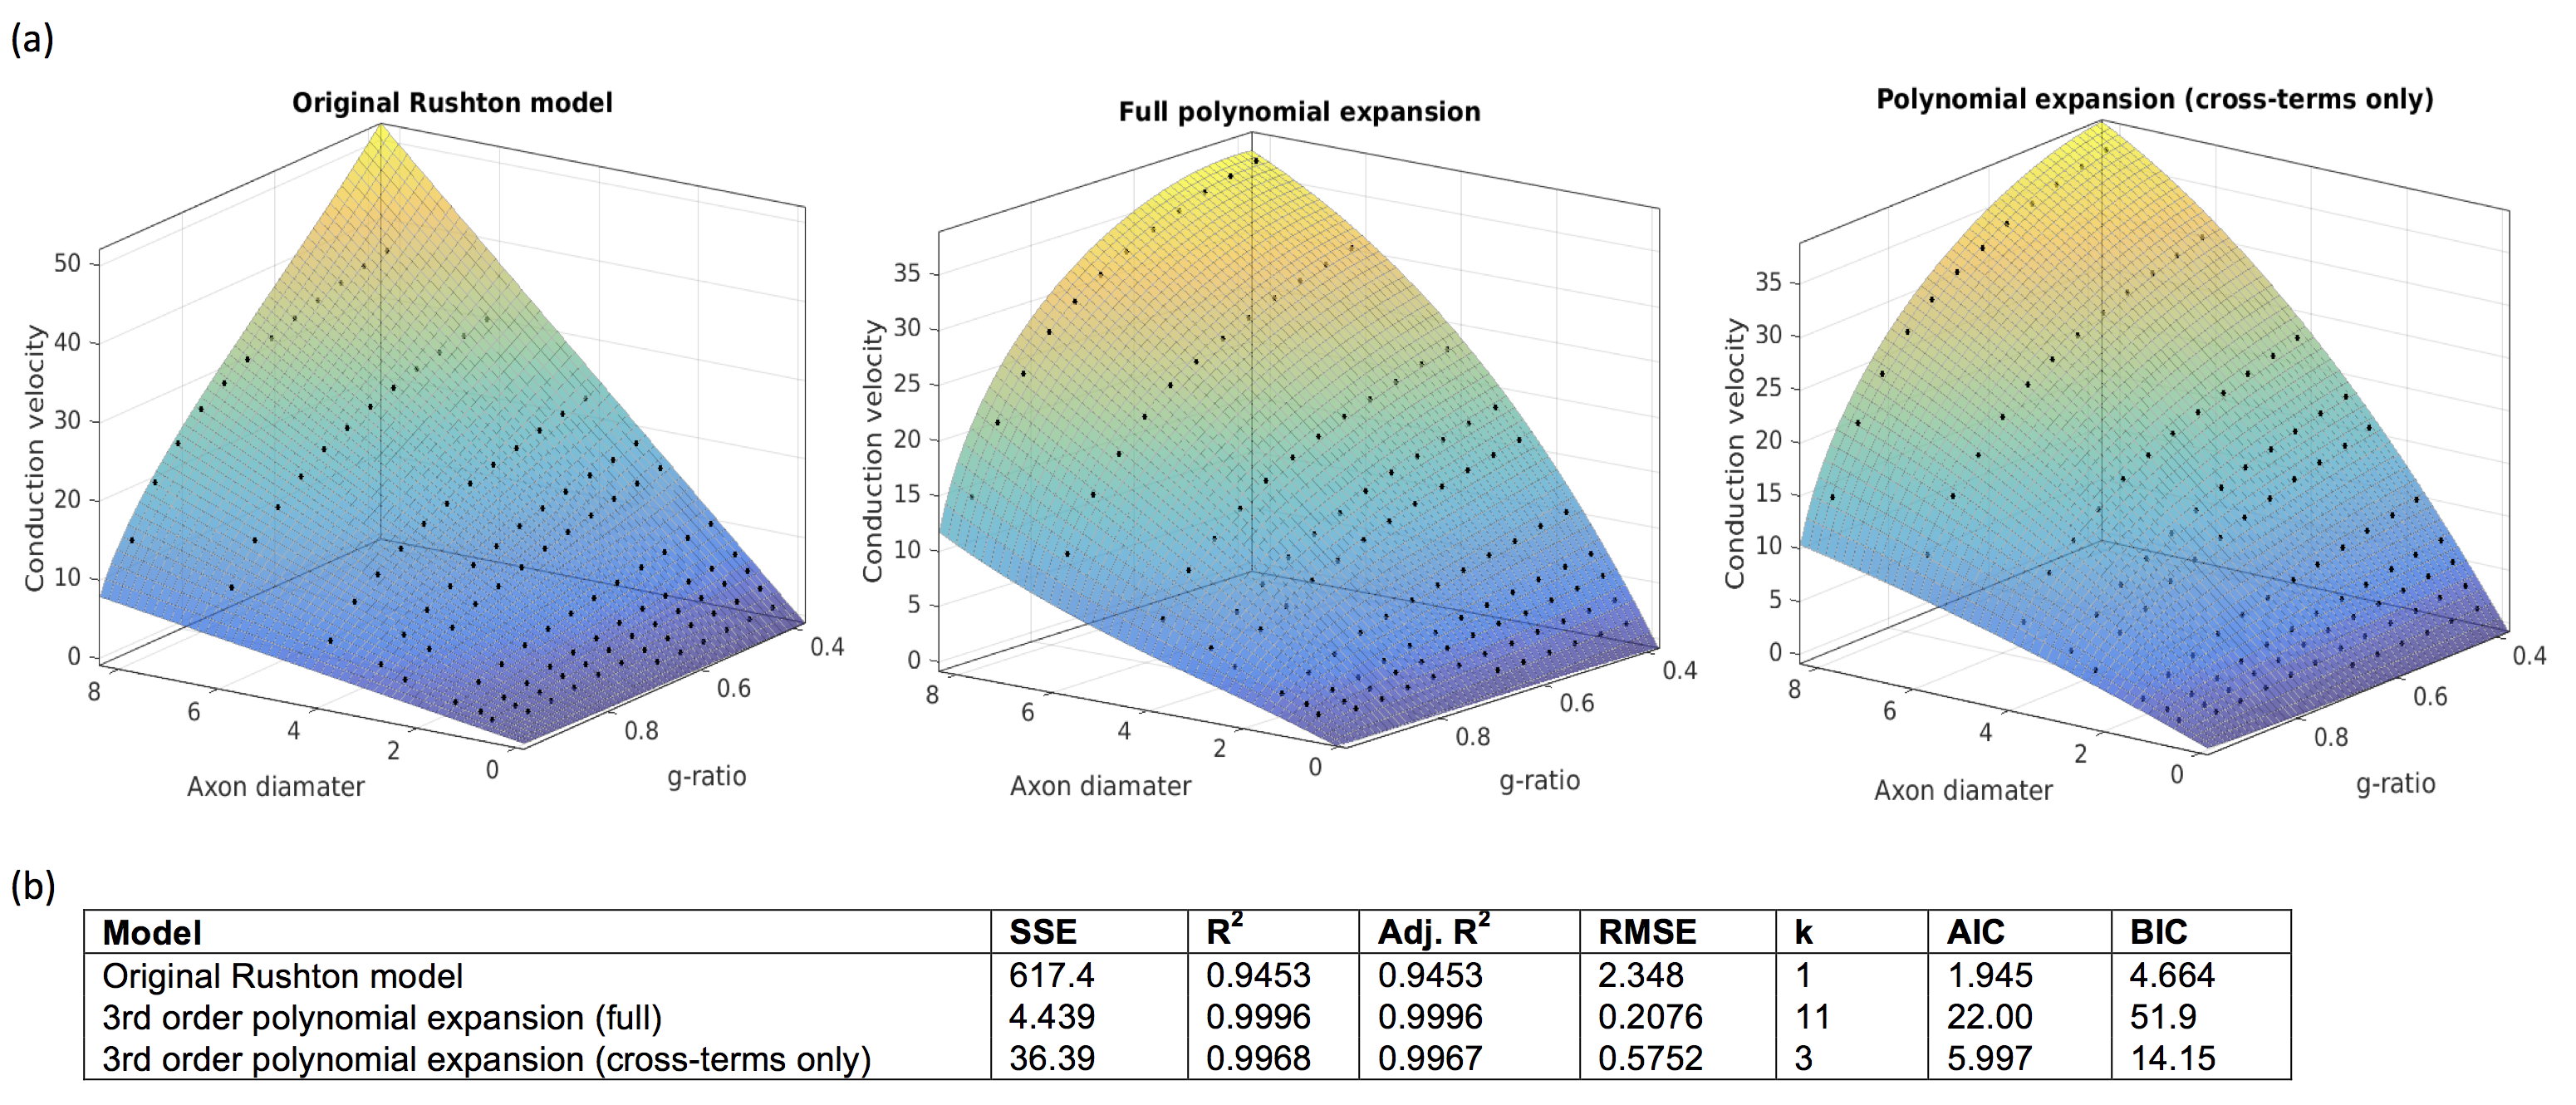
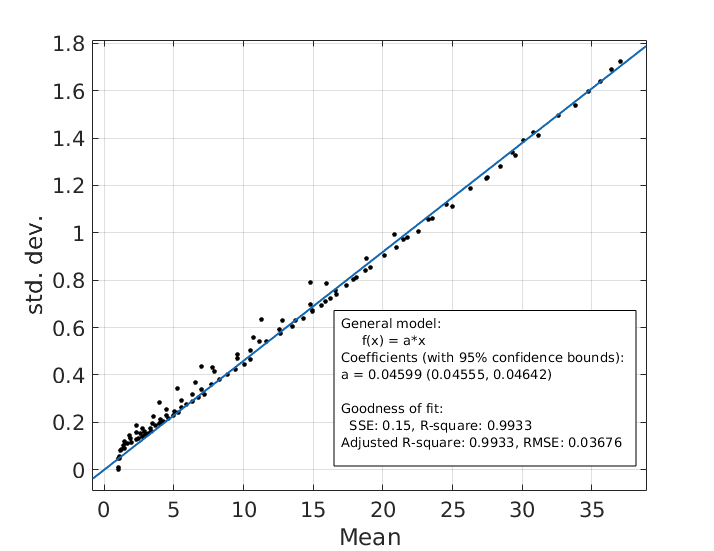
where p is some constant, (fitted to p=6.25 s-1). The original Ruston model yielded a good fit (SSE=434.5, R2= 0.9615), but the fit was poor for large d and g. A better fit was derived using a 3rd-order bivariate polynomial fit in d and $$$\sqrt{-\log(g)}$$$ (of which the Rushton model is one term). This yielded a much more accurate fit (SSE=4.439,R2=0.9996) but required fitting of 11 coefficients. A good fit was also achieved when considering only cross-terms in the polynomial, (SSE=36.39,R2=0.9968) which only requires 3 coefficients. However, the AIC and BIC were lowest for the Rushton model, which therefore remains the preferred model (Figure 3). The s.d. of the modelled CVs scaled linearly with the mean CV (coefficient=0.046, SSE=0.15,R2=0.9933) (Figure 4).
Conclusions
Our results demonstrate that 88.5% of the variance in CV can be attributed to variance in axon diameter and g-ratio. The Rushton model for CV provides a reliable estimate of CV from MRI-derived estimates of g and d. In addition, we show it is possible to account for uncertainty in CV estimates due to non-MRI-accessible parameters. Thus, when these measurements can be made reliably [1,2,5–7], it is feasible to obtain estimates of axonal CVs from micro-structural parameters obtained from MRI.Acknowledgements
This work was funded by a Wellcome Trust New Investigator Award (096646/Z/11/Z). We thank Lee Cossell & David Attwell for providing the simulation programme used [10].References
1. Assaf Y, Basser PJ. Composite hindered and restricted model of diffusion (CHARMED) MR imaging of the human brain. Neuroimage. 2005;27:48–58.
2. Alexander DC, Hubbard PL, Hall MG, Moore EA, Ptito M, Parker GJM, et al. Orientationally invariant indices of axon diameter and density from diffusion MRI. Neuroimage. 2010;52:1374–89.
3. Deoni SCL, Rutt BK, Arun T, Pierpaoli C, Jones DK. Gleaning multicomponent T1 and T2 information from steady-state imaging data. Magn. Reson. Med. 2008;60:1372–87.
4. Gochberg DF, Gore JC. Quantitative magnetization transfer imaging via selective inversion recovery with short repetition times. Magn. Reson. Med. 2007;57:437–41.
5. Stikov N, Campbell JSW, Stroh T, Lavelée M, Frey S, Novek J, et al. In vivo histology of the myelin g-ratio with magnetic resonance imaging. Neuroimage. 2015;118:397–405.
6. Dean DC, O’Muircheartaigh J, Dirks H, Travers BG, Adluru N, Alexander AL, et al. Mapping an index of the myelin g-ratio in infants using magnetic resonance imaging. Neuroimage. 2016;132:225–37.
7. Wharton S, Bowtell R. Fiber orientation-dependent white matter contrast in gradient echo MRI. Proc. Natl. Acad. Sci. 2012;2012:2807.
8. Rushton WAH. A theory of the effects of fibre size in medullated nerve. J. Physiol. 1951;115:101–22.
9. Richardson AG, Mclntyre CC, Grill WM. Modelling the effects of electric fields on nerve fibres: influence of the myelin sheath. Med. Biol. Eng. Comput. 2000;38:438–46.
10. Arancibia-Cárcamo IL, Ford MC, Cossell L, Ishida K, Tohyama K, Attwell D. Node of Ranvier length as a potential regulator of myelinated axon conduction speed. Elife. 2017;6:1–15.
11. Brinkmann BG, Agarwal A, Sereda MW, Garratt AN, Müller T, Wende H, et al. Neuregulin-1/ErbB Signaling Serves Distinct Functions in Myelination of the Peripheral and Central Nervous System. Neuron. 2008;59:581–95.
12. Perge J A, Niven JE, Mugnaini E, Balasubramanian V, Sterling P. Why Do Axons Differ in Caliber? J. Neurosci. 2012;32:626–38.
13. Tomassy GS, Berger DR, Chen H-H, Kasthuri N, Hayworth KJ, Vercelli A, et al. Distinct Profiles of Myelin Distribution Along Single Axons of Pyramidal Neurons in the Neocortex. Science. 2014;344:319–24.
Figures