1096
A compartment based model for non-invasive cell body imaging by diffusion MRI1Computer Science Department and Centre for Medical Imaging Computing, University College London, London, United Kingdom, 2Champalimaud Neuroscience Programme, Champalimaud Centre for the Unknown, Lisbon, Portugal
Synopsis
This study aims to open a new window onto brain tissue microstructure by proposing a new technique to estimate cell body (namely soma) size/density non-invasively. Using Monte-Carlo simulation and data from rat brain, we show that soma’s size and density have a specific signature on the direction-averaged DW-MRI signal at high b values. Simulation shows that, at reasonably short diffusion times, soma and neurites can be approximated as two non-exchanging compartments, modelled as “sphere” and “sticks” respectively. Fitting this simple compartment model to rat data produces maps with contrast consistent with published histological data.
Introduction
This work introduces a biophysical model for estimating neurite density and cell body (namely soma) size/density non-invasively by using diffusion-weighted MRI (DW-MRI). The existing conjecture1-4 considers water diffusion in white (WM) and grey (GM) matter as restricted diffusion in neurites, modelled by “sticks” embedded in the hindered extra-cellular water. However, recent studies5,6 suggest that the stick assumption, which appears to hold in WM, fails in GM. A plausible explanation for this failure is the abundance of soma in GM relative to WM. Here we show that soma size/density have indeed a specific signature on the direction-averaged DW-MRI signal at high b-values. Using Monte-Carlo simulations and data from rat brain, we show that, at reasonably short diffusion times (td), the water exchange between neurites and soma can be ignored, supporting the design of a simple compartment model to quantify the presence of soma.Methods
Microstructure Model. The proposed microstructure model is based on two commonly accepted assumptions:
a) at high b-values (≥3 ms/µm2) the extracellular water signal is negligible7;
b) at short td (≤40 ms) the effect of cell membrane permeability is negligible8.
An additional assumption, the validity of which is investigated in this work by numerical simulations (Fig.1 and 2), is that at short td (≤40 ms), soma and neurites can be approximated as two non-exchanging compartments, modelled as “sphere” and “sticks” respectively. Under these assumptions, the normalized direction-averaged DW-MRI signal at high b-values is expressed as:
S*(b)=fneuritesSneurites(b,Dintra)+fsomaSsoma(b,Dintra,rsoma) (1)
with fneurites+fsoma≤1, fneurites and fsoma the neurites and soma volume fractions, Dintra the intracellular diffusivity, Sneurites(b,Dintra)=[π/(4bDintra)]1/2erf[(bDintra)1/2] and Ssoma(b,Dintra,rsoma) the signal for restricted diffusion within a sphere of radius rsoma, as computed by multiple correlation function approach9, chosen to accurately model high b-value signals.
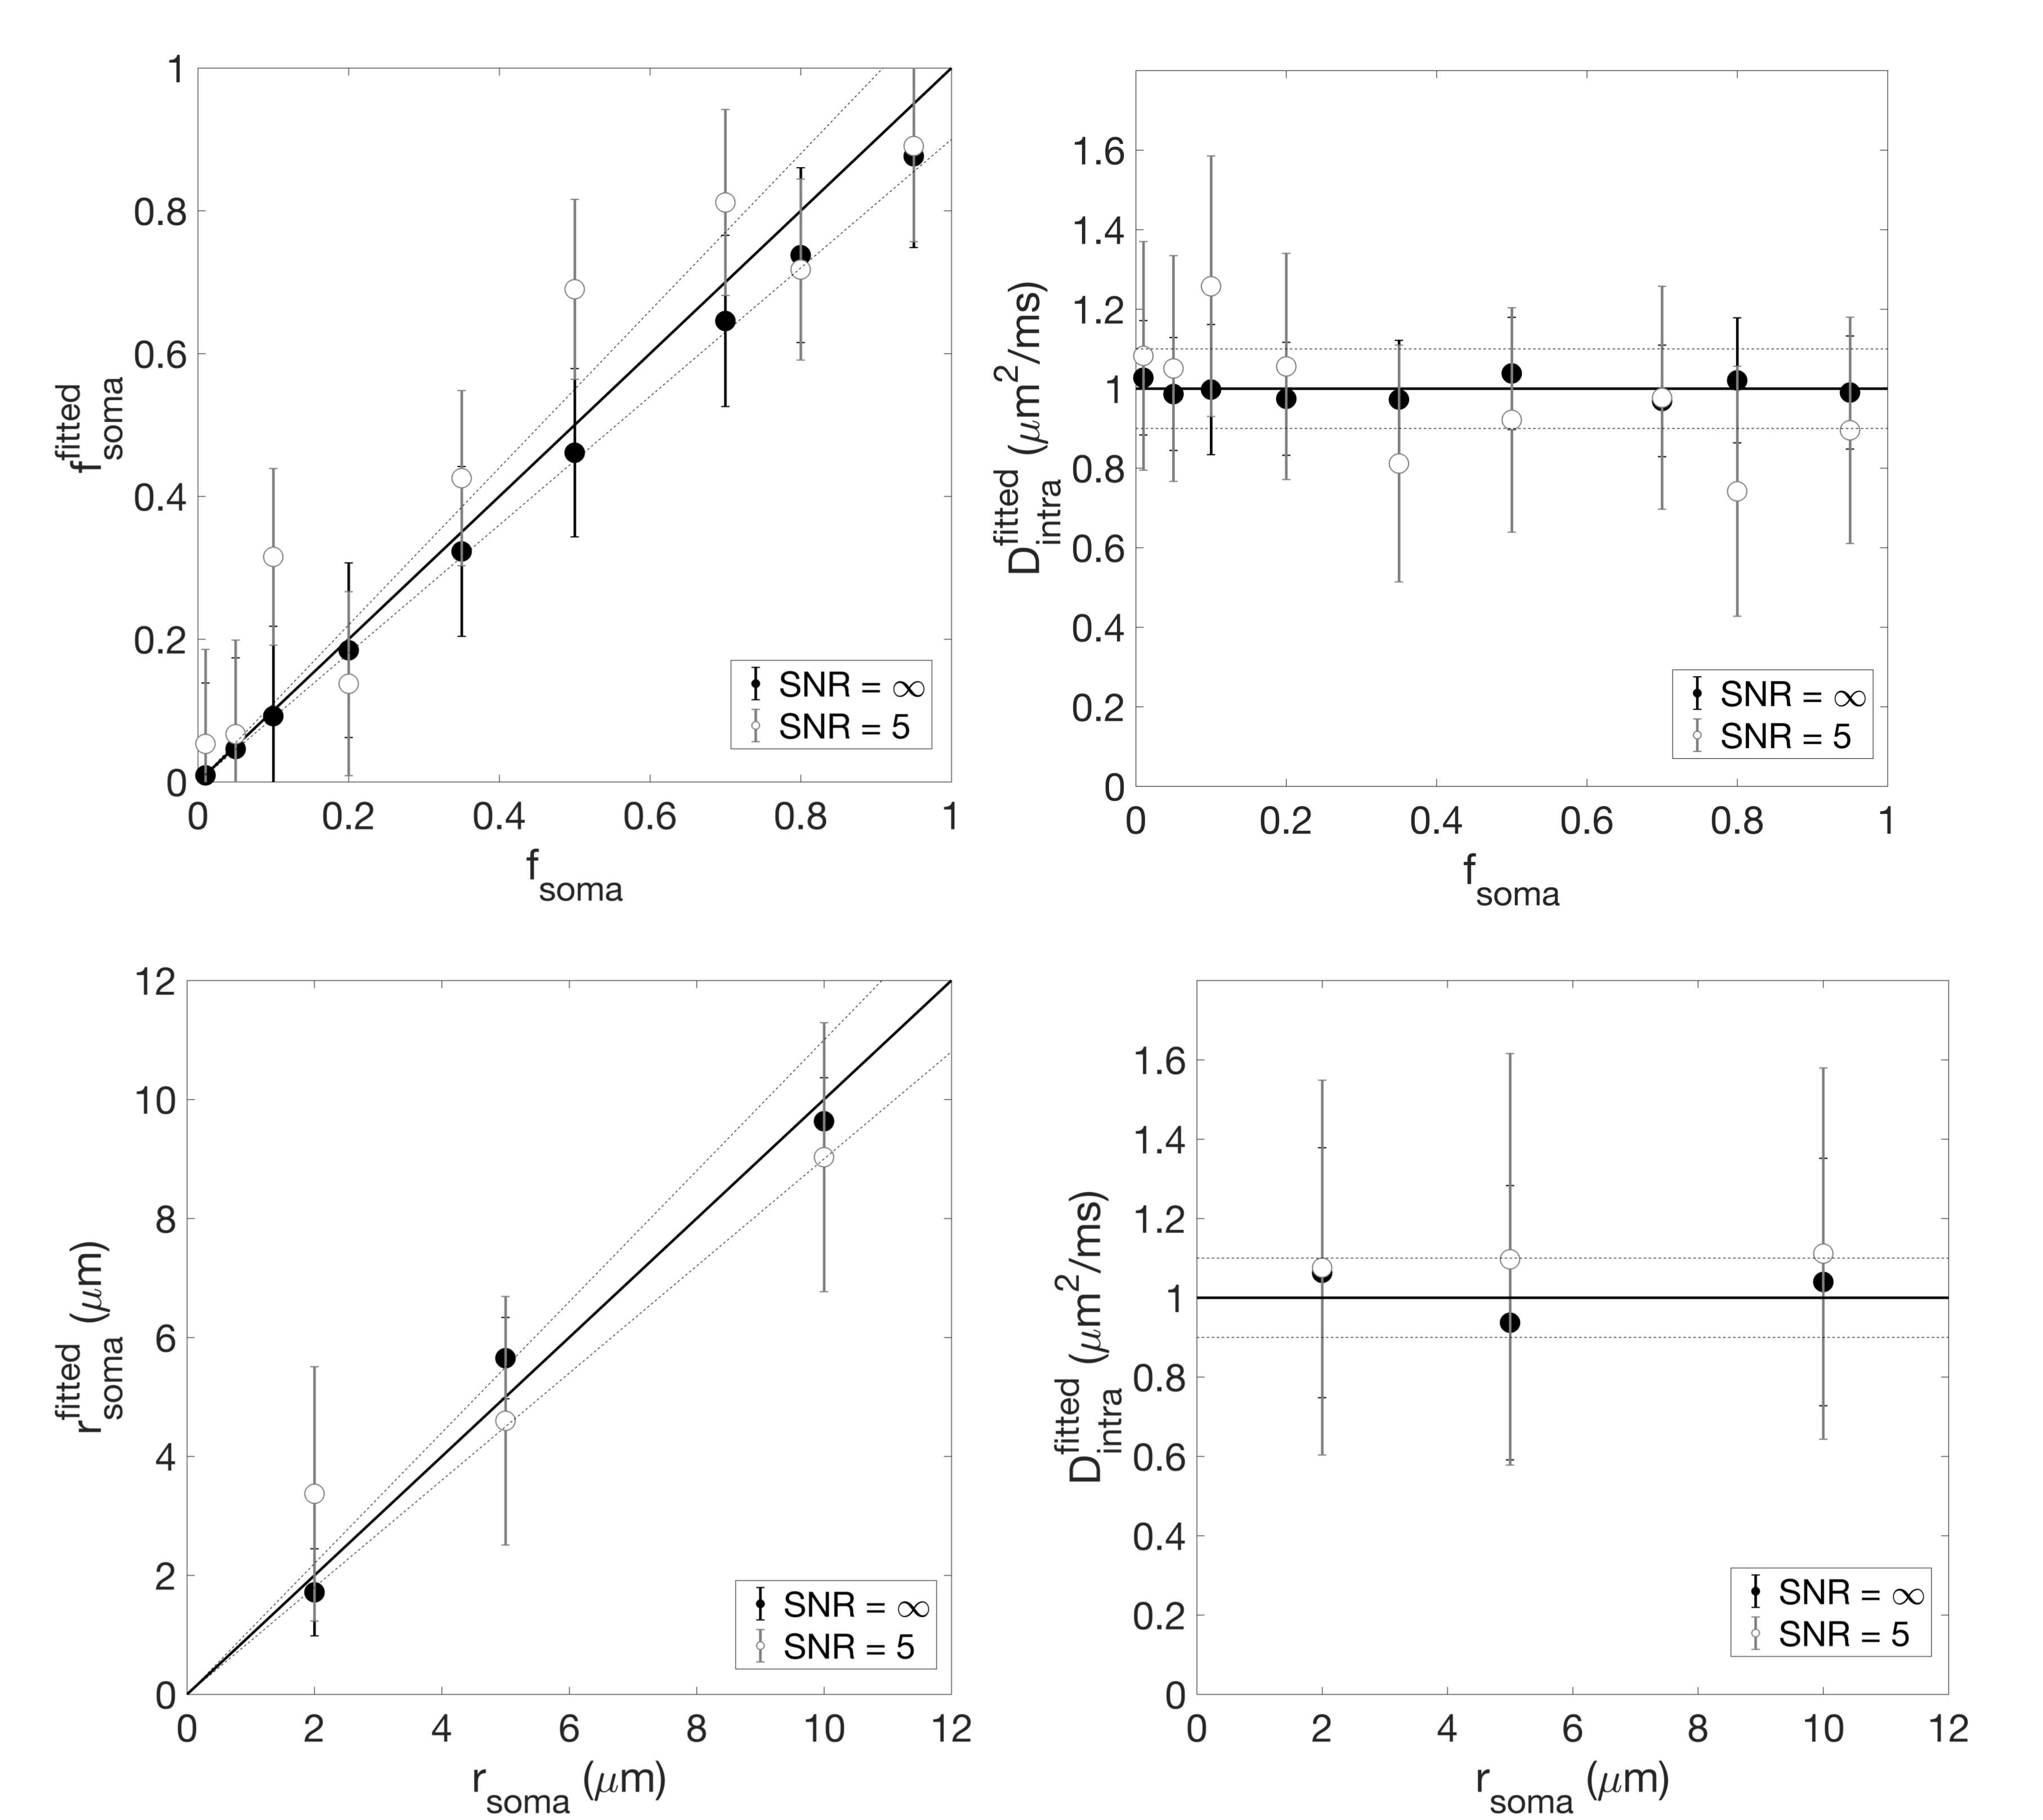
Numerical simulation. The validity of the non-exchange assumption was investigated by numerical simulation. Three-dimensional meshes of realistic cellular structures were implemented in CAMINO7 (Fig.1-a). Different (rsoma,fsoma) scenarios were simulated, and the direction-averaged DW-MRI signal was computed from a Pulsed-field-Gradients Spin-Echo (PGSE) sequence with 20 b-values=0-30 ms/µm2 and 60 directions, uniformly distributed over the full sphere (Fig.1-b). Gradient-pulse duration/separation, δ/Δ=4/7 ms. Model accuracy was evaluated by comparing model parameters’ values estimated by relation (1) with ground truth values (Fig.2).
Experimental Data. A healthy ex-vivo rat brain was investigated with a PGSE sequence at 16.4T (Bruker/Aeon): TE/TR=18/8000 ms; δ/Δ=4/7 ms; 16 b-values=0-15 ms/µm2, 10 uniformly distributed diffusion-encoding directions over a full sphere. The dataset was corrected for eddy-currents using FSL (https://fsl.fmrib.ox.ac.uk/fsl), and the direction-averaged DW-MRI signal computed.
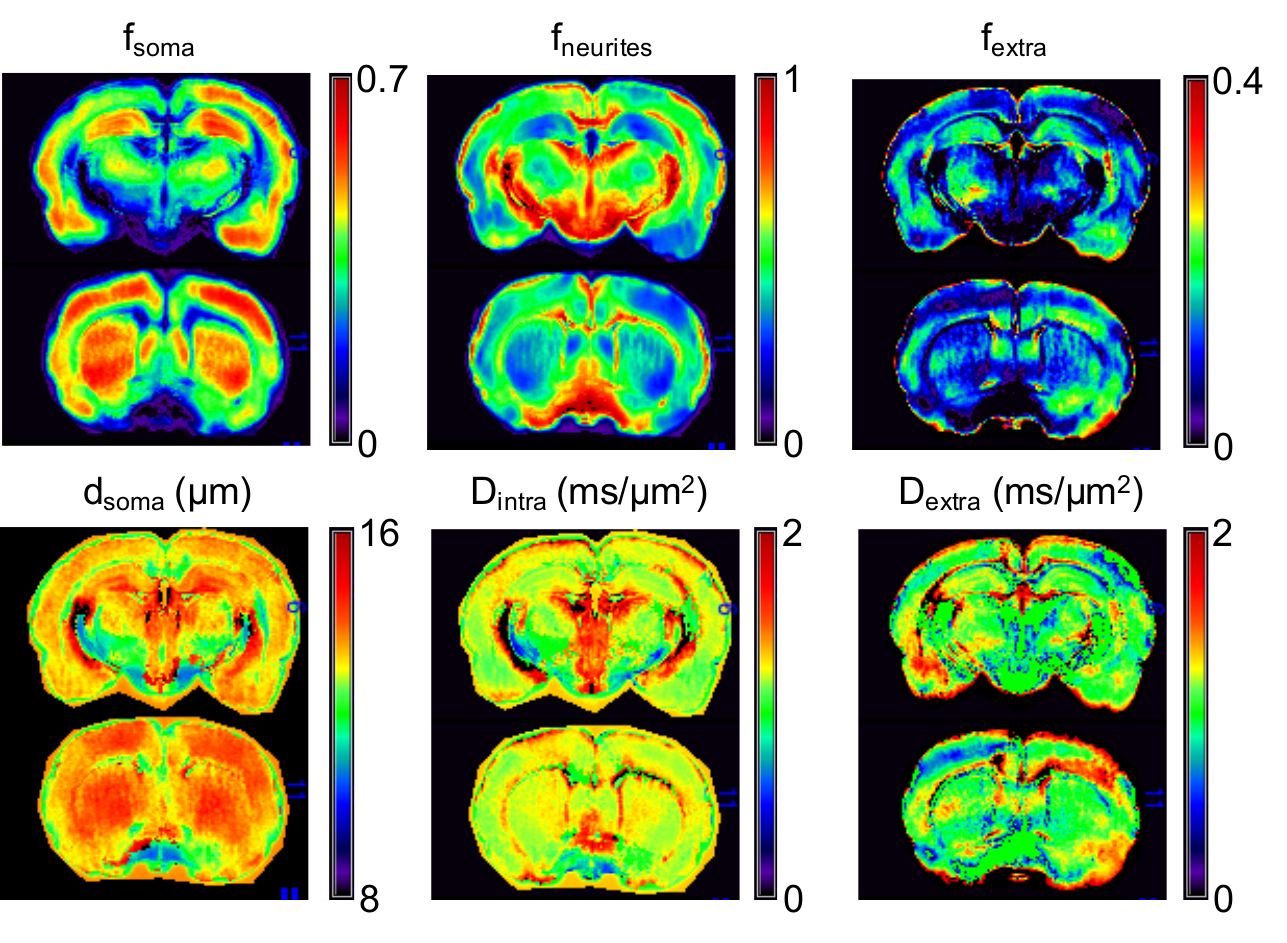
Data analysis. Parametric maps of fneurites,fsoma,Dintra,rsoma and fextra=1-fneurites-fsoma were computed by voxel-wise fitting relation (1) to signals from the experimental data for b>3 ms/µm2 using in-house Matlab script (Fig.3). These estimated model parameters were then fixed to estimate the extracellular water mean diffusivity, Dextra, by solving the linear system with positivity constraint using all the b-values:
-ln{[S(b)-S*(b)]/fextra}=bDextra (2)
From fneurites,fsoma,fextra, the whole brain average tissue composition was computed and compared with published histological values10-15. The fsoma map was directly compared with publicly available histology10,16 of the rat brain (Fig.4).
Results
Results (Fig.1-b and 2) show that the proposed model can closely approximate (within 10% accuracy) the connected cellular structure in the ideal case (SNR=$$$\infty$$$), and maintains good accuracy in the worse-case scenario (SNR=5). Quantitative maps of neurites and soma density match well the expected values from histology10-16 (Fig.4). Since DW-MRI cannot disentangle the component of neuronal from glial soma, the observed differences in DW-MRI and neuronal histology along the hippocampus profile (Fig.4-a) may be due to the larger presence of glial cells in that region. This hypothesis is supported by a second comparison with a combined “neurons+glia” histological density map, adapted from16 (Fig.4-b). Finally, the average estimated rsoma (6±1 µm) is also in good agreement with published histological estimates11,12.Discussion and Conclusion
Here we show that, according to the microstructure model we construct, from the intracellular water diffusion standpoint, the contribution of soma and neurites can be modelled as two non-exchanging compartments, suggesting that it is possible to quantify soma features in real tissue. However, our simulation ignores other potential effects, such as cell projections’ curvature and branching, and further validation will be required to assess the accuracy of the quantification.
While our results will require direct histological validation, the maps here reported already show some plausible contrast that might provide new insight into tissue architecture and provide markers of pathology. With the availability of powerful human scanners like the Connectom, this technique has the potential for translation into the clinic, opening a promising avenue for more in-depth assessment of cellular microstructure in-vivo in human brain.
Acknowledgements
This work was supported by EPSRC (EP/G007748, EP/I027084/01, EP/L022680/1, EP/M020533/1, N018702), EPSRC EP/M507970/1 and ERC under the European Union’s Horizon 2020 research and innovation programme (Starting Grant, agreement No. 679058). We like to acknowledge Dr. Ekaterina Vinnik for ex-vivo data acquisition.References
1 Zhang H, et al. NODDI: practical in vivo neurite orientation dispersion and density imaging of the human brain. Neuroimage 2012; 61 (4): 1000-1016.
2 Jespersen S N, Kroenke C D, Østergaard L, Ackerman J J, Yablonskiy D A. Modeling dendrite density from magnetic resonance diffusion measurements. Neuroimage 2007; 34(4): 1473-1486.
3 Assaf Y, Freidlin R Z, Rohde G K, Basser P J. New modeling and experimental framework to characterize hindered and restricted water diffusion in brain white matter. Mag. Reson. Med. 2004; 52(5): 965-978.
4 Kaden E, Kruggel F, Alexander D C. Quantitative mapping of the per‐axon diffusion coefficients in brain white matter. Mag. Reson. Med. 2016; 75(4): 1752-1763.
5 Veraart J, Fieremans E, Novikov D S. Universal power-law scaling of water diffusion in human brain defines what we see with MRI. arXiv preprint 2016; arXiv:1609.09145.
6 McKinnon E T, Jensen J H, Glenn G R, Helpern J A. Dependence on b-value of the direction-averaged diffusion-weighted imaging signal in brain. Mag. Reson. Imag. 2017; 36: 121-127.
7 Cook P A, Bai Y, Nedjati-Gilani S K K S, Seunarine K K, Hall M G, Parker G J, Alexander D C. Camino: open-source diffusion-MRI reconstruction and processing. In 14th scientific meeting of the international society for magnetic resonance in medicine 2004 (Vol. 2759). Seattle WA, USA.
8 Yang D M, Huettner J E, Bretthorst G L, Neil J J, Garbow J R, Ackerman J J H. Intracellular water preexchange lifetime in neurons and astrocytes. Magn. Reson. Med. 2017; doi:10.1002/mrm.26781
9 Grebenkov D S. NMR survey of reflected Brownian motion. Rev. Mod. Phys. 2007; 79(3): 1077.
10 BrainMaps: An Interactive Multiresolution Brain Atlas; http://brainmaps.org
11 Beebe N L, Young J W, Mellott J G, Schofield B R. Extracellular molecular markers and soma size of inhibitory neurons: evidence for four subtypes of gabaergic cells in the inferior colliculus. J. Neuroscience 2016; 36(14): 3988-3999.
12 Ono M, Yanagawa Y, Koyano K. GABAergic neurons in inferior colliculus of the GAD67-GFP knock-in mouse: electrophysiological and morphological properties. Neuroscience research 2005; 51(4): 475-492.
13 Voříšek I, Syková E. Evolution of anisotropic diffusion in the developing rat corpus callosum. J. Neurophysio. 1997; 78(2): 912-919.
14 Nicholson C, Syková E. (1998). Extracellular space structure revealed by diffusion analysis. Tren. Neuroscien. 1998; 21(5): 207-215.
15 Bandeira F, Lent R, Herculano-Houzel S. Changing numbers of neuronal and non-neuronal cells underlie postnatal brain growth in the rat. PNAS 2009; 106(33): 14108-14113.
16 Vandenberghe M E, et al. High-throughput 3D whole-brain quantitative histopathology in rodents. Scientific reports 2016, 6.
Figures