1093
Diffusion-time dependence of diffusional kurtosis in the mouse brain using pulsed and oscillating gradients1Department of Radiology and Radiological Science, Johns Hopkins University School of Medicine, Baltimore, MD, United States, 2Department of Neurology, Johns Hopkins University School of Medicine, Baltimore, MD, United States
Synopsis
Non-vanishing excess kurtosis and diffusion-time dependence are two key hallmarks of non-Gaussian or restricted water diffusion in complex brain tissue microenvironments. However, the relation between diffusional kurtosis and diffusion time in the brain remains elusive. In this work, we investigated the time-dependence of diffusional kurtosis in the mouse brain using pulsed- and oscillating-gradient (PGSE and OGSE) diffusion kurtosis imaging (DKI). The results of this work reveal unique tissue contrasts based on the time-dependence of diffusional kurtosis in both gray and white matter, with sensitivity to probe region-selective microstructural changes due to cuprizone-induced demyelination.
Introduction
In the presence of microstructural restrictions, water molecular diffusion in the brain is non-Gaussian. The fourth-order cumulant expansion used in diffusion kurtosis imaging (DKI) quantifies the deviation of spin displacement PDF from Gaussianity1, and can provide further insights into tissue microstructure than the second-order diffusion-tensor model. A second hallmark of non-Gaussian diffusion is the dependence of dMRI measurements on effective diffusion time2,3. Oscillating diffusion-encoding gradient waveforms in OGSE sequences4,5 can allow diffusivity changes to be probed in the ultra-short (<5 ms) diffusion-time regime, not accessible with conventional pulsed-gradient (PGSE) sequences. However, the relation between diffusional kurtosis and diffusion time in the brain remains elusive6. Here, we investigated the time-dependence of diffusion kurtosis in the mouse brain using pulsed- and oscillating-gradient DKI. Our results reveal, for the first time, unique tissue contrasts based on the diffusion-time dependence of diffusional kurtosis in both gray and white matter.Methods
Adult healthy C57BL/6 mice (n=5), mice placed on 0.2% cuprizone diet for 4-weeks (n=5), and age-matched controls (n=5) were used in this study. Mice were perfused with 4% PFA and dMRI of the brains was performed on an 11.7T Bruker scanner (100 G/cm single-axis gradients) using a 15-mm-diameter coil. PGSE data were acquired using a 3D diffusion-weighted gradient-and-spin-echo (GRASE) sequence7 (turbo factor/EPI factor=4/3, TE/TR=40/700 ms, δ/Δ=5/22 ms, NA=2) at an isotropic resolution of 125-µm. For OGSE experiments, cosine-trapezoid oscillating gradients were implemented to maximize the b-value under gradient limits8,9. OGSE data were acquired at an oscillation-frequency f=70 Hz (τeff~3.6 ms10) using 3D-GRASE with same parameters. Both PGSE and OGSE data were acquired along 18 uniformly-distributed directions and two b-values (2000, 4000 s/mm2). Maps of mean, axial, and radial kurtosis (MK, AK, and RK) were calculated independently for OGSE and PGSE using constrained linear-weighted DKI fitting11. ΔMK maps representing the change in mean kurtosis between long- and short- diffusion times were derived by calculating the difference between PGSE and OGSE-based maps. Data from each mouse were co-registered to one control brain using diffeomorphic registration. After MRI, cuprizone-treated and control brains were stained using gold-chloride to assess myelination in select areas.Results
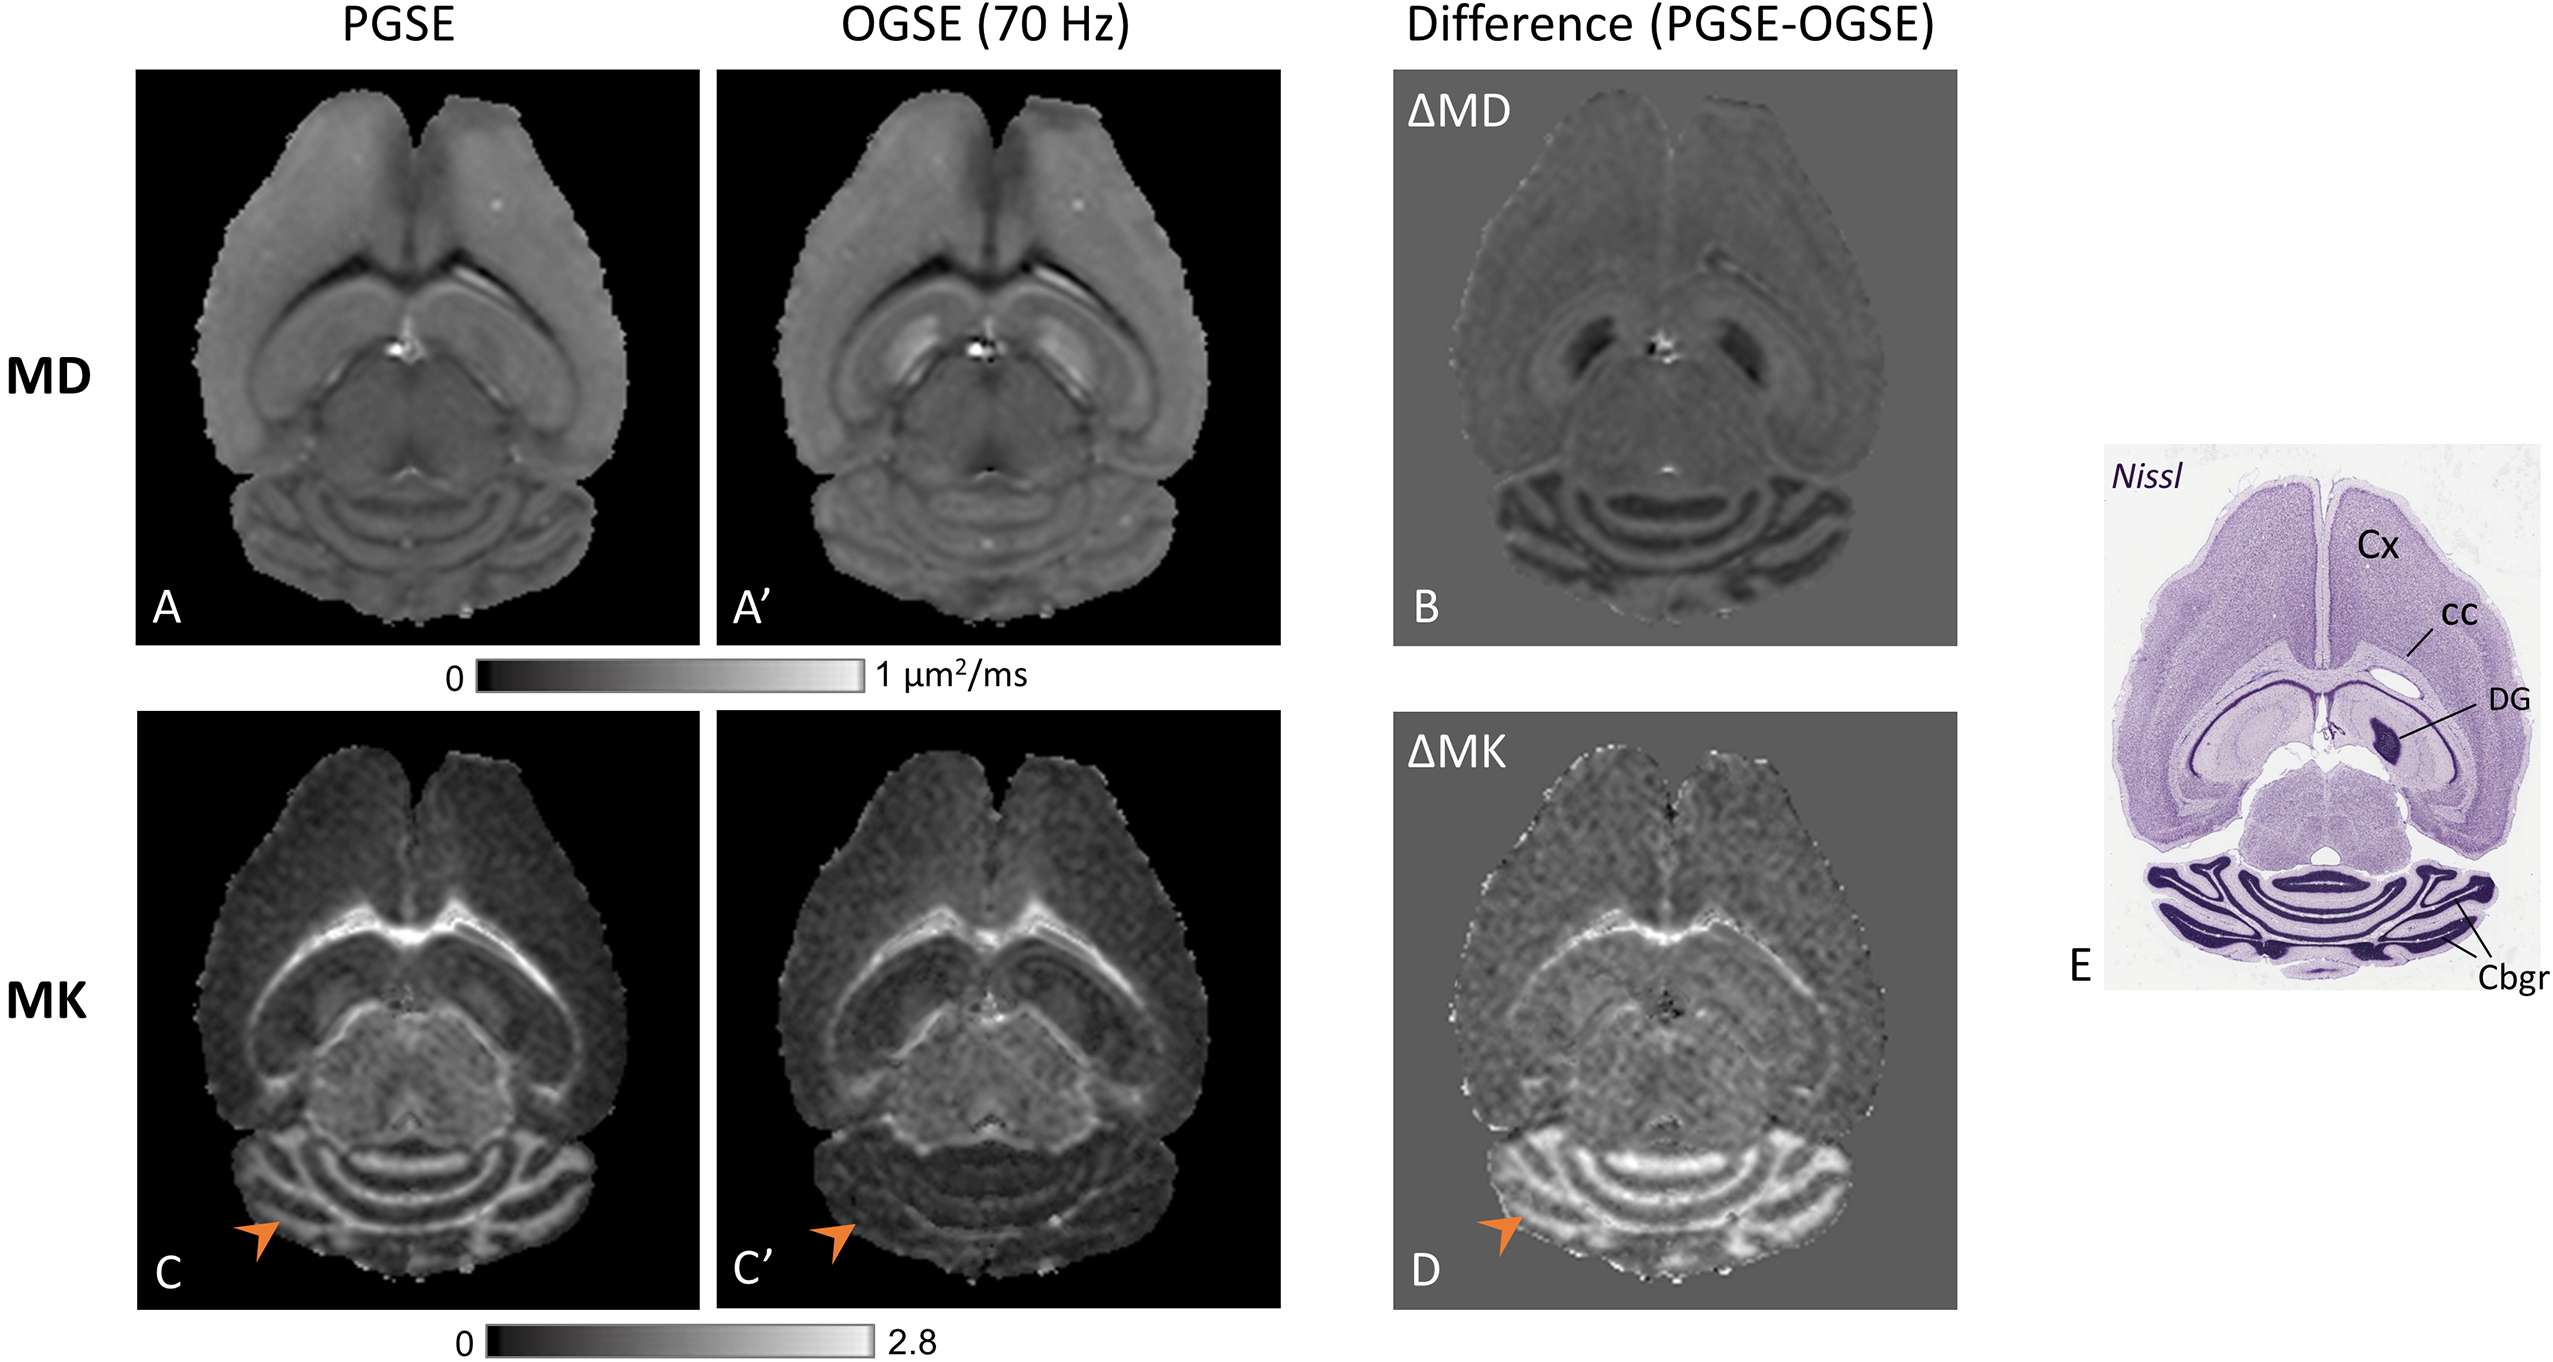
Fig. 1 shows PGSE- and OGSE-based mean diffusivity (MD) and MK maps from one representative mouse brain. ΔMD and ΔMK maps revealed unique and distinct time-dependent contrasts in specific brain regions. While MD showed significant time-dependent decrease in the cerebellar granule cell layer (Cbgr) and dentate gyrus (DG) similar to previous findings12, MK was found to exhibit a drastic time-dependent increase (p<0.001) in the Cbgr and white matter with no significant change in DG (Fig.1B-D). In PGSE maps, Cbgr was marked by drastically high MK (1.28±0.07) compared to other gray matter regions, whereas in OGSE maps, MK approached zero selectively in the Cbgr (arrowheads). The resulting contrast highlighting the Cbgr and corpus callosum (cc) in ΔMK maps is clearly seen in Fig. 1D, with reversed contrast between the Cbgr and cortex compared to the ΔMD map (Fig. 1B).
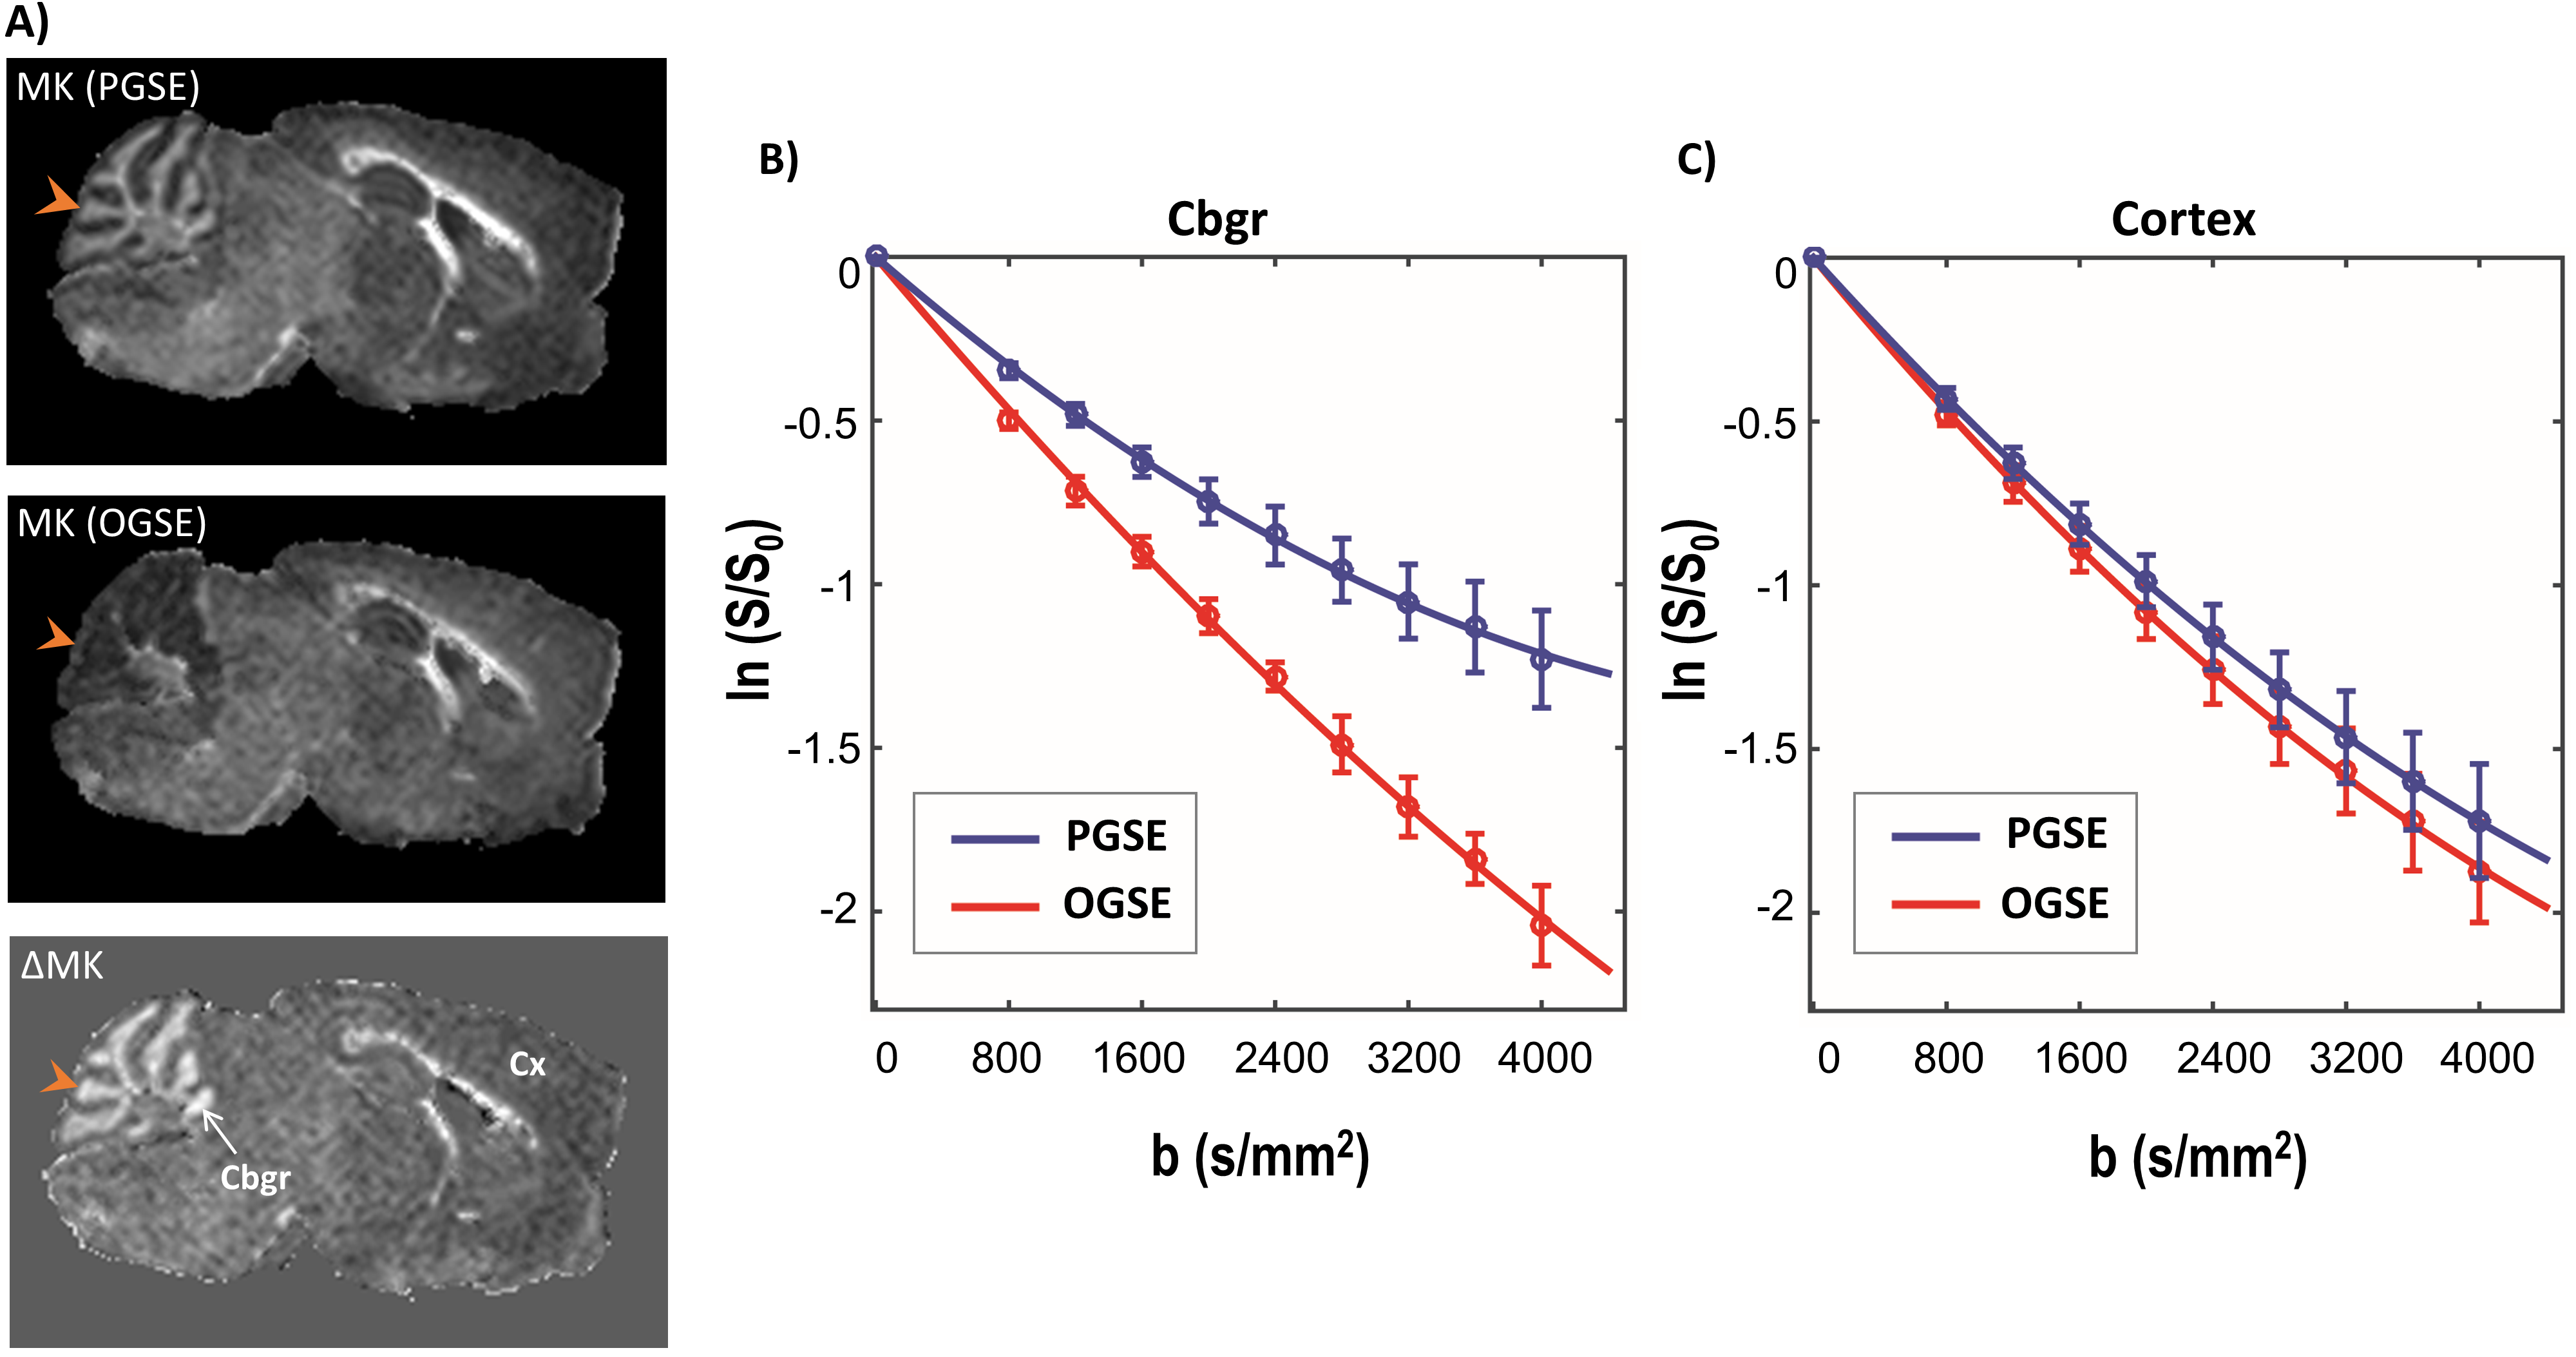
Fig. 2 shows plots of PGSE and OGSE signal attenuation versus b-value in the Cbgr and cortex. High kurtosis is apparent from the significant curvature of the log-signal plot for Cbgr with PGSE (blue, Fig. 2B), whereas the OGSE plot for Cbgr approximates a straight line (red, Fig. 2B) reflecting near-zero kurtosis, which suggests that diffusion becomes nearly unrestricted (Gaussian) in the Cgbr in this time-regime. In comparison, no significant time-dependent differences are observed between ln(S/S0) curves for the cortex (Fig. 2C).
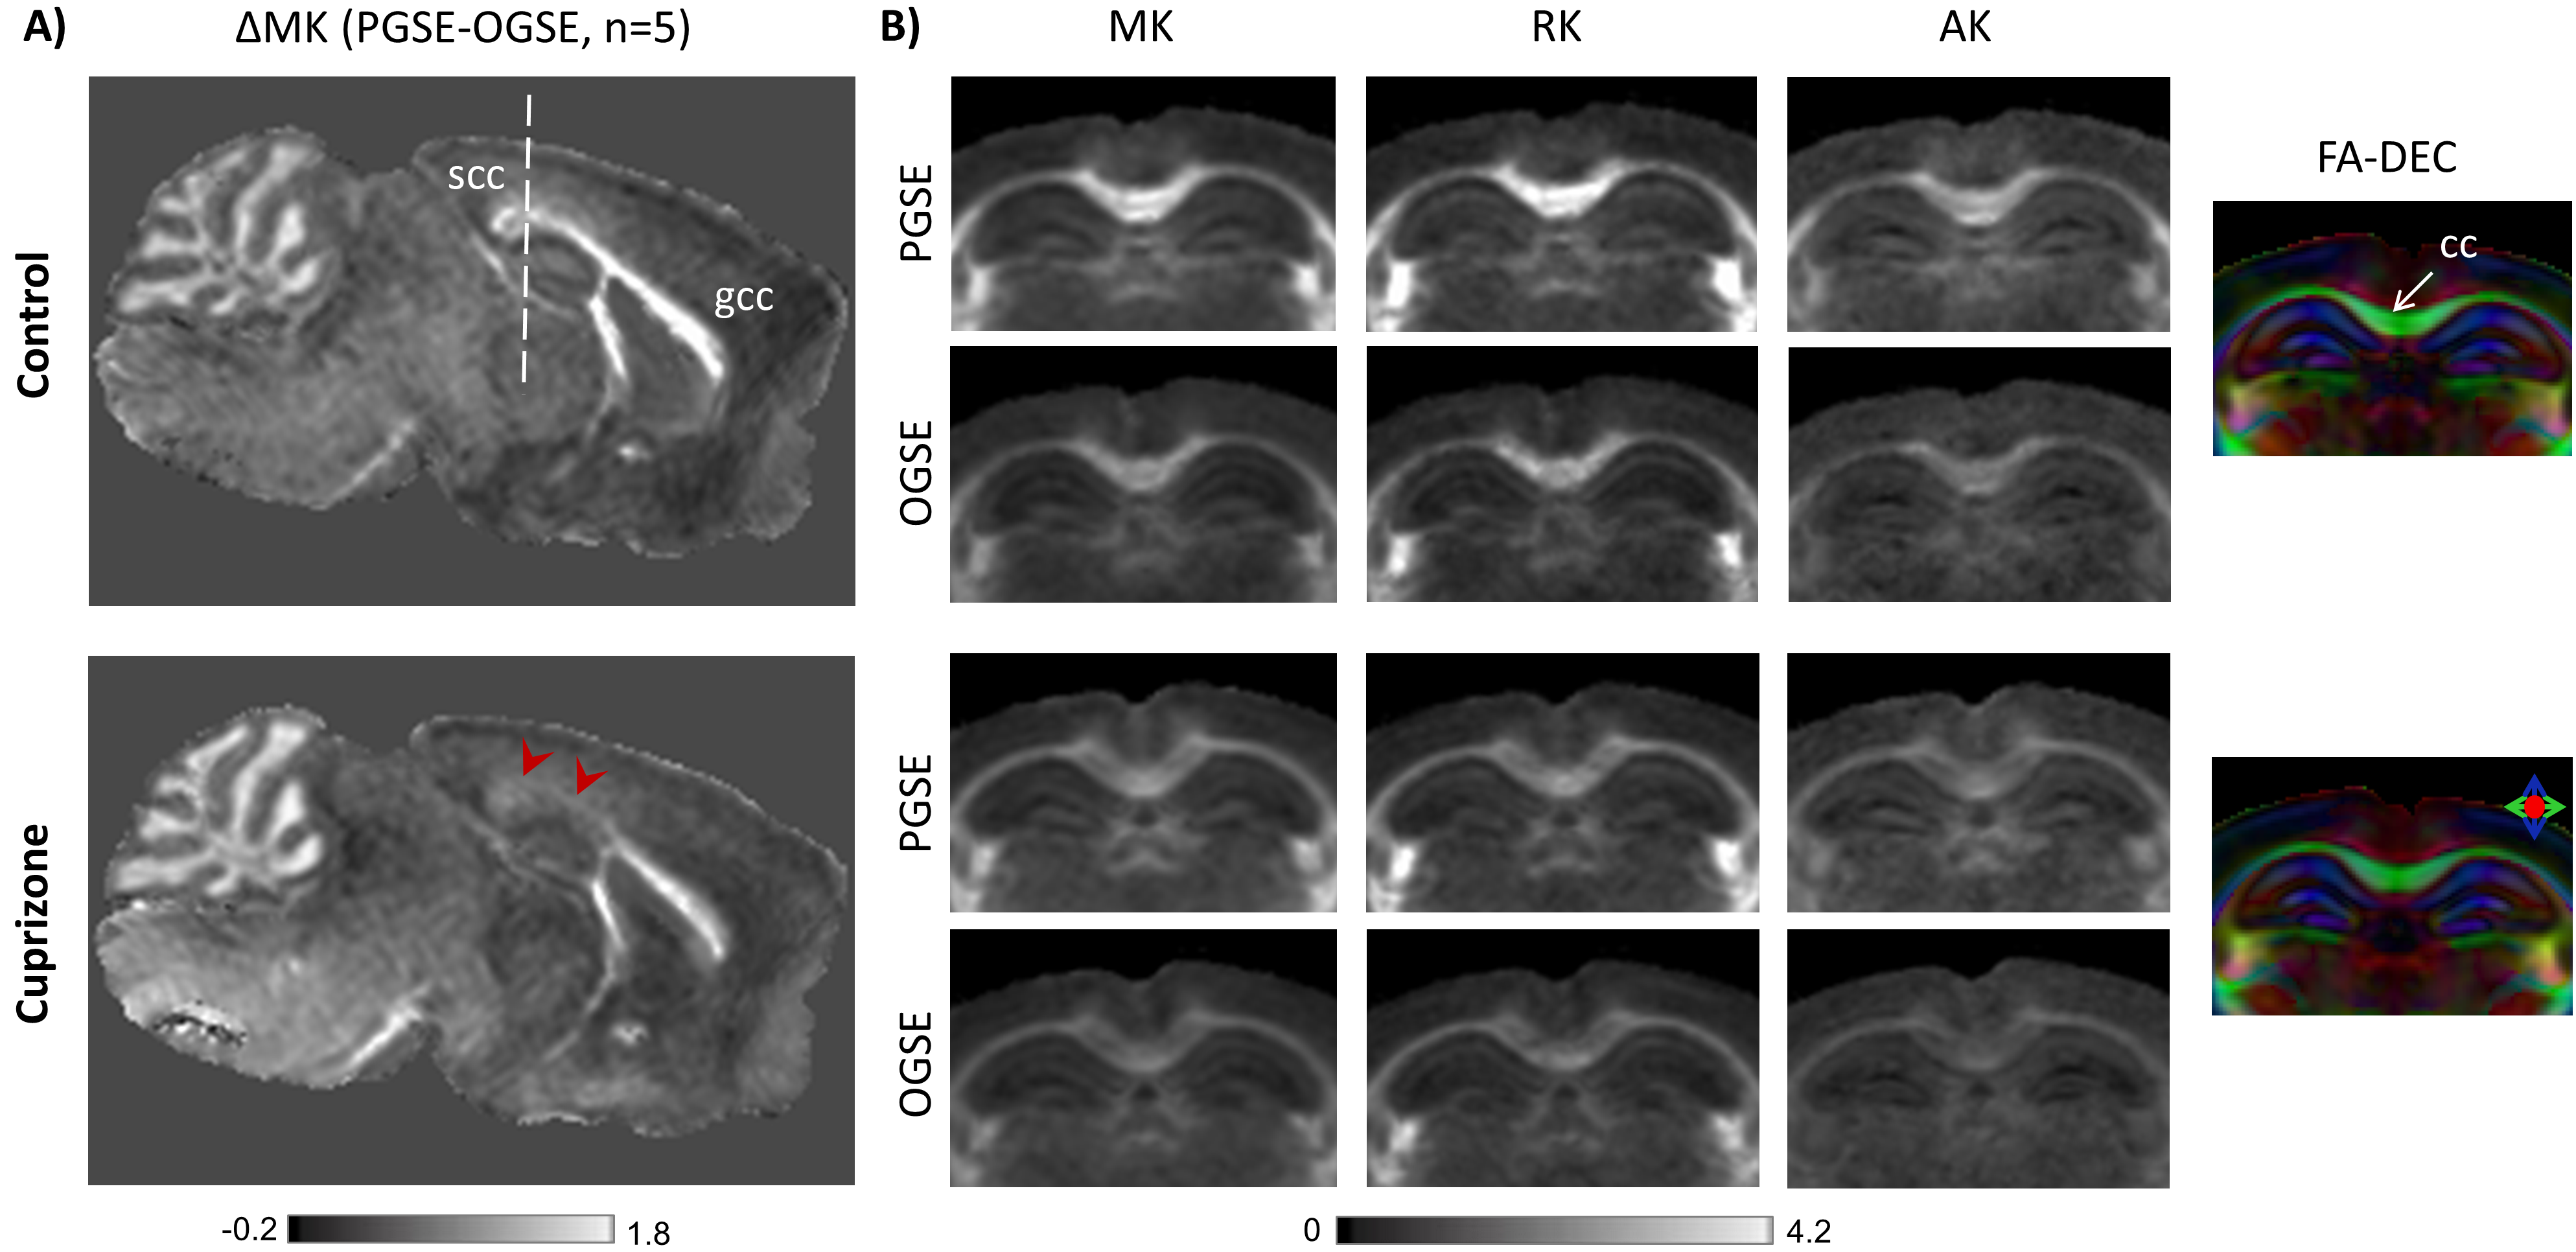
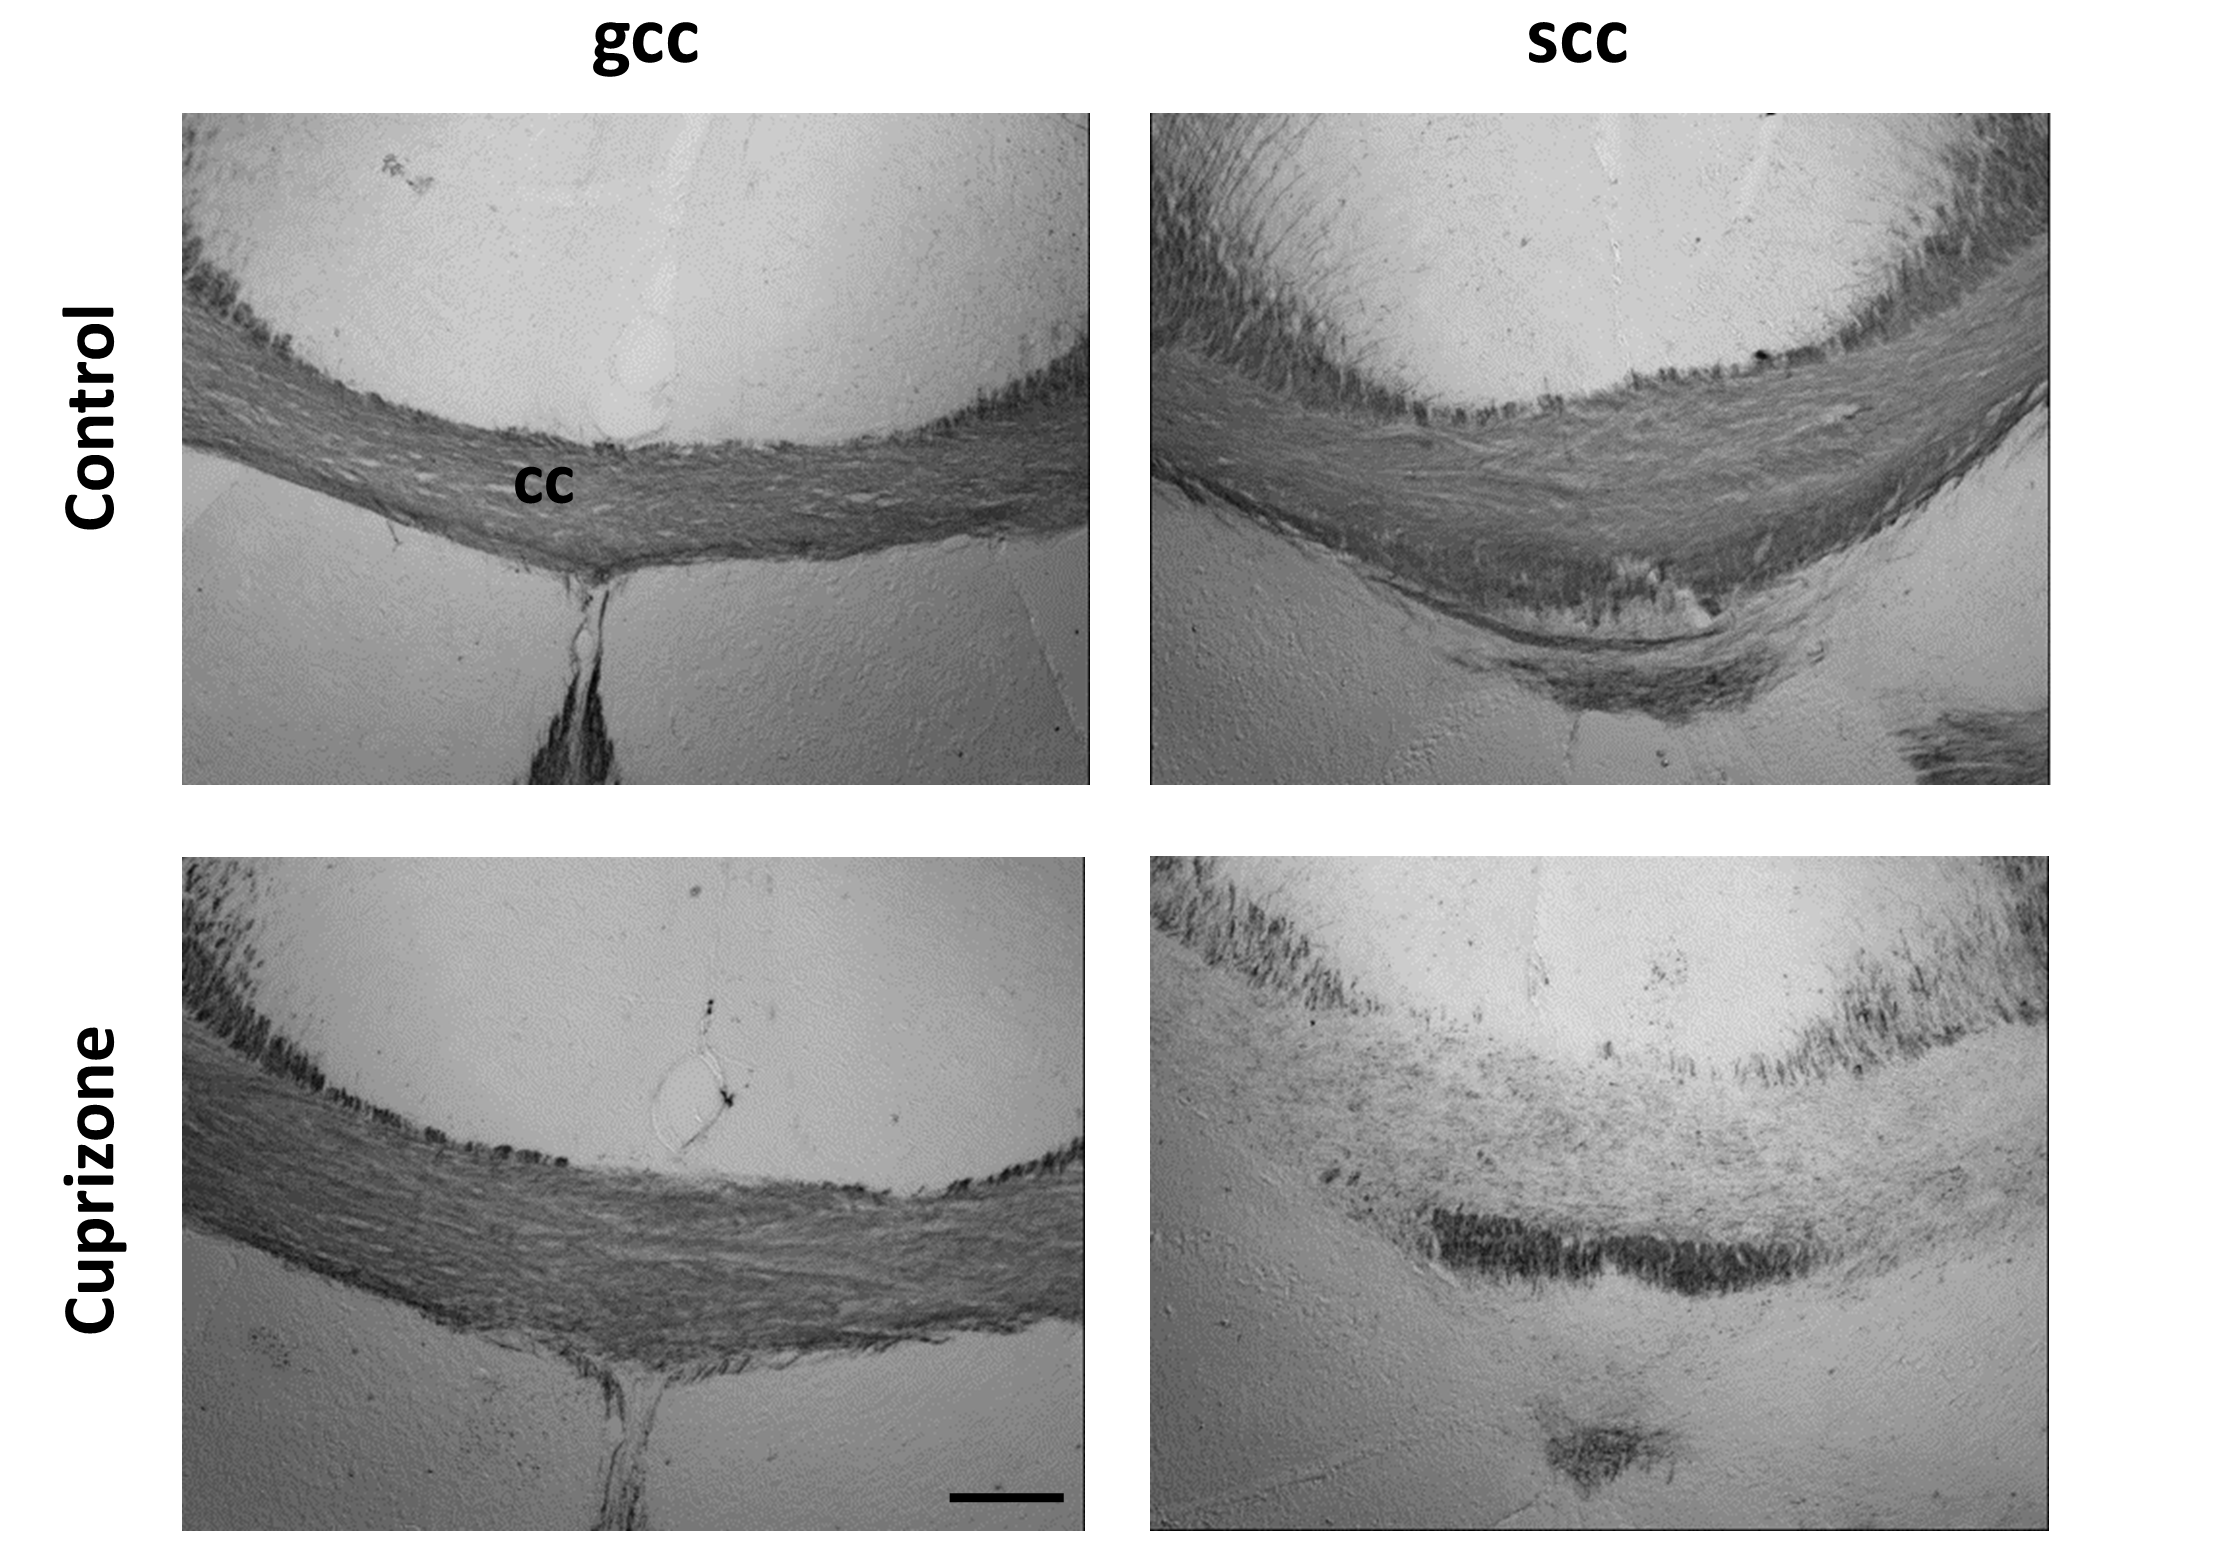
Fig. 3 shows group-averaged ΔMK maps of control and cuprizone-treated mice (n=5 each). ΔMK in mice with cuprizone-induced demyelination showed a selective decrease in the splenium of the corpus callosum (scc, arrowheads) compared to controls and the genu (gcc). Group-averaged PGSE- and OGSE-based DKI maps at the level of the scc (Fig. 3B) demonstrate clear time-dependence of MK, RK, and AK in white matter of control brains, with selective decrease in the time-dependent change observed in the scc of cuprizone-treated mice. Gold-chloride staining of the same brains (Fig. 4) revealed selective demyelination at week-4 of cuprizone treatment in the scc compared to the gcc.
Discussion and Conclusion
This study demonstrates unique diffusion-time dependence of diffusional kurtosis and its sensitivity to microstructural heterogeneity in gray and white matter. ΔMK and ΔMD maps revealed time-dependent contrasts in distinct brain regions, indicating that time-dependence of MK can probe microstructural features that are distinct from those probed with ΔMD. Selectively vanishing kurtosis in Cbgr in the OGSE time-regime can allow insights into restrictions or compartments that govern the transition of diffusion from Gaussian to non-Gaussian. While deciphering the microstructural correlates requires further investigation13,14, our findings demonstrate novel contrasts based on time-dependent kurtosis with unique sensitivity to probe cellular heterogeneity and pathological changes.Acknowledgements
This work was supported by the National Institutes of Health (NIH) grant R21NS096249.References
1. Jensen, J.H., J.A. Helpern, A. Ramani, H. Lu, and K. Kaczynski, Diffusional kurtosis imaging: the quantification of non-gaussian water diffusion by means of magnetic resonance imaging. Magn Reson Med, 2005. 53(6): p. 1432-40.
2. Latour, L.L., K. Svoboda, P.P. Mitra, and C.H. Sotak, Time-dependent diffusion of water in a biological model system. Proc Natl Acad Sci U S A, 1994. 91(4): p. 1229-33.
3. Stepišnik, J., Time-dependent self-diffusion by NMR spin-echo. Physica B: Condensed Matter, 1993. 183(4): p. 343-350.
4. Callaghan, P.T. and J. Stepišnik, Generalized analysis of motion using magnetic field gradients. Advances in Magnetic and Optical Resonance, 1996. 19: p. 325-388.
5. Gore, J.C., J. Xu, D.C. Colvin, T.E. Yankeelov, E.C. Parsons, and M.D. Does, Characterization of tissue structure at varying length scales using temporal diffusion spectroscopy. NMR Biomed, 2010. 23(7): p. 745-56.
6. Pyatigorskaya, N., D. Le Bihan, O. Reynaud, and L. Ciobanu, Relationship between the diffusion time and the diffusion MRI signal observed at 17.2 Tesla in the healthy rat brain cortex. Magn Reson Med, 2014. 72(2): p. 492-500.
7. Aggarwal, M., S. Mori, T. Shimogori, S. Blackshaw, and J. Zhang, Three-dimensional diffusion tensor microimaging for anatomical characterization of the mouse brain. Magn Reson Med, 2010. 64(1): p. 249-61.
8. Ianus, A., B. Siow, I. Drobnjak, H. Zhang, and D.C. Alexander, Gaussian phase distribution approximations for oscillating gradient spin echo diffusion MRI. J Magn Reson, 2013. 227: p. 25-34.
9. Van, A.T., S.J. Holdsworth, and R. Bammer, In vivo investigation of restricted diffusion in the human brain with optimized oscillating diffusion gradient encoding. Magn Reson Med, 2014. 71(1): p. 83-94.
10. Does, M.D., E.C. Parsons, and J.C. Gore, Oscillating gradient measurements of water diffusion in normal and globally ischemic rat brain. Magn Reson Med, 2003. 49(2): p. 206-15.
11. Tabesh, A., J.H. Jensen, B.A. Ardekani, and J.A. Helpern, Estimation of tensors and tensor-derived measures in diffusional kurtosis imaging. Magn Reson Med, 2011. 65(3): p. 823-36.
12. Aggarwal, M., M.V. Jones, P.A. Calabresi, S. Mori, and J. Zhang, Probing mouse brain microstructure using oscillating gradient diffusion MRI. Magn Reson Med, 2012. 67(1): p. 98-109.
13. Fieremans, E., D.S. Novikov, J.H. Jensen, and J.A. Helpern, Monte Carlo study of a two-compartment exchange model of diffusion. NMR Biomed, 2010. 23(7): p. 711-24.
14. Jespersen, S.N., J.L. Olesen, B. Hansen, and N. Shemesh, Diffusion time dependence of microstructural parameters in fixed spinal cord. Neuroimage, 2017.
Figures