1092
Probing microstructure with different tomographic methods: Comparing dMRI and X-ray scattering-derived parameters in mouse and human brains1NYU Langone Medical Center, New York, NY, United States, 2ETH Zurich, Zurich, Switzerland, 3Paul Scherrer Institute, Villigen, Switzerland, 4Chalmers University of Technology, Gothenburg, Sweden
Synopsis
Despite MRI’s coarse resolution, diffusion MRI (dMRI) enables probing cellular microstructure. Advanced dMRI acquisition and biophysical modeling can provide microstructural metrics related to disease processes, and spherical harmonics (SH)-based orientation distribution function (ODF). Yet, these still need structural validation, and a gold standard for quantifying microstructure, particularly fiber dispersion, is missing. X-ray scattering directly probes tissue microstructure, exploiting the ~17nm myelin repeat distance, and can also represent ODF in a SH basis. Here, we show good correspondence between SH coefficients from dMRI and X-ray scattering on a mouse brain, with analysis on human samples and histological validation to follow.
Introduction
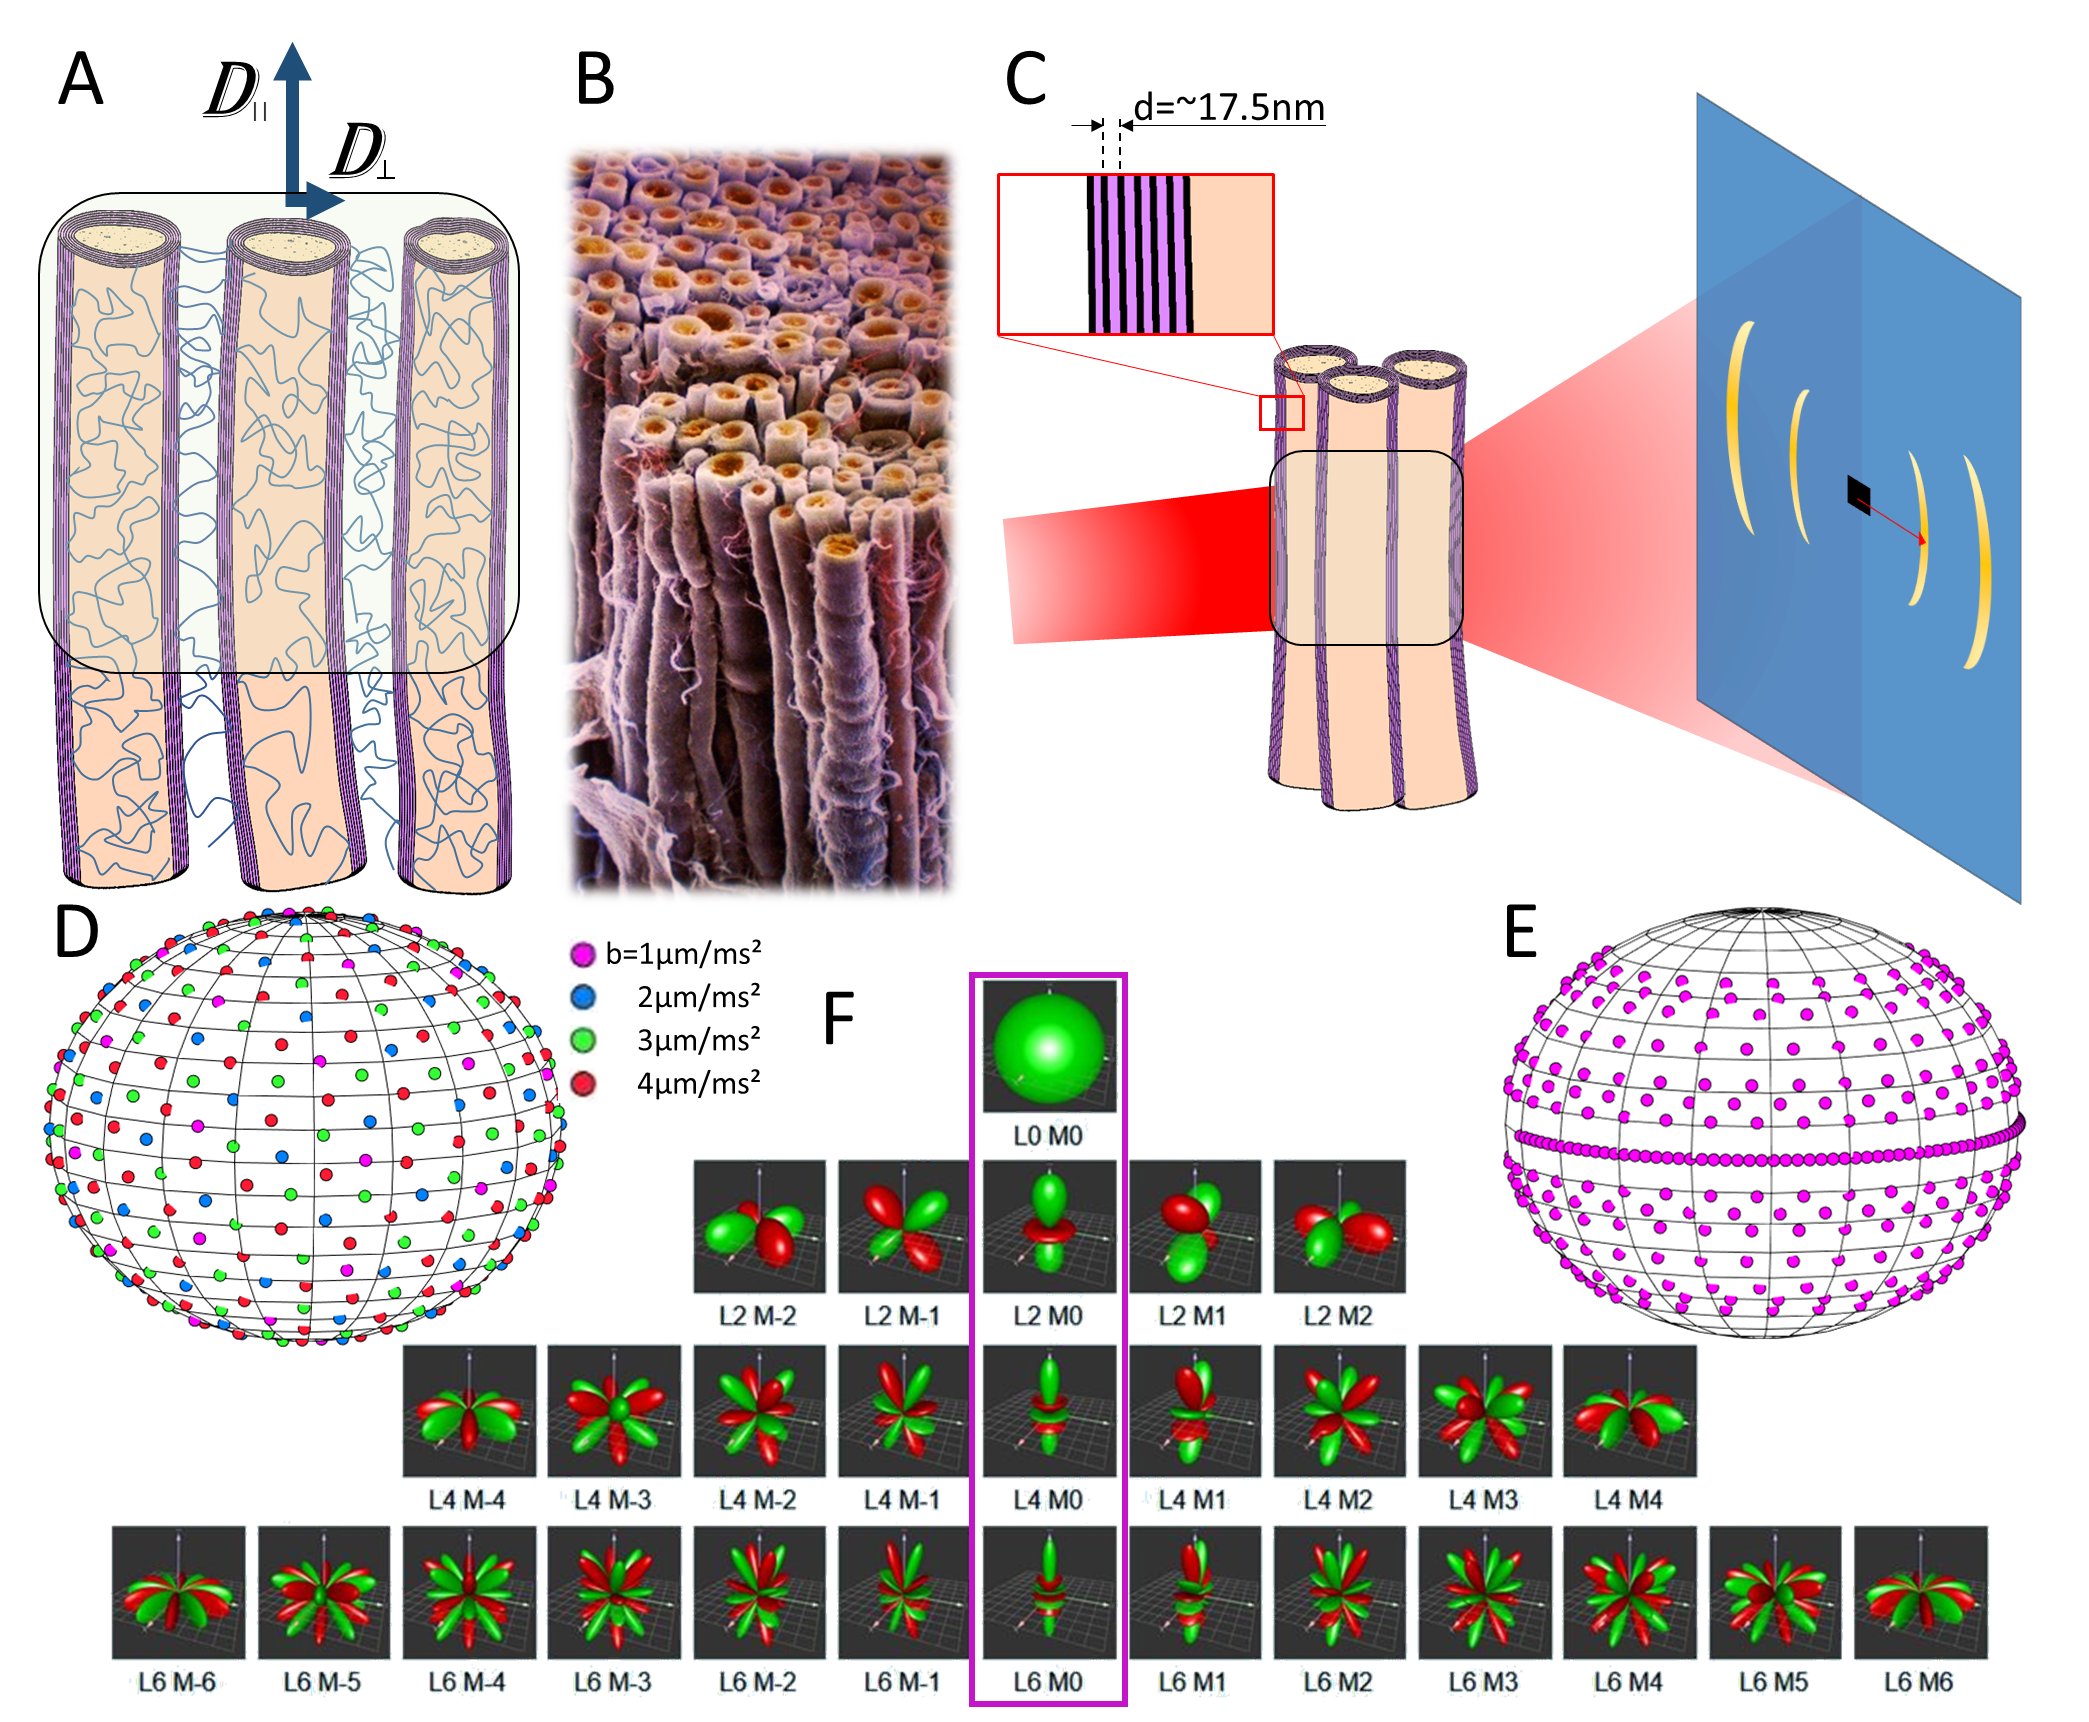
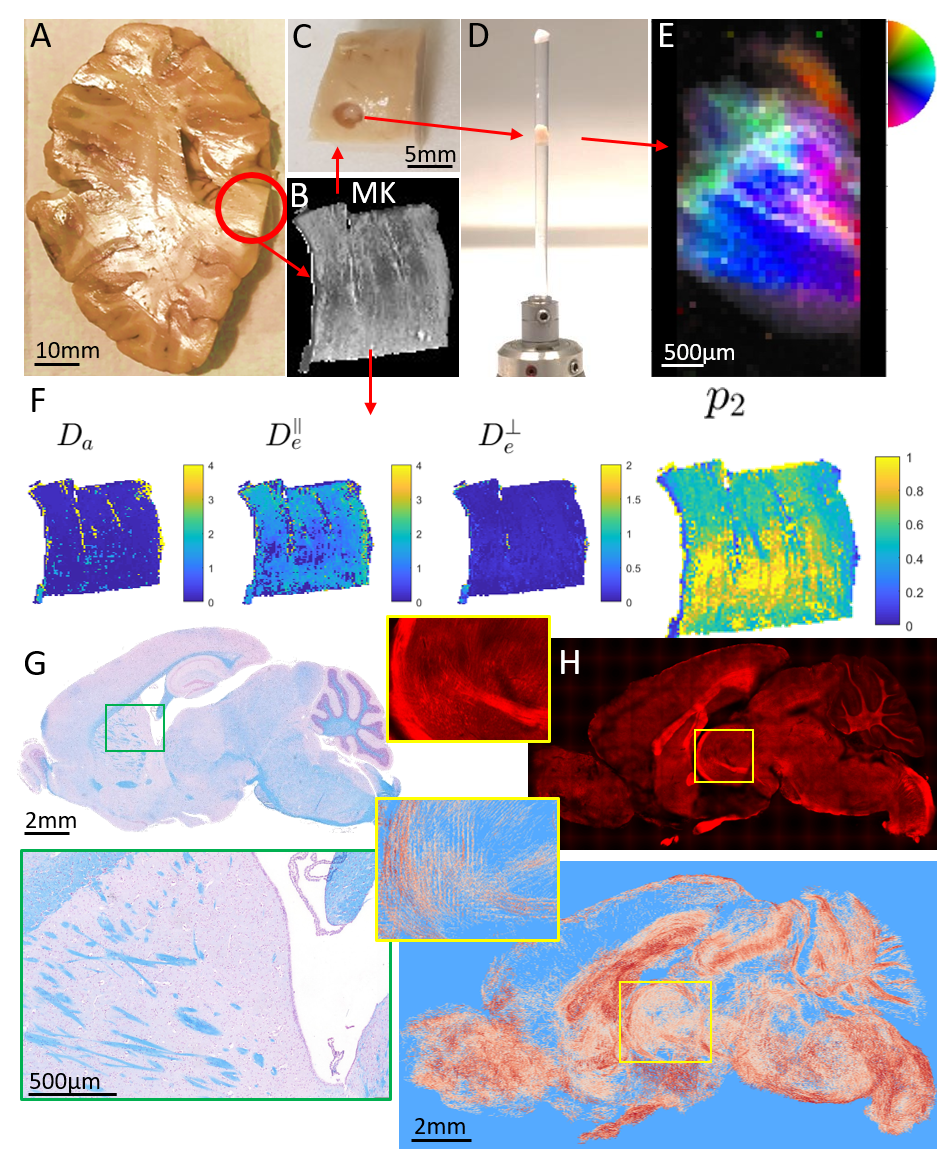
While resolution in MRI is at the millimeter (humans) or hundreds of micrometers (rodents) range, diffusion MRI (dMRI) provides an excellent tool for investigating microstructure properties, since movement of water molecules at usual echo times happens in the micrometer scale (Fig. 1A). Recent dMRI techniques have enabled extracting brain microstructure metrics related to disease processes (demyelination, axonal loss, beading, oedema and inflammation)1-3, and rotationally invariant parameters4,5 from spherical harmonics (SH)-based orientation distribution functions (ODFs), which can be used as input for fiber tracking. However, all these MRI metrics need structural validation. The recently developed Small-angle X-ray scattering tensor tomography (SAXSTT)6,7 technique (Fig. 1C) exploits myelin sheath periodicity to provide myelin content, fiber directionality and orientation distribution8 based on SH. In this study, we combine these two fundamentally different methods to derive and compare the same microstructural parameter, the SH-based P2 invariant4,5, representative of fiber ODF anisotropy.Methods
The brain of a healthy, 5-month-old C57BL/6 mouse was scanned ex vivo using a receive cryo-coil at the 9.4T Bruker MRI scanner in the Animal Imaging Center of ETH Zurich. Diffusion encoding was applied along 200 diffusion directions (Fig. 1D): 20 for b-value=1μm/ms², 40 for 2μm/ms², 60 for 3μm/ms² and 80 for 4μm/ms², with isotropic voxel size 75μm.
SAXSTT experiments were performed in the cSAXS beamline of Paul Scherrer Institute (PSI), Switzerland, according to Liebi et al.5 (isotropic voxel size: 150μm, beam energy: 16.3KeV, 267 projections, Fig. 1E). The X-ray dose of 105Gy deposited on the brain was below doses used in previous rodent brain experiments8. The myelin-specific signal, corresponding to myelin sheath periodicity (~17.5nm), was identified and isolated9. dMRI and SAXSTT results were registered to a common template, together with a detailed anatomic atlas10,11, for further analyses.
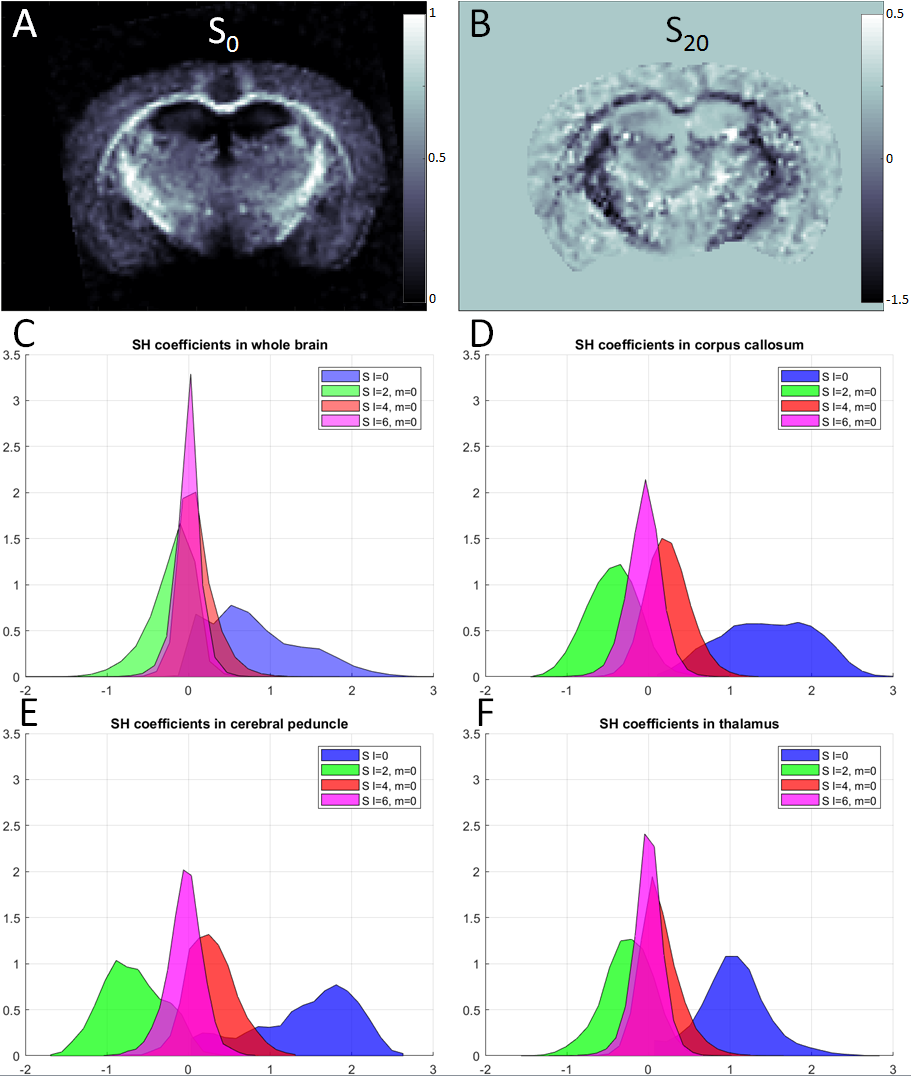
ODF SH coefficients $$$P(n) = \sum P_{lm} Y_{lm}(n)$$$ were derived for both methods. The P2 invariant from dMRI RotInv analysis4 is derived as a Euclidean norm of all 2nd order SHs. In order to directly compare the parameters from the different modalities, SAXSTT-derived S20 was converted to P2 using the inverse Funk-Radon transform (FRT) ( $$$S_{2m} \propto -\frac12 P_{2m}$$$ ), owing to the fact that SAXSTT measures the FRT of the myelinated-fiber ODF, i.e. a “doughnut” rather than a “stick”, (cf. Fig. 1A,C). Both signals have been additionally normalized from 0 to 1.
Results
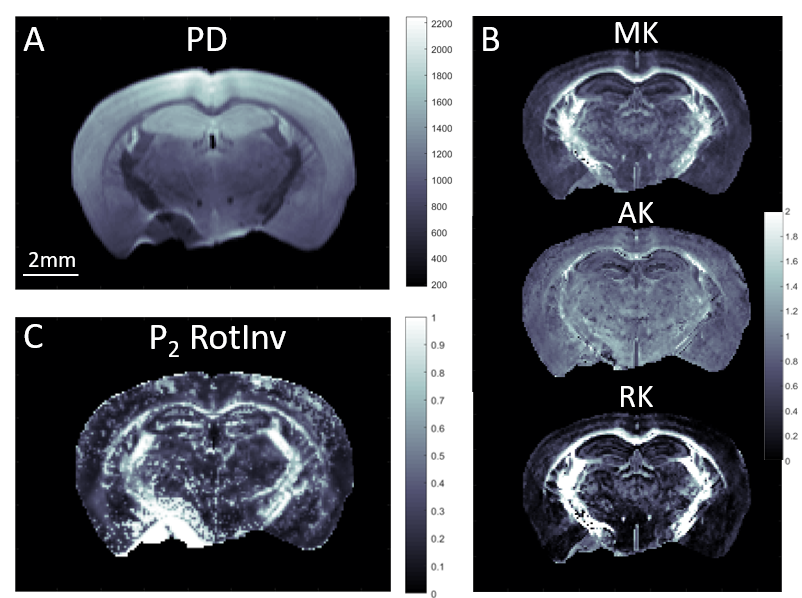
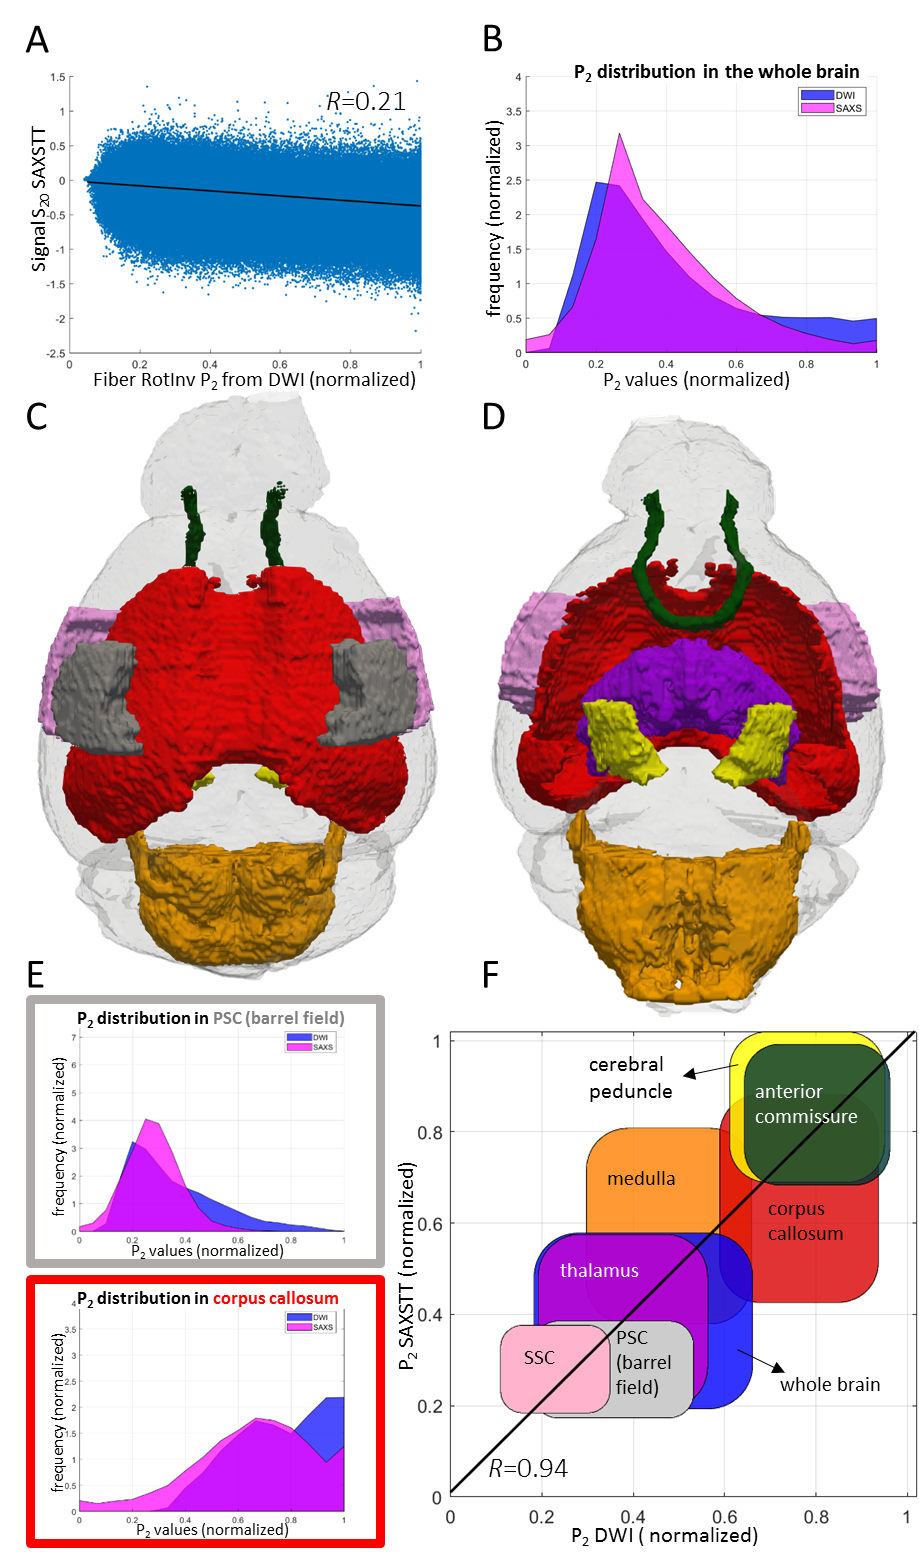
After performing the necessary post-processing steps to ensure high dMRI data quality12-14, microstructural parametric maps characterizing intra- and extra-axonal diffusivity, kurtosis and fiber ODF rotational invariants were produced according to 15 and 4 (Fig. 2). SAXSTT reconstruction provided myelin content and parametric maps of the brain (Fig. 3).Whole-brain voxel-to-voxel comparison shows weak correlation between dMRI and SAXSTT P2 (Pearson’s R=0.21) (Fig. 4A). Analysis of multiple white and gray matter ROIs (Fig. 4B,C) shows that P2 values are region-wise correlated (Fig. 4D-F): white matter-dominated areas (eg. corpus callosum, cerebral peduncle, anterior commissure) have significantly higher P2 values in both modalities than gray matter regions such as the thalamus or somatosensory cortex areas. Correlation of ROI average values is very high (R=0.94) (Fig. 4F).
Discussion
The use of two fundamentally different methods, dMRI and SAXSTT, has been demonstrated for assessing the same microstructural tissue parameter: the SH P2 coefficient, main indicator of fiber anisotropy. Whole-brain voxel-to-voxel comparison results in a weak correlation (Fig. 4A), presumably due to the signal being sensitive to noise coming from registration, partial-volume effects, which both add to the inherent sensitivity of the derived SH coefficients, a result high-order non-linear fitting. Another contributing factor to low correlation is the fact that the two methods derive ODFs measuring fundamentally different tissue properties. However, after the coefficients are rendered directly comparable (via FRT and normalization) (Fig. 4B), ROI analysis shows a remarkably high correlation (R=0.94, Fig. 4F). Cancelling of the previously mentioned “noise” effects by averaging in each ROI contributes to the high correlation. Although this result is very promising, especially if one considers the complete orthogonality of the methods used and of the phenomena exploited, it needs further analysis, using more samples (in number and diversity) and validation by the destructive “ground truth” methods, 2D and 3D histology –both steps are planned (Fig. 5).Conclusions
This study investigated correlation of structural parameters characterizing the fiber ODF, derived by high-order fitting of signal ODFs retrieved from two fundamentally different methods: dMRI and X-ray scattering. A surprisingly high correlation was found for the SH P2 coefficient, which characterizes local tissue anisotropy. Such investigations aim to enhance the understanding of the structural underpinning of dMRI parameters, and aim to validate ex vivo novel metrics that enhance fiber tracking by directly providing spherical harmonics coefficients, so that these can be eventually used in vivo.Acknowledgements
Research was supported by the Early Postdoc.Mobility Fellowship of the Swiss National Science Foundation and the National Institute of Neurological Disorders and Stroke of the National Institutes of Health under award number R01NS088040.References
- Fieremans, E., et al. Diffusion distinguishes between axonal loss and demyelination in brain white matter. in ISMRM. 2012. Melbourne, Australia: Proceeding of International Society of Margnetic Resonance in Medicine.
- Jelescu, I.O., et al., In vivo quantification of demyelination and recovery using compartment-specific diffusion MRI metrics validated by electron microscopy. NeuroImage, 2016.
- Budde, M.D. and J.A. Frank, Neurite beading is sufficient to decrease the apparent diffusion coefficient after ischemic stroke. Proc Natl Acad Sci U S A, 2010. 107(32): p. 14472-7.
- Novikov, D.S., et al., Mapping orientational and microstructural metrics of neuronal integrity with in vivo diffusion MRI. arXiv preprint, 2016(arXiv:1609.09144).
- Reisert, M., et al., Disentangling micro from mesostructure by diffusion MRI: A Bayesian approach. NeuroImage, 2017. 147: p. 964-975.
- Liebi, M., et al., Nanostructure surveys of macroscopic specimens by small-angle scattering tensor tomography. Nature, 2015. 527(7578): p. 349-352.
- Schaff, F., et al., Six-dimensional real and reciprocal space small-angle X-ray scattering tomography. Nature, 2015. 527(7578): p. 353-356.
- Georgiadis, M., et al. MRI vs. X-ray scattering: comparative study of myelin distribution, fiber direction and white matter tracts in mouse brain. in ISMRM 25th Annual Meeting. 2017. Hawaii, 22-27 April 2017.
- Jensen, T.H., et al., Brain tumor imaging using small-angle X-ray scattering tomography. Physics in Medicine and Biology, 2011. 56(6): p. 1717-1726.
- Jensen, T.H., et al., Molecular X-ray computed tomography of myelin in a rat brain. NeuroImage, 2011. 57(1): p. 124-129.
- https://wiki.mouseimaging.ca/display/MICePub/Mouse+Brain+Atlases#MouseBrainAtlases-Dorr-Steadman-Ullmann-Richards-Qiu-Egan(40micron,DSURQE).
- Dorr, A.E., et al., High resolution three-dimensional brain atlas using an average magnetic resonance image of 40 adult C57Bl/6J mice. NeuroImage, 2008. 42(1): p. 60-69.
- Ades-Aron, B., et al., Diffusion parameter EStImation with Gibbs and NoisE Removal (DESIGNER) in ISMRM. 2016: Singapore.
- Veraart, J., et al., Denoising of diffusion MRI using random matrix theory. NeuroImage, 2016. 142(Supplement C): p. 394-406.
- https://github.com/NYU-DiffusionMRI/Diffusion-Kurtosis-Imaging.
- Fieremans, E., J.H. Jensen, and J.A. Helpern, White matter characterization with diffusional kurtosis imaging. NeuroImage, 2011. 58(1): p. 177-188.
- http://infinity-imagined.tumblr.com/post/4720654940/a-cross-section-of-a-bundle-of-nerve-fibers.
- https://people.csail.mit.edu/sparis/sh/.
Figures