1090
Tensor-valued diffusion MRI in under 3 minutes: An initial survey of microscopic anisotropy and tissue heterogeneity in four brain tumor types1Clinical Sciences Lund, Radiology, Lund University, Lund, Sweden, 2Random Walk Imaging, Lund, Sweden, 3Brigham and Women's Hospital, Harvard Medical School, Boston, MA, United States
Synopsis
Microscopic diffusion anisotropy and tissue heterogeneity are two independent features of tumor microstructure that can be probed by diffusion MRI but only by using so-called b-tensor encoding. These independent features reflect cell shapes and cell density variance in tumors. Here, we demonstrate high-quality maps of these features, derived from data acquired in only 3 minutes, in patients with various brain tumor histologies. Several remarkable features were observed which suggest that the maps may contribute valuable diagnostic information, in particular since the features vary both within and between tumors.
Introduction
Diffusional kurtosis imaging yields information on tissue microstructure1 and allows for improved specificity and sensitivity in brain tumor diagnosis.2,3 However, two distinctly different microstructure features contribute to a high kurtosis: microscopic anisotropy and tissue heterogeneity, reflecting elongated cell structures and heterogeneity in cell density, respectively.4 Separation of these features requires an approach that goes beyond conventional diffusion MRI: tensor-valued diffusion encoding.5,6 The purpose of this study was to demonstrate that this novel imaging technique can be performed in just 3 minutes of scan time, and to provide an initial survey of the microscopic anisotropy and tissue heterogeneity in four types of brain tumors.Methods
Imaging was performed on a 3T MAGNETOM Prisma with a 20-channel head coil array (Siemens Healthcare, Erlangen, Germany) with a prototype spin-echo sequence that enables b-tensor diffusion encoding (using TE=80 ms, TR=3.2 s, FOV=230×230 mm2, slices=21, resolution=2.3×2.3×2.3 mm3, iPAT=2, partial-Fourier=6/8, and four equidistant b-values between 0.1 and 2.0 ms/µm2). Numerical gradient waveform optimization was used to minimize TE.7 Parameters were calculated by fitting the mean diffusivity (MD) and the anisotropic and isotropic kurtosis components (MKA, MKI) to the data using the following equation:4,5,6
$$ S(b,b_{\Delta})=\exp(–b\text{MD}+b^2\text{MD}^2\text{MK}_\text{I}/6+b^2_{\Delta}b^2 \text{MD}^2\text{MK}_\text{A}/6)$$
where $$$b$$$ and $$$b_\Delta$$$ are the b-value and the b-tensor shape, respectively.8 In tumors, the $$$MK_A$$$ parameter represents microscopic anisotropy, and the $$$MK_I$$$ parameter tissue heterogeneity,4 and will thus be referred to as such herein. The analysis was implemented in Matlab (The MathWorks, Natick, MA, USA), and is available at https://github.com/markus-nilsson/md-dmri. At the time of writing, this ongoing study examined nine high-grade gliomas (grade III and IV), two metastases, one pituitary adenoma, and five meningiomas. Regions of interest were drawn in the contrast-enhancing regions, excluding necrotic parts where the mean diffusivity was above 2 µm2/ms. ROIs were also drawn in uninvolved frontal white matter to characterize normal appearing white matter.
Results
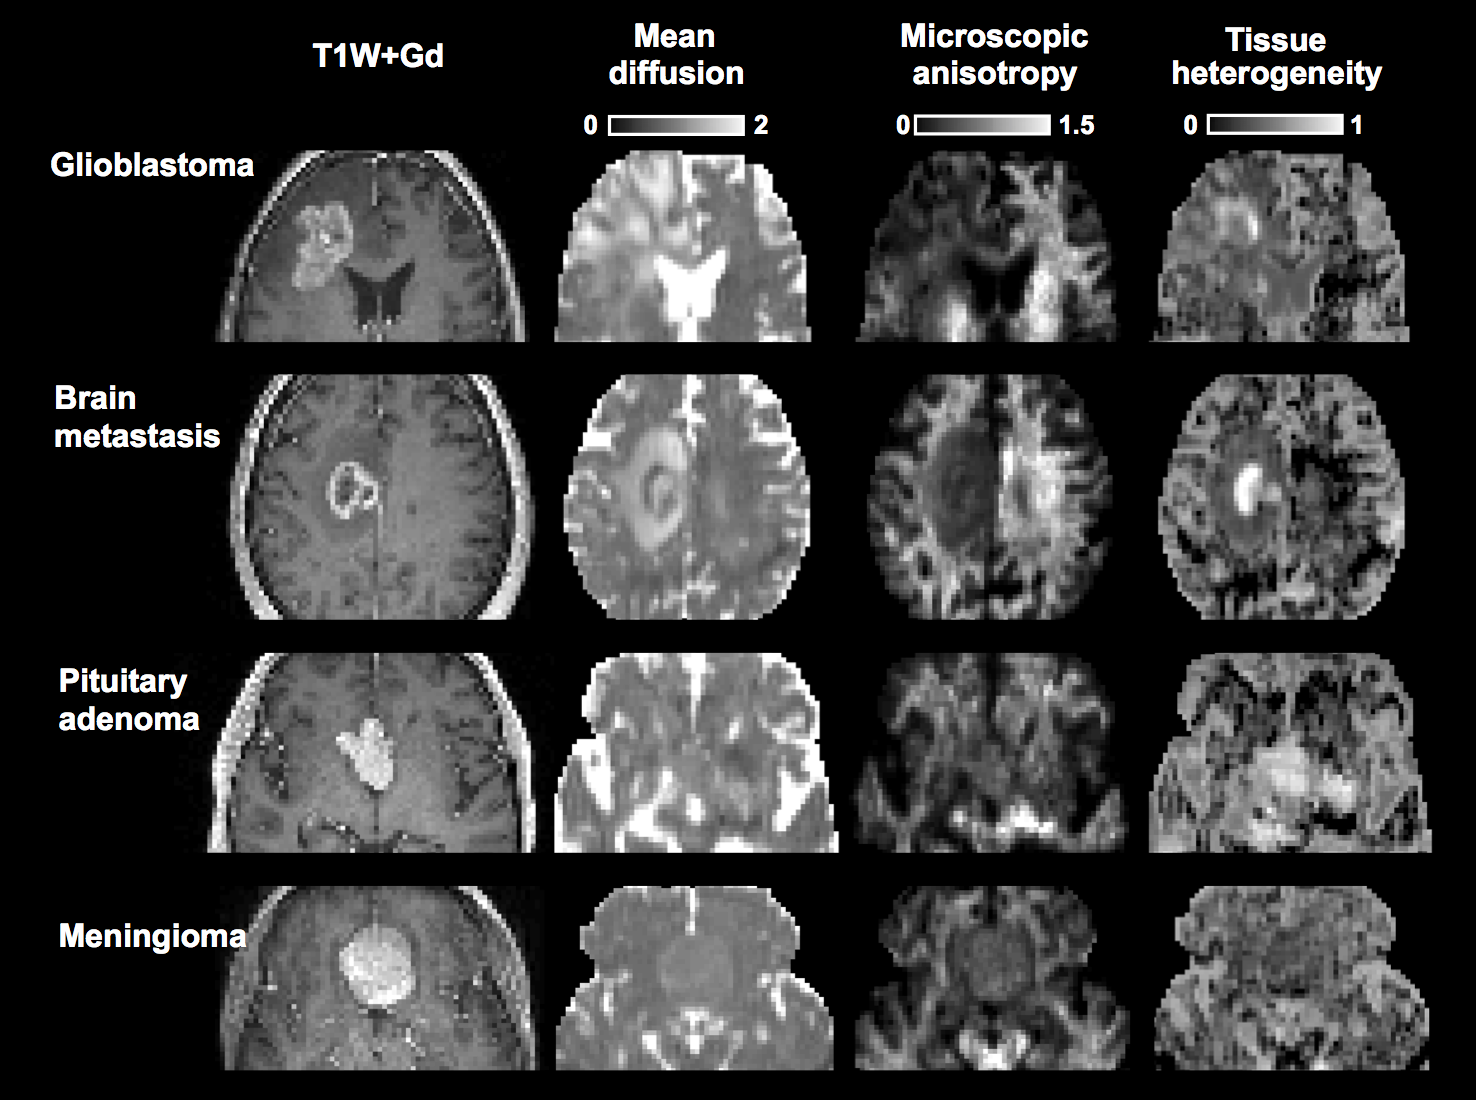
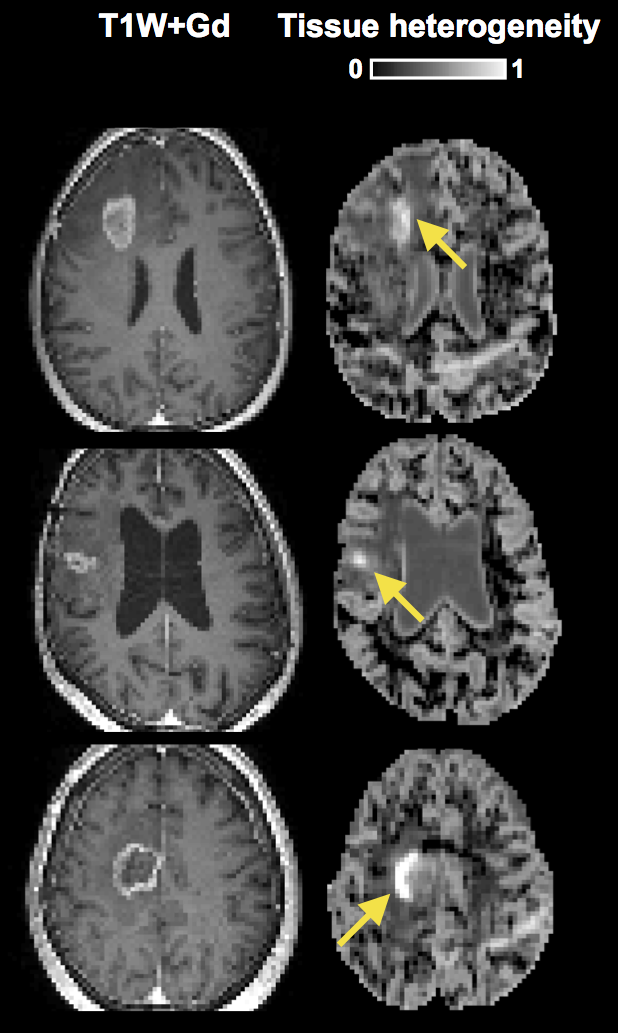
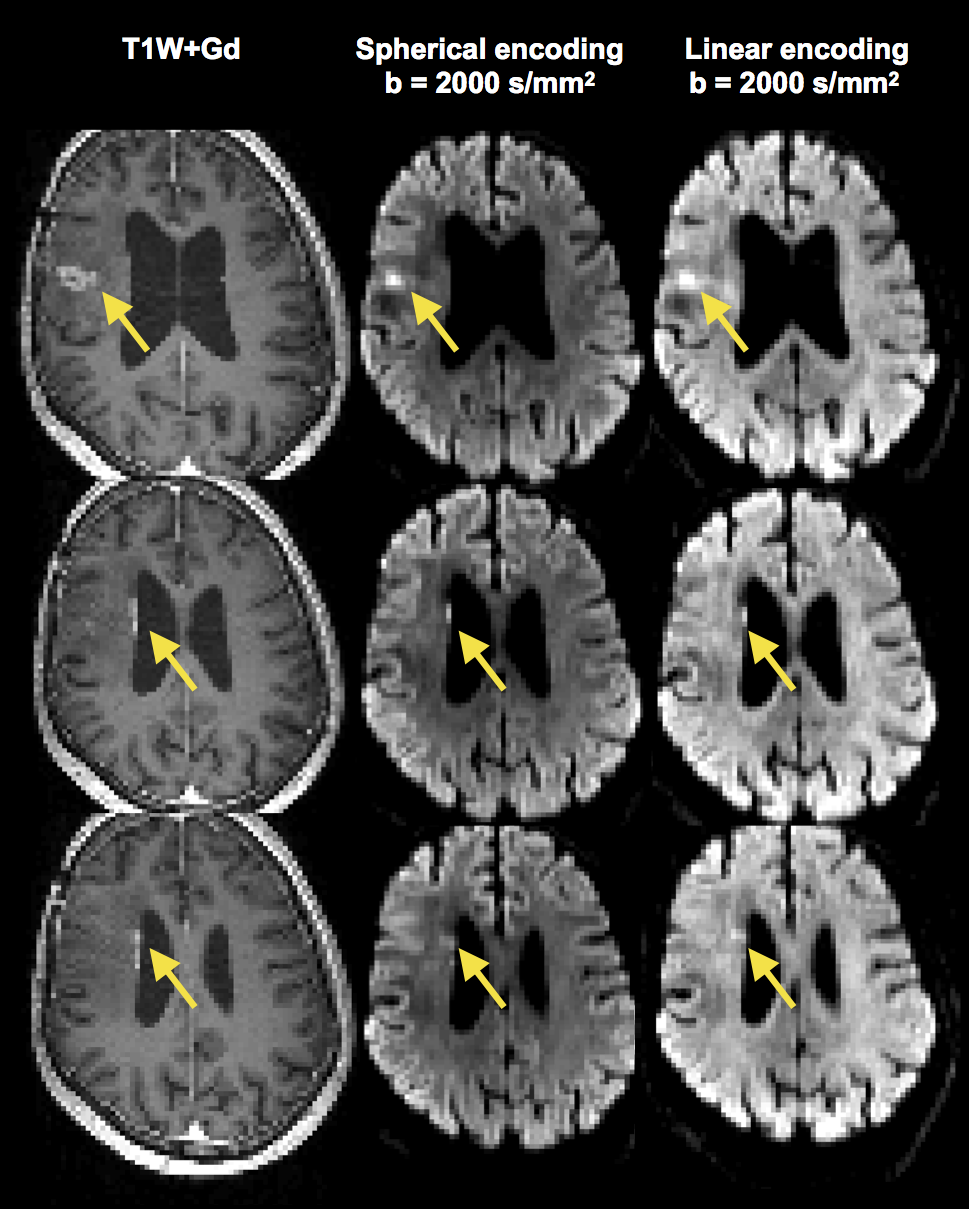
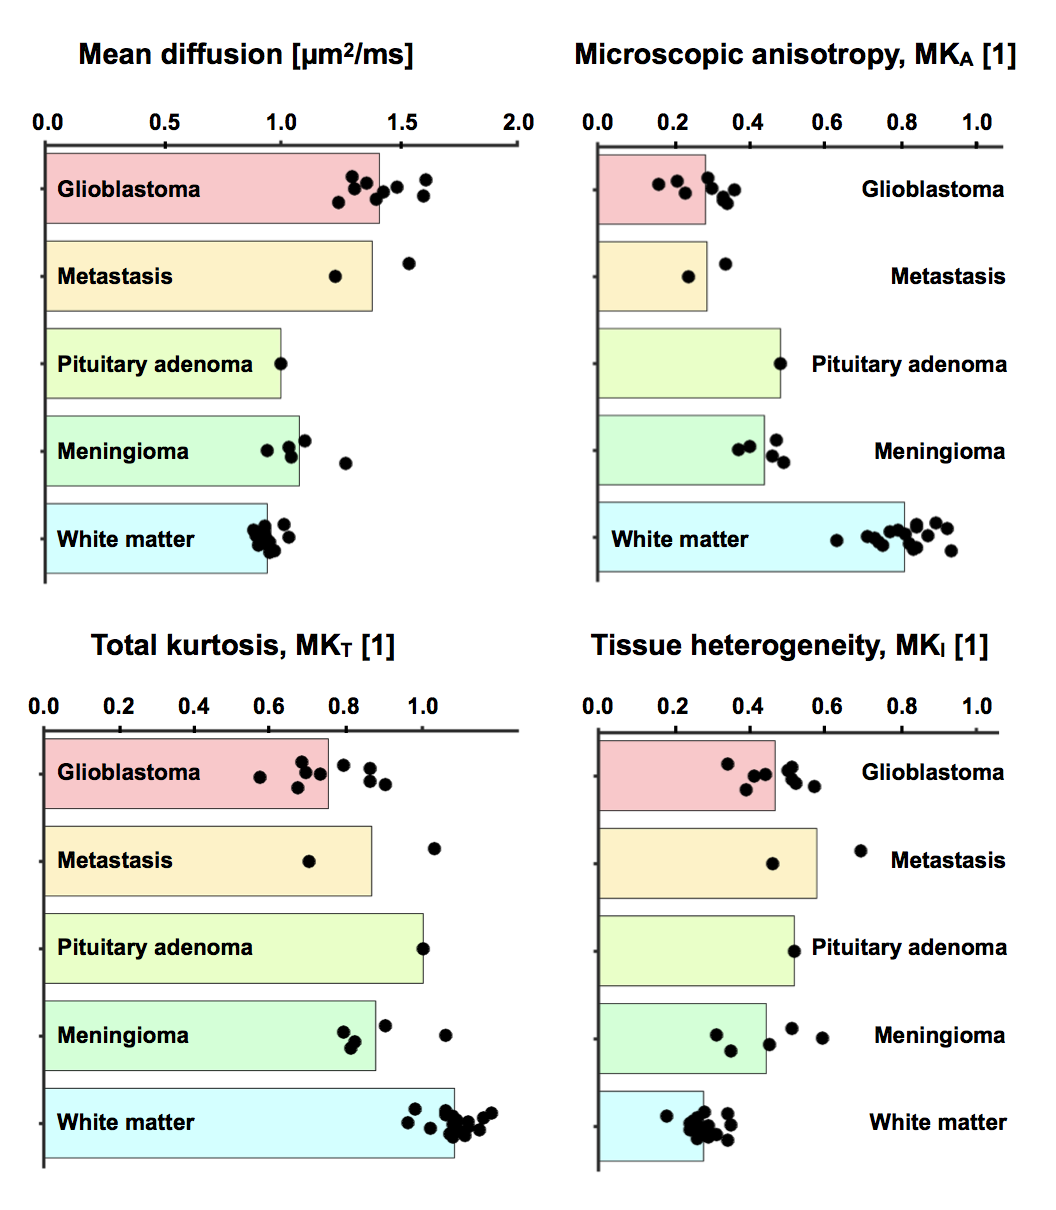
Figure 1 shows a post-Gd T1W image and maps of the microscopic anisotropy and tissue heterogeneity, respectively, in four different types of brain tumors. These high-quality maps were obtained in just 3 minutes of scan time. In three cases, parts of the tumor edges showed exceptionally high tissue heterogeneity (Figure 2). Since this parameter is computed from data acquired with isotropic diffusion weighting (spherical tensor encoding), such regions also had a conspicuous contrast in the raw signal data (Figure 3). The increase in image contrast with spherical compared to conventional linear tensor encoded data is particularly striking. Finally, average parameter values across the tumors were visualized (Figure 4). All tumors had lower microscopic anisotropy and higher tissue heterogeneity than the normal-appearing white matter.Discussion and conclusions
Tensor-valued diffusion encoding can be performed in 3 minutes to quantify microscopic anisotropy and tissue heterogeneity in brain tumors. Differences in microscopic anisotropy between the glioma and meningioma groups were in line with previous investigations,4 showing that meningiomas contain more microscopically anisotropic tissue. High microscopic anisotropy was also found in the pituitary adenoma, suggesting that the tumor comprised elongated cells, common for e.g. pituicytomas or thyroid stimulating hormone secreting adenomas.9 Moreover, one metastasis and two of the nine gliomas exhibited substantially elevated isotropic kurtosis indicating high tissue heterogeneity. This may indicate a zone of high tumor viability. Future investigations will serve to verify the association between these novel diffusion parameters and pathology.Acknowledgements
We thank Siemens Healthcare for access to the pulse sequence programming environment.References
1. Jensen, J. H., Helpern, J. A., Ramani, A., Lu, H., & Kaczynski, K. (2005). Diffusional kurtosis imaging: the quantification of non-gaussian water diffusion by means of magnetic resonance imaging. Magn Reson Med, 53(6), 1432–1440.
2. Raab, P., Hattingen, E., Franz, K., Zanella, F. E. & Lanfermann, H. 2010. Cerebral gliomas: diffusional kurtosis imaging analysis of microstructural differences. Radiology, 254, 876-81.
3. Van Cauter, S., De Keyzer, F., Sima, D. M., Sava, A. C., D'arco, F., Veraart, J., Peeters, R. R., Leemans, A., Van Gool, S., Wilms, G., Demaerel, P., Van Huffel, S., Sunaert, S. & Himmelreich, U. 2014. Integrating diffusion kurtosis imaging, dynamic susceptibility-weighted contrast-enhanced MRI, and short echo time chemical shift imaging for grading gliomas. Neuro Oncol, 16, 1010-21.
4. Szczepankiewicz, F., Van Westen, D., Englund, E., Westin, C. F., Stahlberg, F., Latt, J., Sundgren, P. C. & Nilsson, M. 2016. The link between diffusion MRI and tumor heterogeneity: Mapping cell eccentricity and density by diffusional variance decomposition (DIVIDE). Neuroimage, 142, 522-532.
5. Lasič, S., Szczepankiewicz, F., Eriksson, S., Nilsson, M. & Topgaard, D. 2014. Microanisotropy imaging: quantification of microscopic diffusion anisotropy and orientational order parameter by diffusion MRI with magic-angle spinning of the q-vector. Frontiers in Physics, 2, 11.
6. Westin, C. F., Knutsson, H., Pasternak, O., Szczepankiewicz, F., Özarslan, E., Van Westen, D., Mattisson, C., Bogren, M., O'donnell, L. J., Kubicki, M., Topgaard, D. & Nilsson, M. 2016. Q-space trajectory imaging for multidimensional diffusion MRI of the human brain. Neuroimage, 135, 345-62.
7. Sjölund, J., Szczepankiewicz, F., Nilsson, M., Topgaard, D., Westin, C. F. & Knutsson, H. 2015. Constrained optimization of gradient waveforms for generalized diffusion encoding. Journal of Magnetic Resonance, 261, 157-168.
8. Eriksson, S., Lasič, S., Nilsson, M., Westin, C.-F., & Topgaard, D. (2015). NMR diffusion-encoding with axial symmetry and variable anisotropy: Distinguishing between prolate and oblate microscopic diffusion tensors with unknown orientation distribution. The Journal of Chemical Physics, 142(10), 104201.
9. Larkin, Sarah, and Olaf Ansorge. Pathology and Pathogenesis of Pituitary Adenomas and Other Sellar Lesions. (2017).
Figures