1088
Metabolomic Evaluations of Human Prostate Tissue from mp-MRI/US Fusion Biopsy1Pathology, Massachusetts General Hospital, Charlestown, MA, United States, 2Radiology, University of Wurzburg, Wurzburg, Germany, 3Oncology, Charite Medical University, Berlin, Germany, 4Urology, Massachusetts General Hospital, Boston, MA, United States
Synopsis
Heterogeneity and clinical insignificance of prostate cancer (PCa) lesions challenges diagnosis and management. Introduction of the multi-parameter (mp)-MRI/ultrasound fusion-guided biopsy increased detection of clinically significant cancer. Prostate MRI lesions receive a PI-RADS score based on likelihood of being cancer-positive. Fusing MRI images with live ultrasound guides biopsy from the targeted area. Previously, PI-RADS score has been correlated with clinical significance of cancer and morphological variations in PCa lesions. We studied PI-RADS score according to tissue MRS-based metabolomics. Metabolic differences between Target and Non-target cores, regardless if Targets were cancer-positive, support the assumption that targeted areas fundamentally differ from non-targeted areas.
Introduction
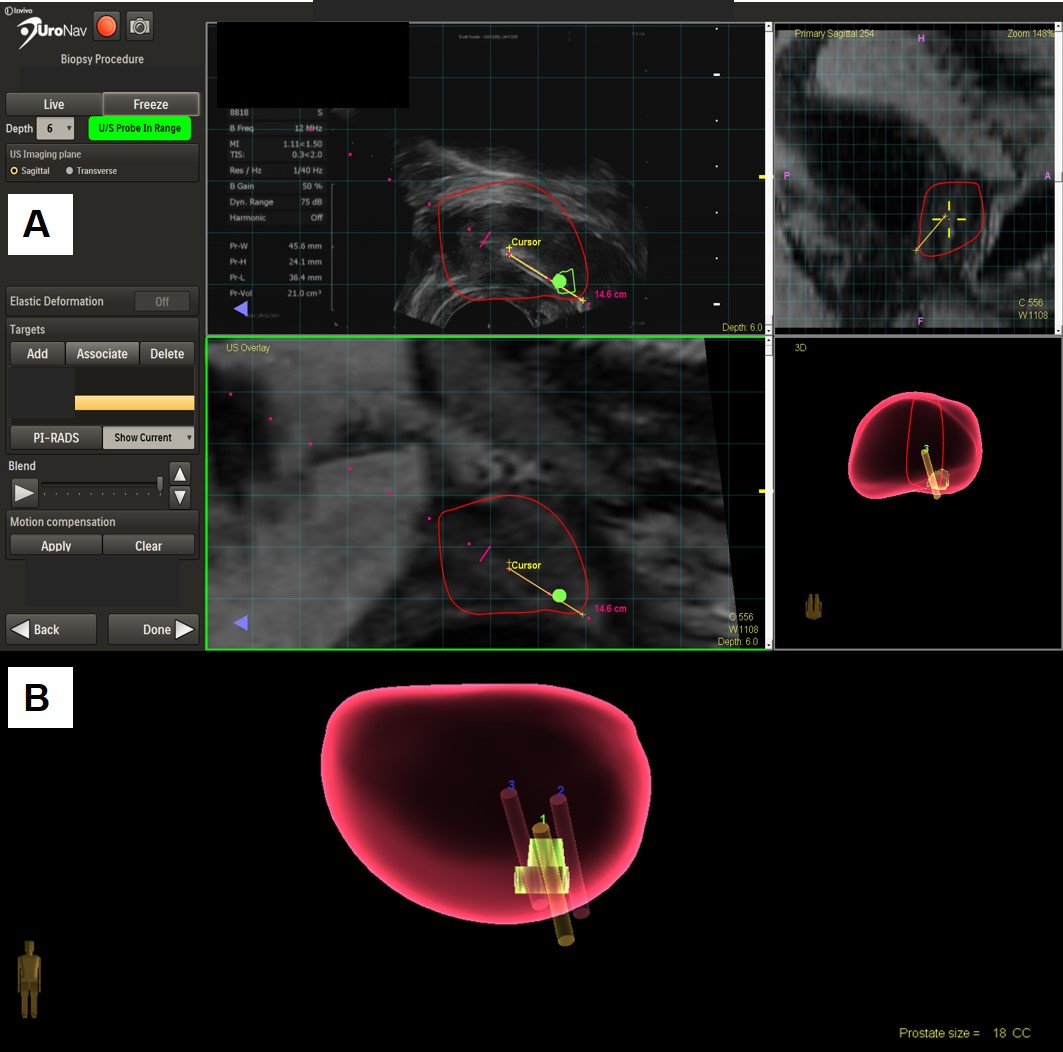
In 2014, over 172,000 men in the US were diagnosed with prostate cancer (PCa)1, and it is the second most common cause of cancer-related death2. Heterogeneity and clinical insignificance of many prostate cancer lesions challenges diagnosis and clinical management. Introduction of the multi-parameter (mp)-MRI/ultrasound fusion-guided biopsy increased the cancer detection rate from 18 to 41%3, and also improved detection of clinically significant PCa4,5. Prior to biopsy, patients undergo mp-MRI, and prostate regions are scored from 1-5 for lesion clinical significance according to the revised Prostate Imaging Reporting and Data System version 2 (PI-RADS v2)6. During the biopsy procedure, the MRI image is overlaid with the live ultrasound image to guide biopsy from the targeted area (Figure 1). Previously, PI-RADS score has been correlated with clinical significance of cancer and both morphological4,5,7 and microscopic variations in PCa lesions8. Here, we studied PI-RADS score according to tissue MRS-based metabolomics.Methods
Mp-MRI/TRUS fusion biopsy cores. Patients suspicious for PCa underwent mp-MRI/ultrasound fusion biopsy. Three or four biopsy cores were taken from the target, followed by the traditional 12-core template biopsies. One target core (“MRS Target”) (n=54) and one non-target core (n=54) opposite from the target underwent spectroscopic analysis. MR Spectroscopy. Both cores were analyzed by high-resolution magic angle spinning MRS on a Bruker 600MHz spectrometer, at 4ºC with a rotor-synchronized Min(A,B) protocol with spinning at 600 and 700Hz9. Spectra were processed with curve fitting and transformed into statistical matrices using a MatLab-based program. Metabolic spectral regions (n=33) with >85% of samples presenting detectable values were analyzed. In addition, principal component analysis (PCA) was carried out with inclusion of all 33 identified regions. Histopathology. Following MRS, volume percentage (vol%) of histological features (epithelia, cancer, stroma) of biopsy cores were read by a pathologist. Tissue pathology calibration. Due to the pathology heterogeneity of each measured core, a least squares regression-overdetermined linear model was used to calibrate the intensities of spectral regions according to pathology variability.Results
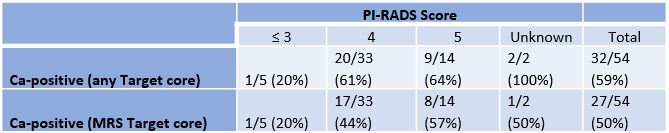
Of 54 targets identified in 54 patients, we report that 59% of fusion Targets resulted in a core that was positive for cancer pathology (Ca-positive). A higher PI-RADS score resulted in greater likelihood of detecting a Ca-positive Target core (Table 1).
Paired Target and Non-target analyses
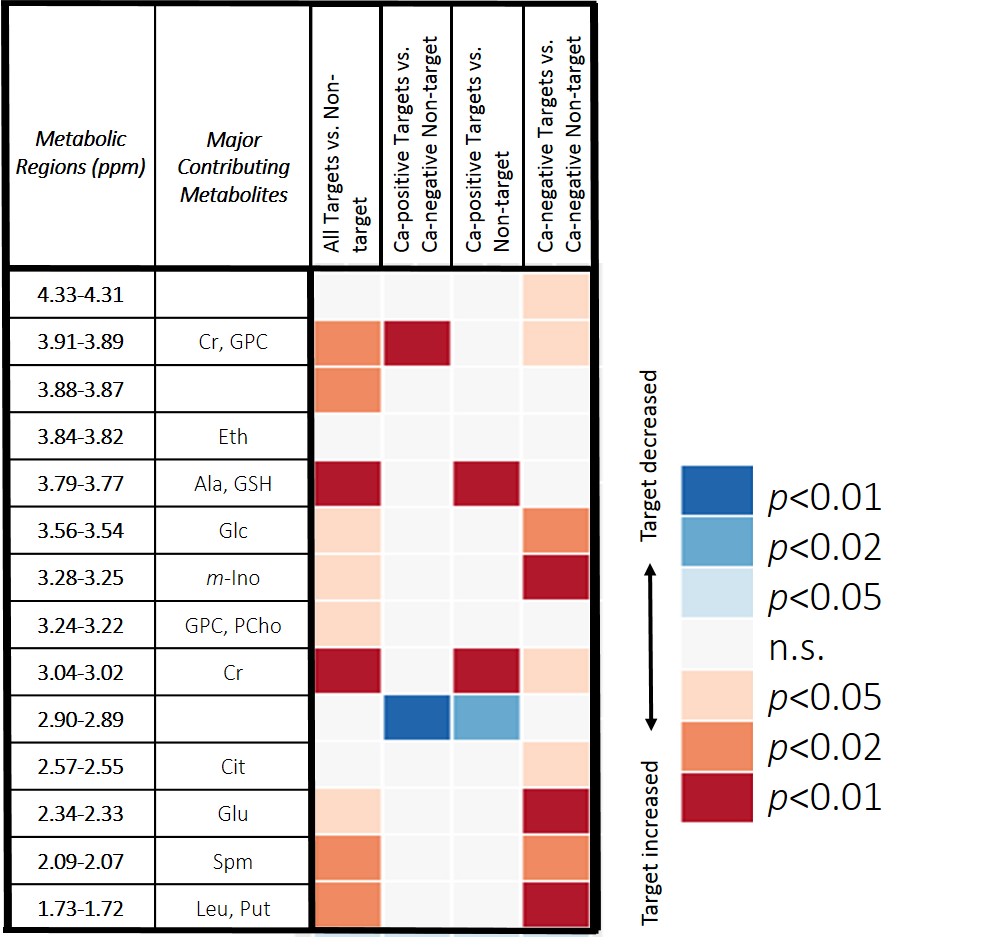
Paired Target and Non-target samples from the same patients were compared with Wilcoxon signed rank tests. Among the 33 metabolic regions evaluated, ten regions could differentiate between all paired samples with statistical significance. Paired analyses between sub-groups were also conducted (Table 2).
Correlating PI-RADS scores with metabolic information
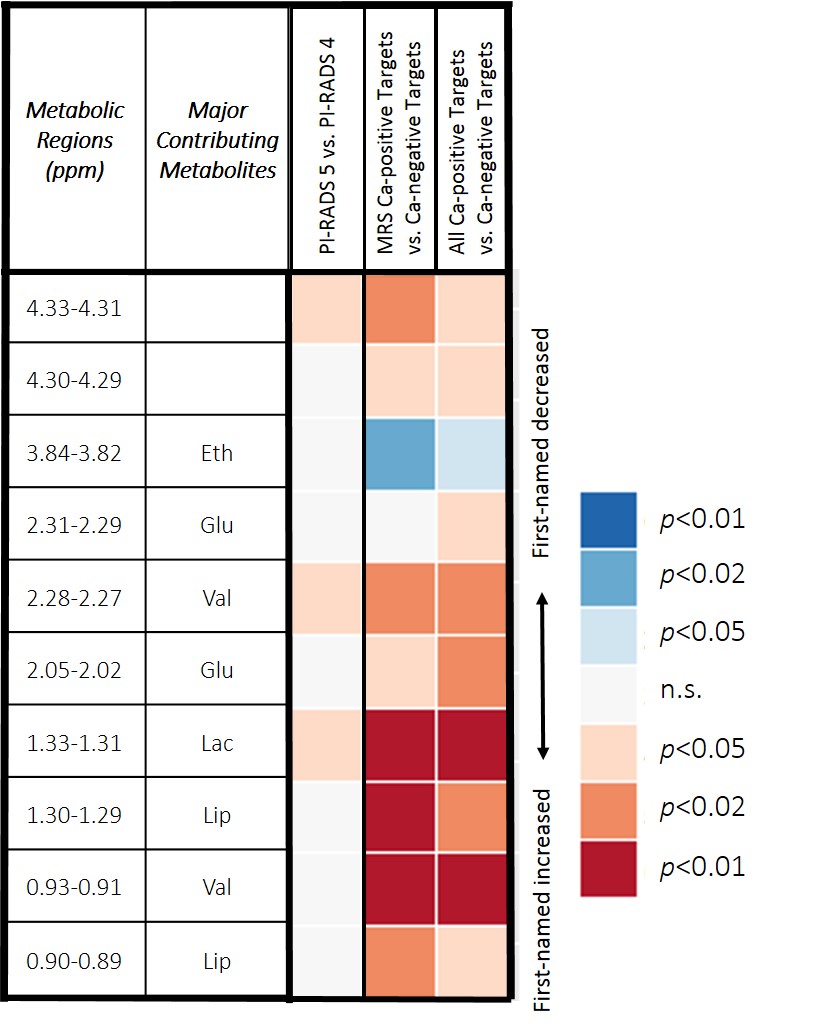
Three regions and 1 principal component (PC) could distinguish PI-RADS 4 and 5 scores (PI-RADS 2 and 3 excluded due to 1 and 3 samples, respectively). Comparing MRS Ca-positive Targets versus Ca-negative Targets and all Ca-positive Targets versus Ca-negative Targets resulted in additional regions that could separate the groups (Table 3). Furthermore, PCs suggested separation was possible between Ca-positive Targets and Ca-negative Targets.
Discussion
Metabolic differentiation between Target and Non-target pairs was possible with multiple spectral regions. For Ca-positive Target and Ca-negative Non-target pairs, fewer regions could distinguish them, likely due to the fact that most of the Ca-positive Target cores were low grade (13/19), and differences of metabolic values between low grade cancer and benign may be less significant. The observed metabolic separations between Ca-negative Target and Ca-negative Non-target pairs suggest either the metabolic field effects of cancer10-12 do exist in the Target area or indicate the existence of metabolic differences between the target and non-targeted areas.
Among cores collected from Target areas, Ca-positive cores have different metabolic characteristics from Ca-negative cores, regardless if the MRS-measured core was Ca-positive or not.
Relative increases in regions containing lactate and valine distinguish Target cores with PI-RADS 5 from PI-RADS 4. Lactate is linked to cancer aggressiveness and growth13,14 as a result of the Warburg effect. The role of valine in tumor metabolism can vary depending on the cancer type, but non-small cell lung cancer tumors, for example, show increased uptake to fuel growth15,16, which is consistent with results reported here. Elevated levels of these metabolites indicate that areas of greater MRI-suspicion correlate with metabolic changes which are characteristic of actively growing cancer.
Conclusions
MRS investigation of paired fusion Target and Non-target prostate biopsy cores indicates that disregarding whether a Target core is Ca-positive, its metabolic pattern differs from a randomly-sampled, non-targeted area. Regardless of pathology, Ca-positive Targets are distinguishable from Ca-negative Targets and PI-RADS 4 and 5 can be separated. With metabolic evidence, these results support the fusion biopsy assumption that targeted areas are fundamentally different from non-targeted areas.Acknowledgements
We acknowledge and thank NIH grant CA115746 and the A. A. Martinos Center for Biomedical Imaging.References
1 Prostate Cancer Statistics, CDC, 2017.
2 Jemal, A. et al. Cancer statistics, 2009. CA: a cancer journal for clinicians 59, 225-249, doi:10.3322/caac.20006 (2009).
3 Hoeks, C. M. et al. Prostate cancer: multiparametric MR imaging for detection, localization, and staging. Radiology 261, 46-66, doi:10.1148/radiol.11091822 (2011).
4 Pinto, P. A. et al. Magnetic resonance imaging/ultrasound fusion guided prostate biopsy improves cancer detection following transrectal ultrasound biopsy and correlates with multiparametric magnetic resonance imaging. J Urol 186, 1281-1285, doi:10.1016/j.juro.2011.05.078 (2011).
5 De Visschere, P. J. et al. Role of multiparametric magnetic resonance imaging in early detection of prostate cancer. Insights into imaging 7, 205-214, doi:10.1007/s13244-016-0466-9 (2016).
6 Purysko, A. S., Rosenkrantz, A. B., Barentsz, J. O., Weinreb, J. C. & Macura, K. J. PI-RADS Version 2: A Pictorial Update. Radiographics : a review publication of the Radiological Society of North America, Inc 36, 1354-1372, doi:10.1148/rg.2016150234 (2016).
7 Dianat, S. S. et al. Association of quantitative magnetic resonance imaging parameters with histological findings from MRI/ultrasound fusion prostate biopsy. The Canadian journal of urology 22, 7965-7972 (2015).
8 Faiella, E. et al. Analysis of histological findings obtained combining US/mp-MRI fusion-guided biopsies with systematic US biopsies: mp-MRI role in prostate cancer detection and false negative. La Radiologia medica, doi:10.1007/s11547-017-0814-y (2017).
9 Burns, M. A. et al. Reduction of spinning sidebands in proton NMR of human prostate tissue with slow high-resolution magic angle spinning. Magnetic resonance in medicine 54, 34-42 (2005).
10 Jimenez, B. et al. 1H HR-MAS NMR spectroscopy of tumor-induced local metabolic "field-effects" enables colorectal cancer staging and prognostication. Journal of proteome research 12, 959-968, doi:10.1021/pr3010106 (2013).
11 Backshall, A. et al. Detection of metabolic alterations in non-tumor gastrointestinal tissue of the Apc(Min/+) mouse by (1)H MAS NMR spectroscopy. Journal of proteome research 8, 1423-1430, doi:10.1021/pr800793w (2009).
12 Yakoub, D., Keun, H. C., Goldin, R. & Hanna, G. B. Metabolic profiling detects field effects in nondysplastic tissue from esophageal cancer patients. Cancer research 70, 9129-9136, doi:0008-5472.CAN-10-1566 [pii] 10.1158/0008-5472.CAN-10-1566 (2010).
13 Hirschhaeuser, F., Sattler, U. G. & Mueller-Klieser, W. Lactate: a metabolic key player in cancer. Cancer research 71, 6921-6925, doi:10.1158/0008-5472.can-11-1457 (2011).
14 Feron, O. Pyruvate into lactate and back: from the Warburg effect to symbiotic energy fuel exchange in cancer cells. Radiotherapy and oncology : journal of the European Society for Therapeutic Radiology and Oncology 92, 329-333, doi:10.1016/j.radonc.2009.06.025 (2009).
15 Mayers, J. R. et al. Elevation of circulating branched-chain amino acids is an early event in human pancreatic adenocarcinoma development. Nat Med 20, 1193-1198, doi:10.1038/nm.3686 (2014).
16 Mayers, J. R. et al. Tissue of origin dictates branched-chain amino acid metabolism in mutant Kras-driven cancers. Science 353, 1161-1165, doi:10.1126/science.aaf5171 (2016).
Figures