1086
Dynamic 3D Isotropic Resolution Imaging of Human Lungs Using Oxygen-enhanced Radial UTE MRI1Medical Physics, University of Wisconsin-Madison, Madison, WI, United States, 2Radiology, University of Wisconsin-Madison, Madison, WI, United States, 3Biomedical Engineering, University of Wisconsin-Madison, Madison, WI, United States
Synopsis
Oxygen-enhanced 3D radial UTE MRI (UTE OE-MRI) has the potential for dynamic imaging of oxygen wash-in and wash-out in the lungs with isotropic resolution and full chest coverage. Four normal subjects underwent DESPOT1 and ~13-min dynamic OE-MRI using 3D radial UTE MRI. Temporal variations in median percent signal enhancement (MPSE) strongly correlated (p<0.0001) in the lungs and aorta. Wash-in (0.61±0.13 min) and wash-out (0.30±0.18 min) time constants for partial pressure of oxygen (ΔPO2) time curves are comparable to values in the literature. This study shows feasibility for dynamic imaging with whole lung coverage and isotropic spatial resolution for clinical research.
Introduction
A recent study1 evaluated repeatability of obstructive patterns in obstructed vs. healthy lungs via static ventilation imaging using 3D radial ultrashort TE oxygen-enhanced MRI (UTE OE-MRI). Here, we extended this technique from steady-state to dynamic imaging and evaluated the feasibility of 3D dynamic UTE OE-MRI in the assessment of regional O2 delivery, uptake and wash-out in healthy lungs.METHODS
Four healthy subjects were enrolled in a HIPAA-compliant study with IRB approval. Each subject underwent DESPOT12 and dynamic OE-MRI sequentially using 3D radial UTE sequence on a 1.5T scanner (HDxt, GE Healthcare, Waukesha, WI). Subjects were positioned supine and breathed freely via facemask with 21% (normoxic) or 100% O2 (hyperoxic) flowing at 15 L/min throughout the scan. For DESPOT1, five flip angles (2°, 4°, 6°, 10°, and 14°) were chosen based on the expected T1 estimates from the literature. While breathing medical air, all subjects were scanned using respiratory-gated free-breathing 3D radial UTE (TE=80μs) sequence with variable readout gradients3 at each flip angle with 32cm FOV, 30,000 projections, 1.25mm isotropic resolution, total scan time ~14min. With the same FOV and an 8° flip, we then performed dynamic OE-MRI using the same UTE sequence. The dynamic scan consisted of 14 or 34 dynamic time series to cover two wash-in and wash-out cycles: subjects breathed 21% O2 for the first 2 timeframes, and then the gas supply alternated between 100% and 21% O2 with 3 (70/52s temporal) or 8 (24s temporal) timeframes at each oxygen concentration, total scan time 13-16 min. The image resolution was down-sampled to a uniform lower 1cm3 resolution for T1 and PSE assessment. Image Analysis: Lungs were segmented using a 3D region-growing method with automatically selected seed points. We used linear least squares fitting to calculate voxelwise T1 values from magnitude UTE volumes after 3D rigid registration. The proposed post-processing workflow1 was integrated for the analysis of dynamic time series. First, all the later frames were registered to the first normoxic volume (timeframe#1). Second, the Jacobian determinant derived from registration was applied voxelwise to account for density changes due to physiological volume differences between normoxic vs. hyperoxic breathing. Third, whole lung and aortic median percent signal enhancement (MPSE) was calculated using registered, density corrected volumes with respect to timeframe#1. Fourth, voxelwise T1 estimates from DESPOT1 were used as the baseline T1 at timeframe#1 to estimate $$$T_{1}(t)$$$ at subsequent timepoints to derive changes in partial pressure of oxygen, $$$\triangle PO_{2}(t)=\frac{\frac{1}{T_{1}(t)}-\frac{1}{T_{1,baseline}}}{r_{O2}}$$$, where rO2=2.49×10⁻⁴/s mmHg4. The O2 wash-in and wash-out portions of $$$\triangle PO_{2}(t)$$$ curves were fitted using exponential functions5, $$$\triangle PO_{2}(t)=\triangle PO_{2max}\times(1-e^{-\frac{t}{\tau_{up}}})$$$ and $$$\triangle PO_{2}(t)=\triangle PO_{2max}\times e^{-\frac{t}{\tau_{down}}}$$$, to compute the time constants ($$$\tau_{up}$$$ and $$$\tau_{down}$$$) individually, where $$$\triangle PO_{2max}$$$ is the maximum ΔPO2 after switching air to 100% O2. The association of MPSE time curves in the lungs vs. aorta was evaluated using Spearman correlation.RESULTS
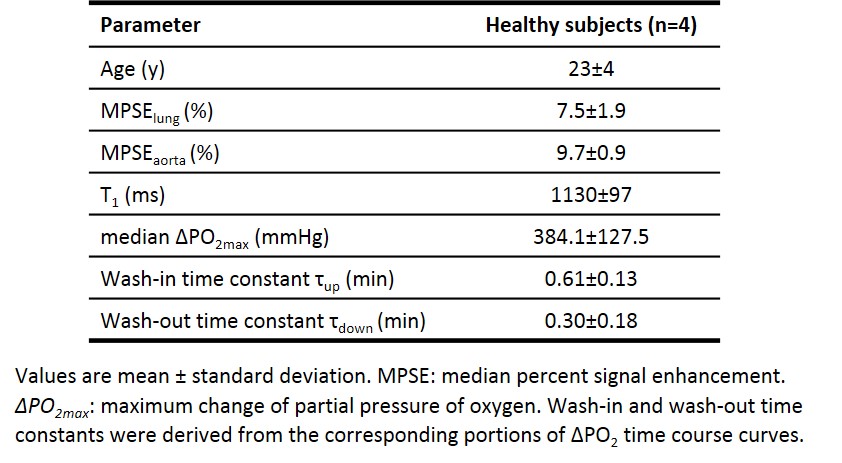
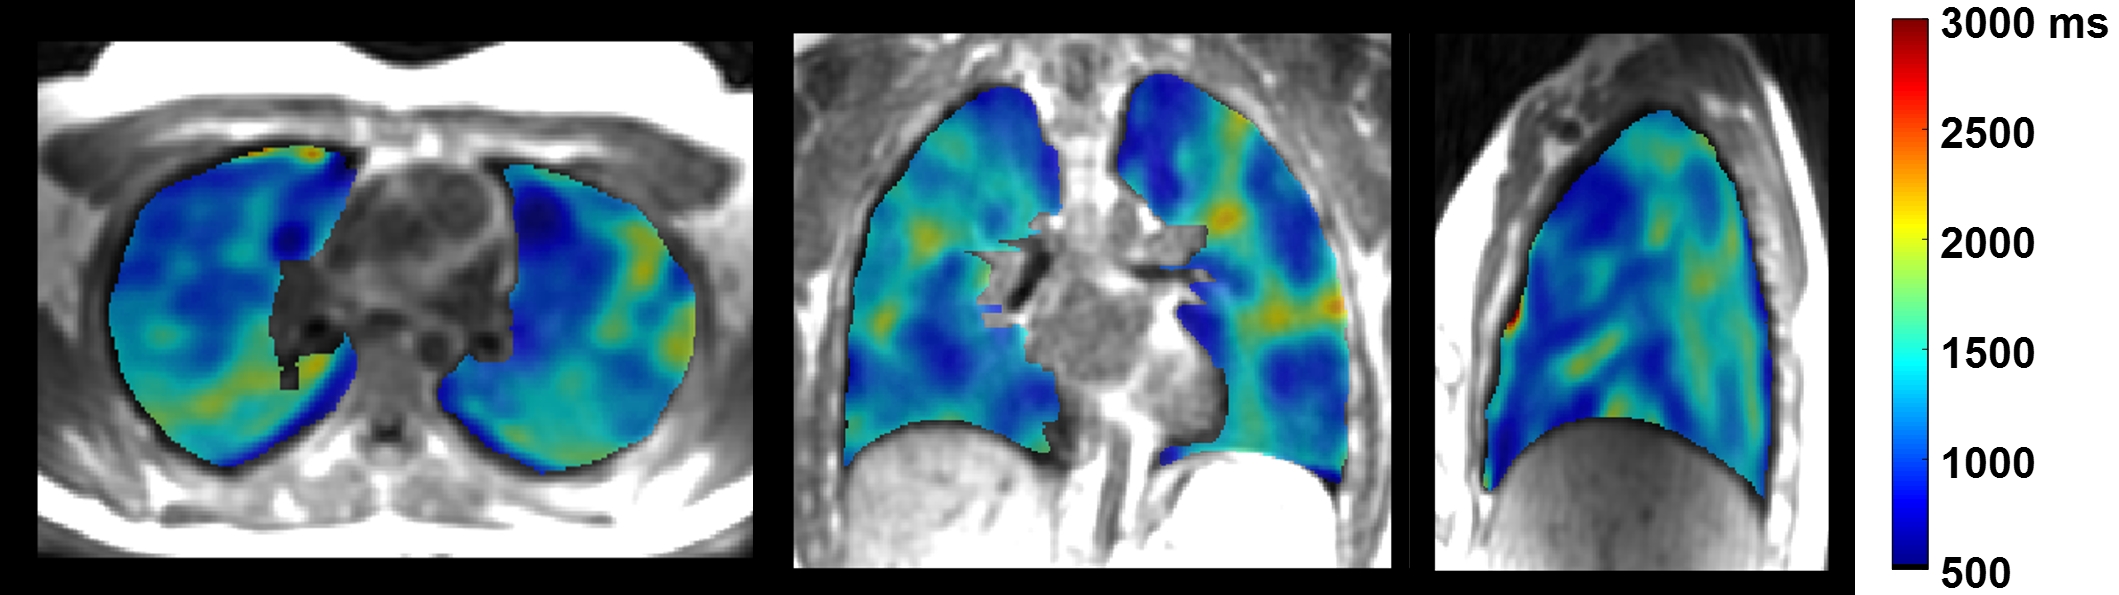
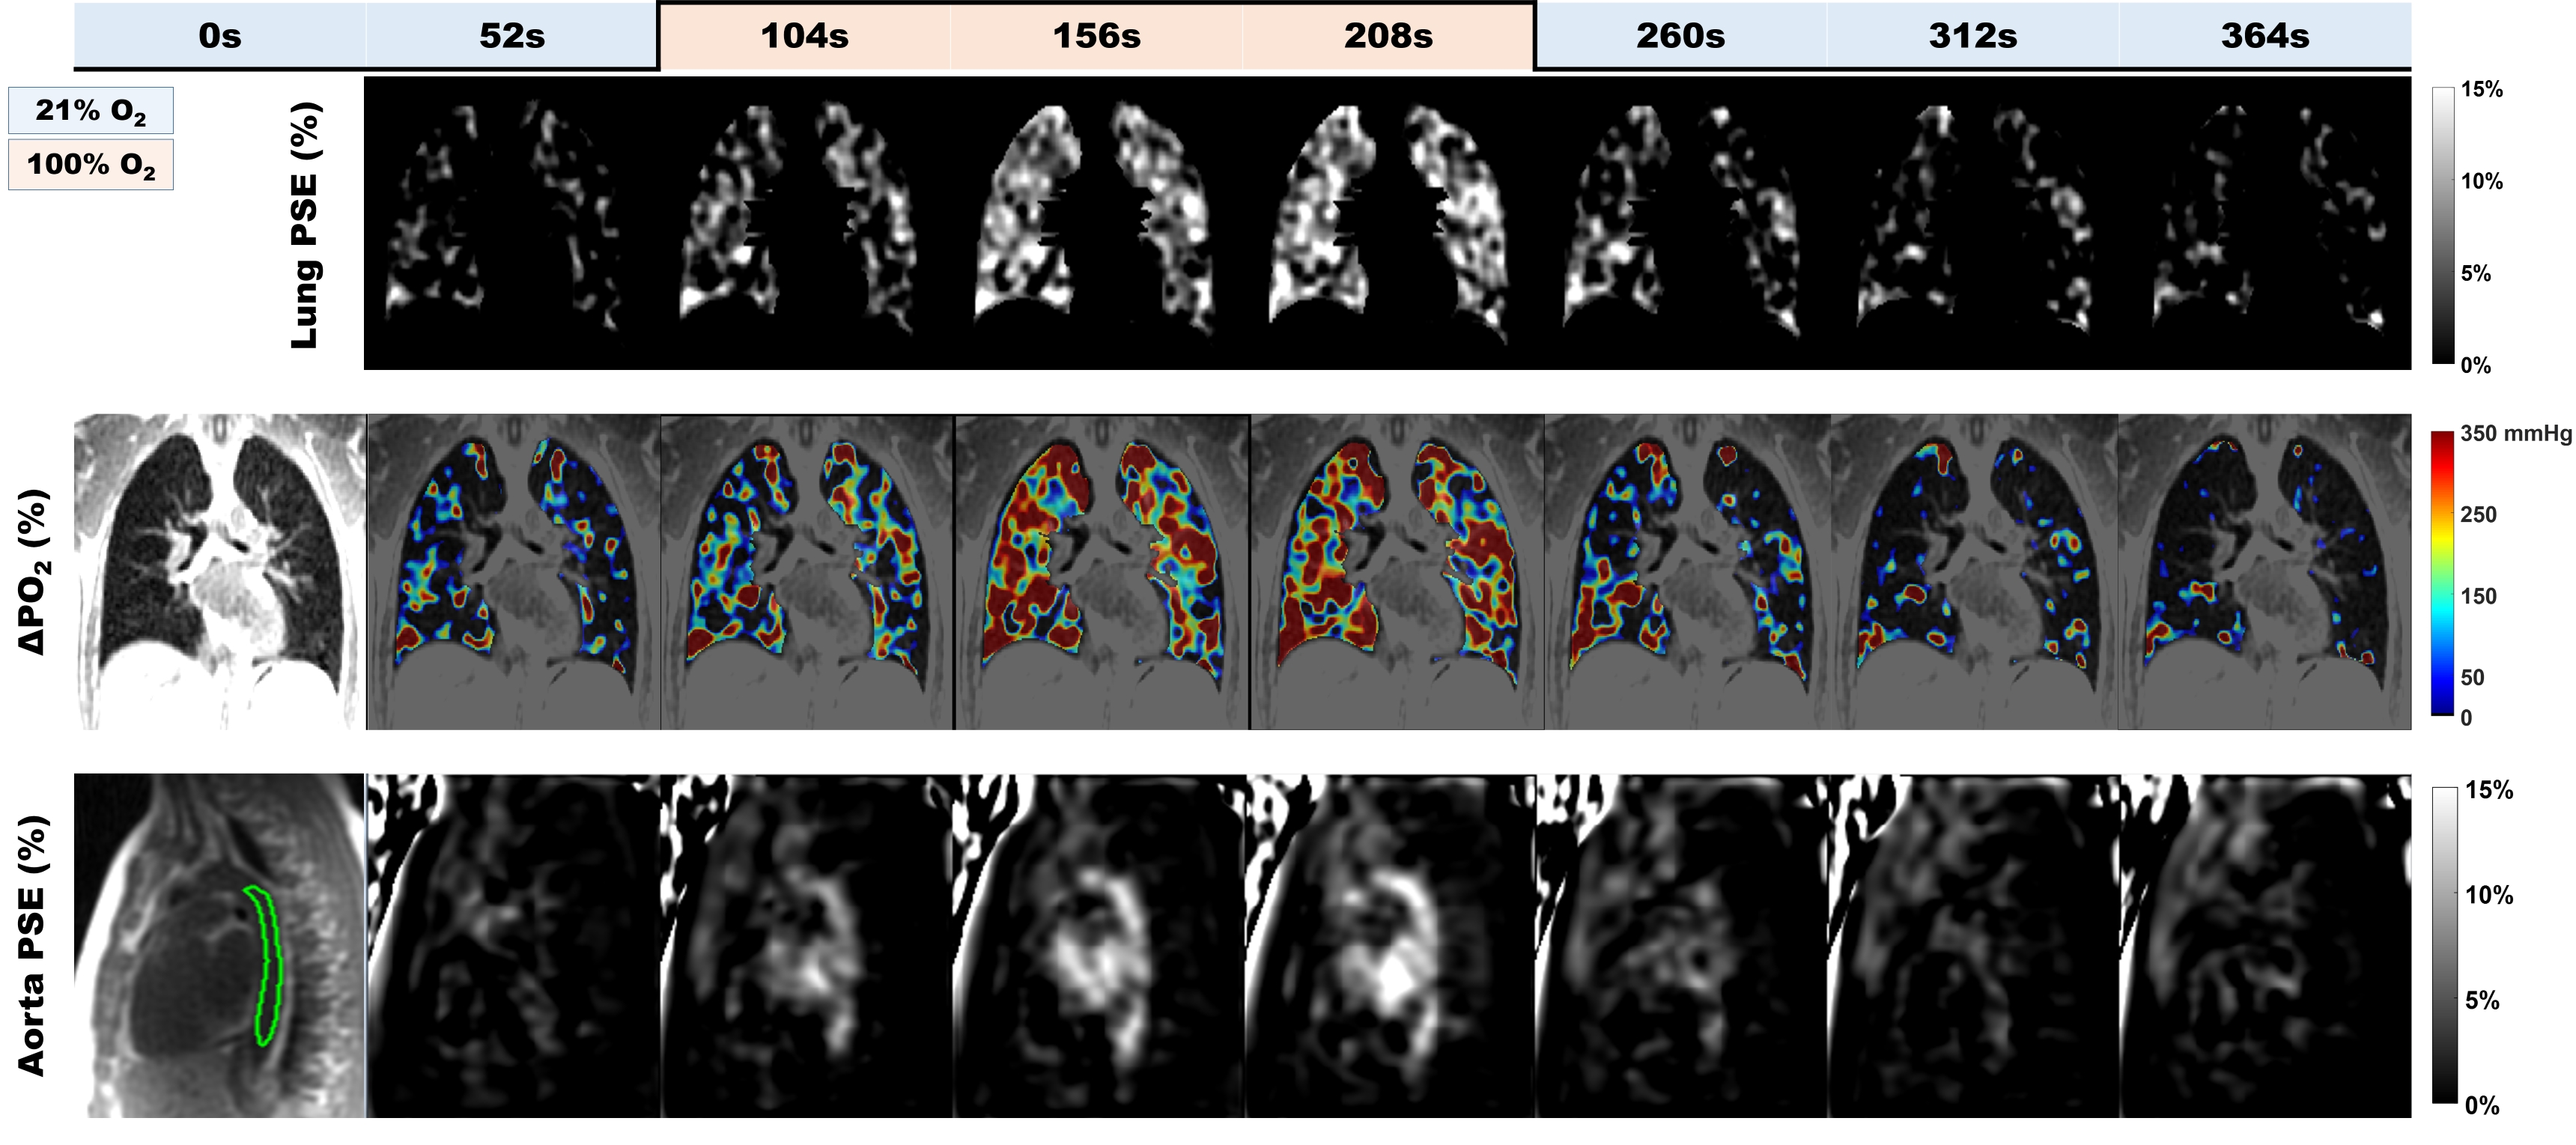
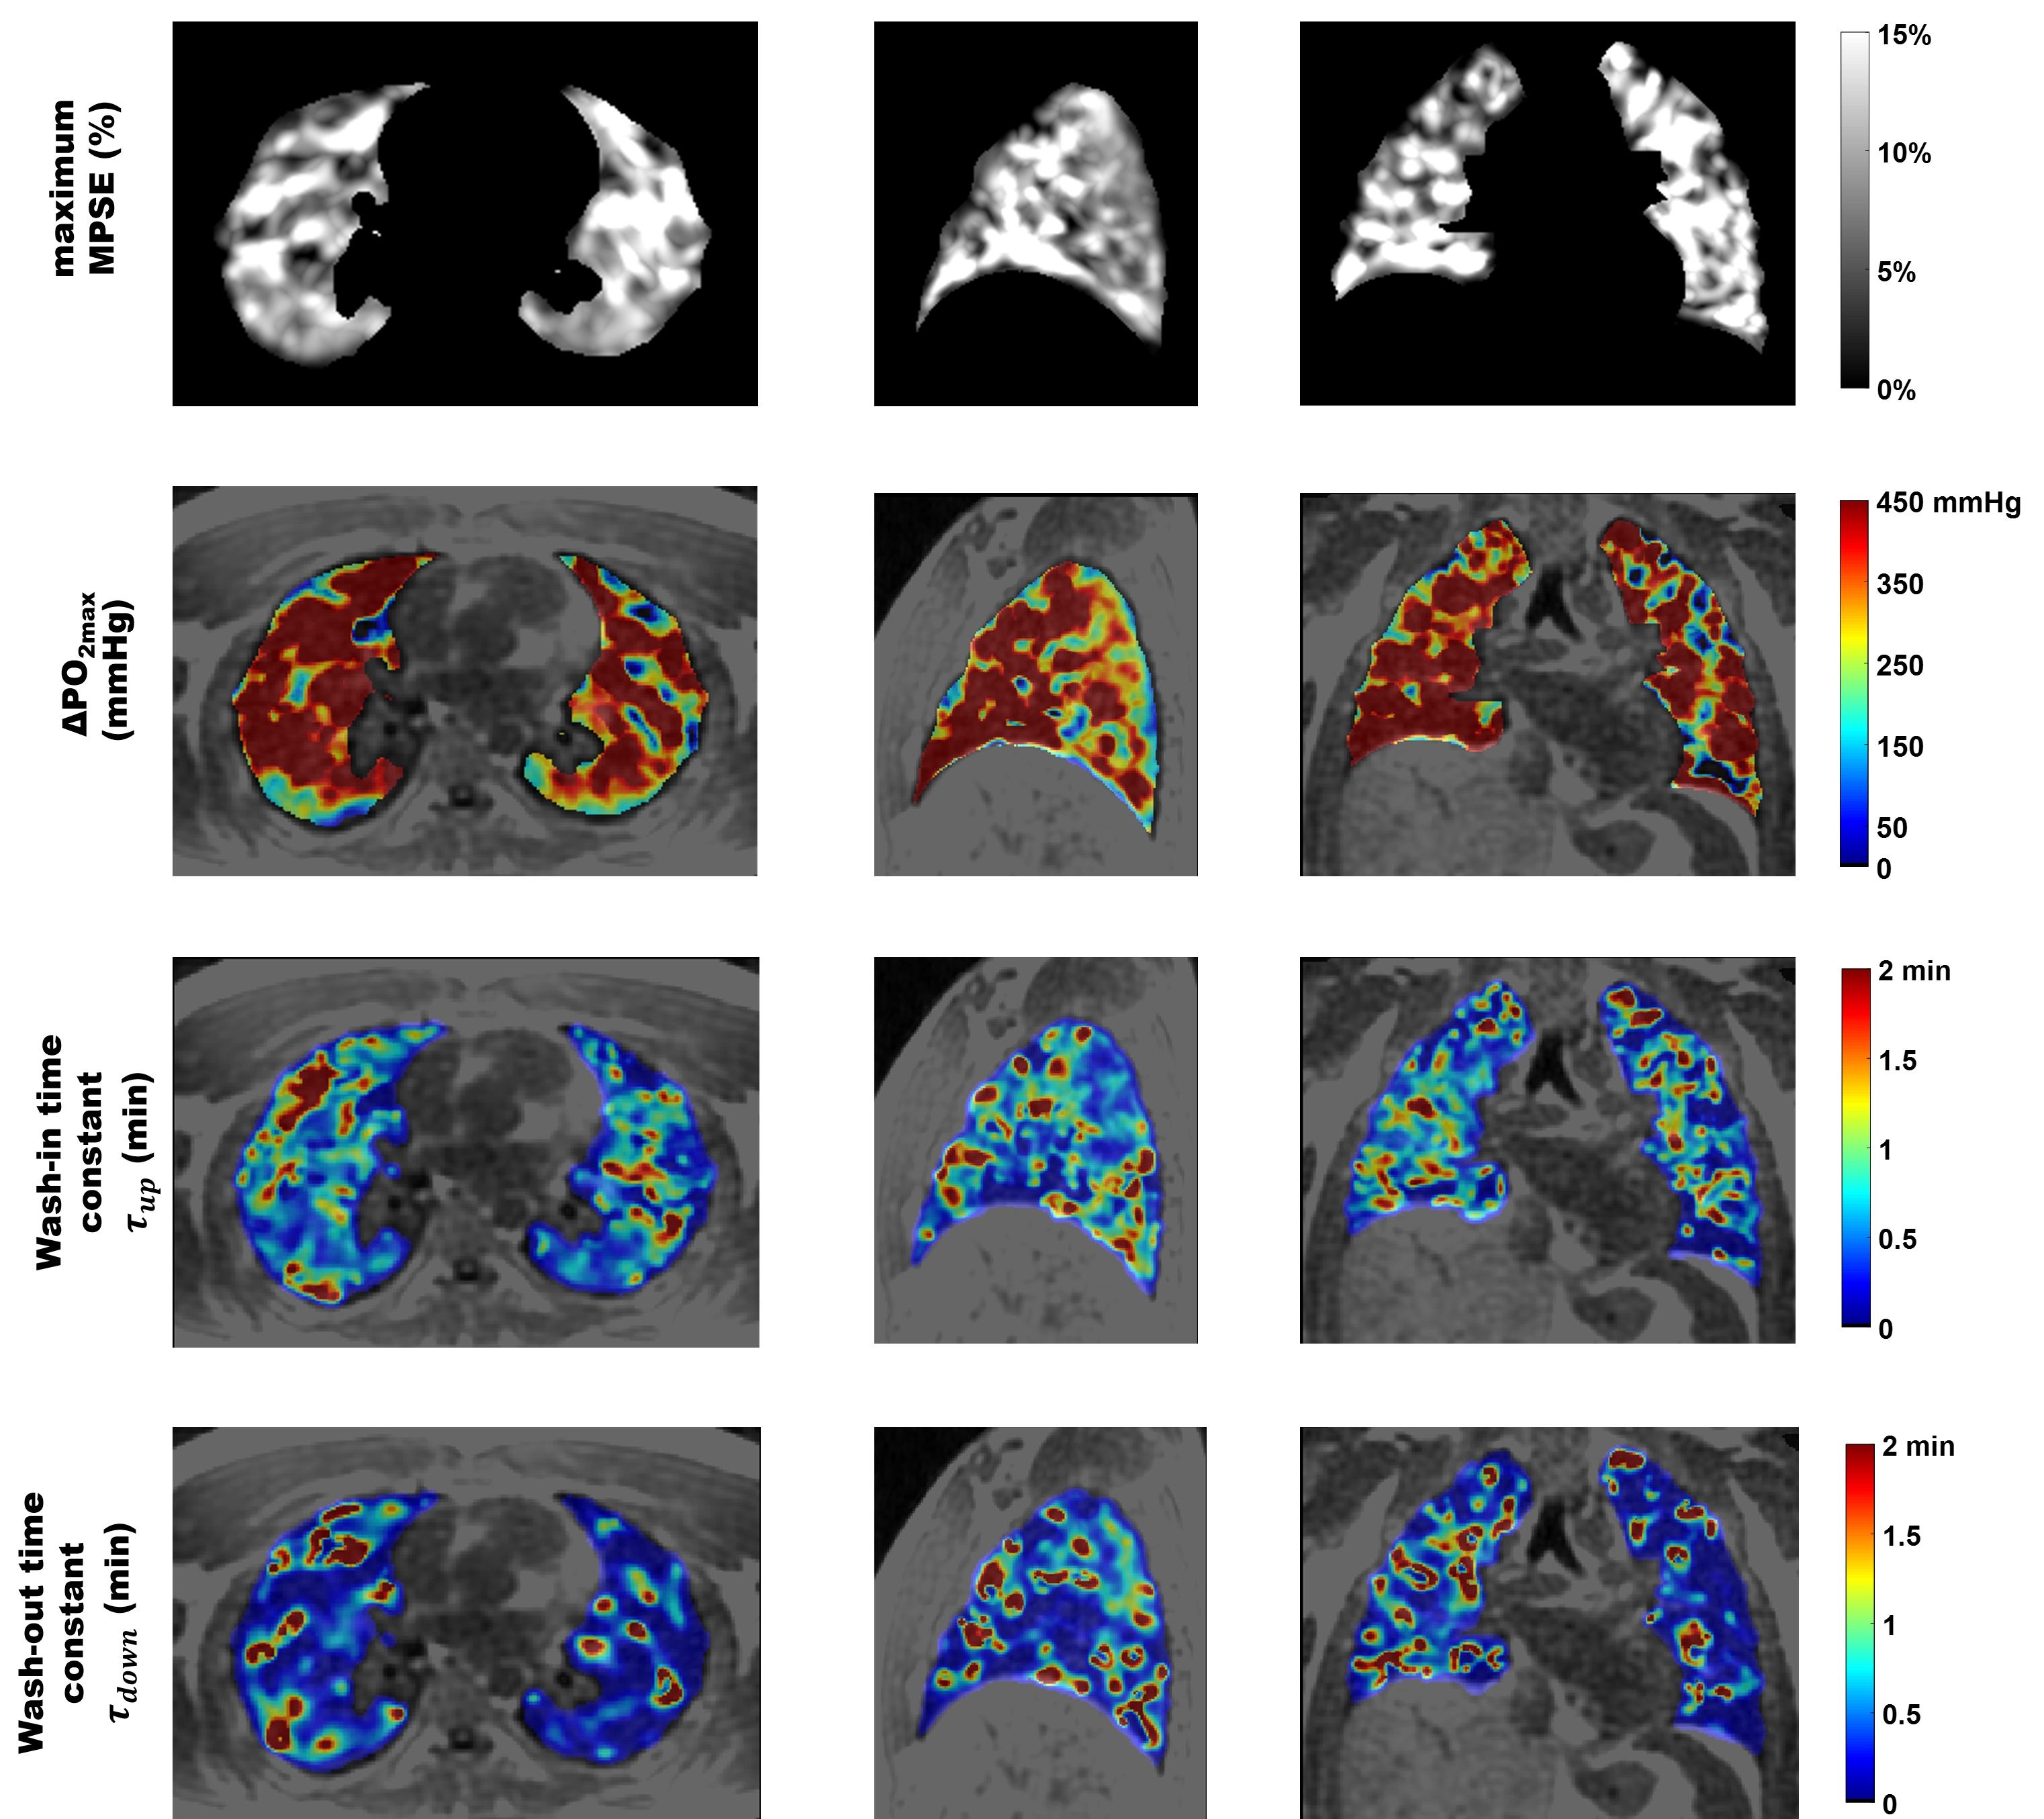
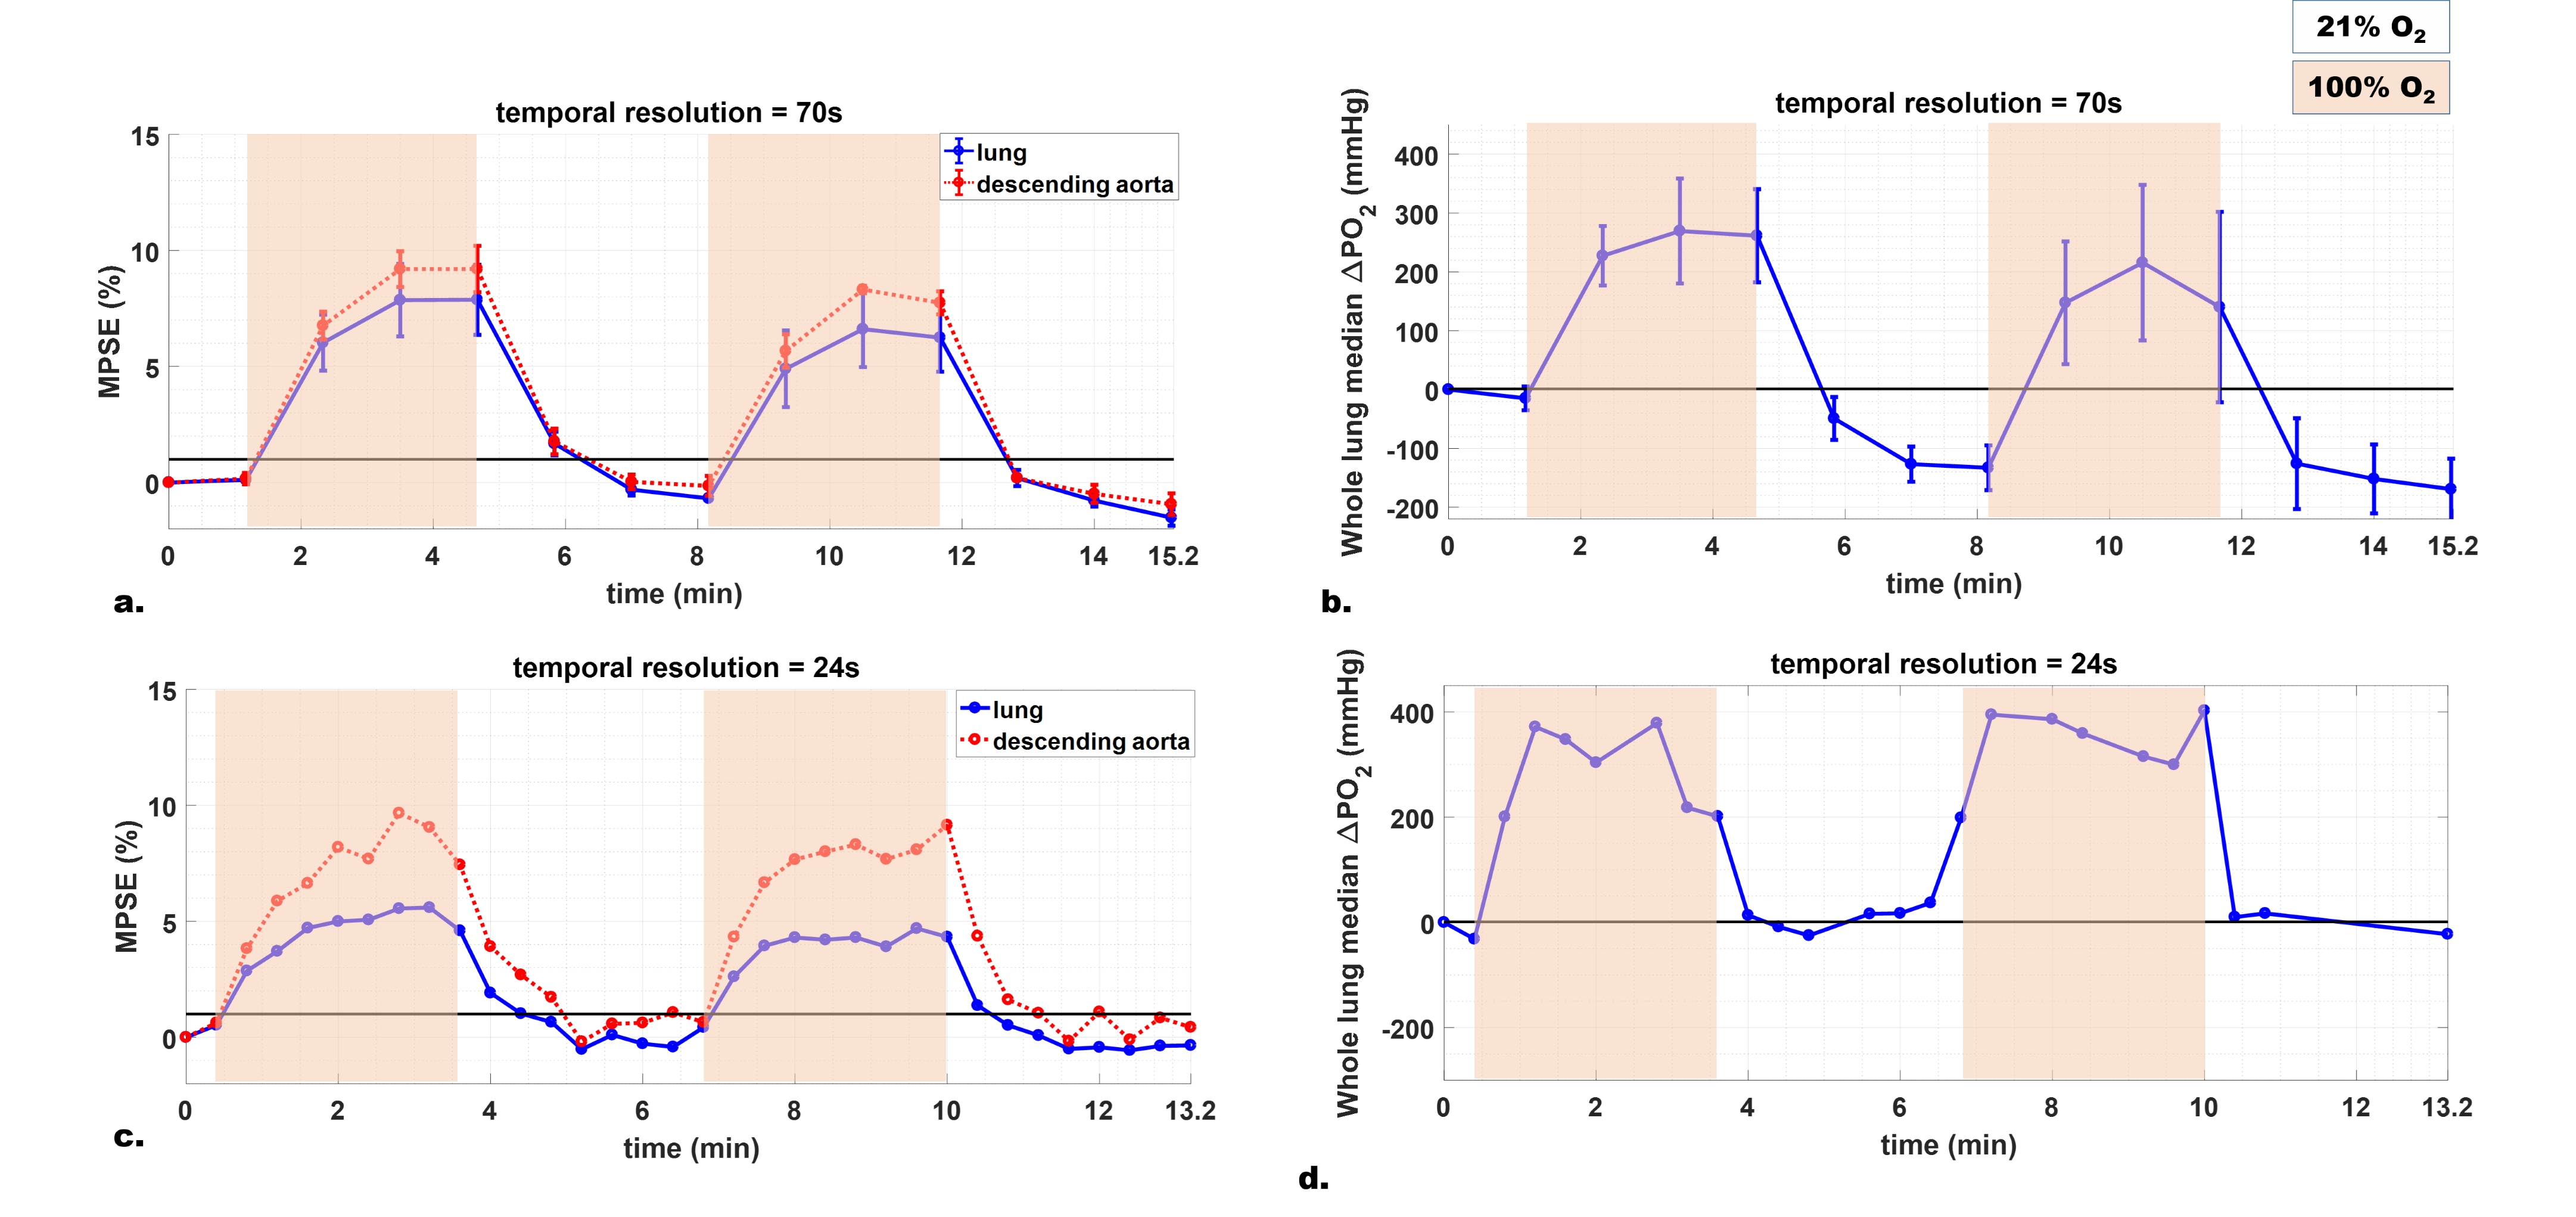
Table 1 summarizes the averaged measurements of all subjects derived from whole lung parametric maps. Figure 1 shows typical 3D T1 maps. Figure 2 shows time series examples of 3D PSE and ΔPO2 maps in the lungs and PSE in the aorta from a subject at 52s temporal resolution. The MPSE time series in the lungs significantly correlated with that in the aorta (ρ=0.996, p<0.0001). Figure 3 shows examples of 3D maximum PSE, ΔPO2max, wash-in and wash-out time constant maps. Figure 4 shows the averaged global MPSE and median ΔPO2 over time curves for all subjects at two temporal resolutions.DISCUSSION
This study used 3D dynamic UTE OE-MRI to obtain quantitative measures of oxygen wash-in and wash-out for a 24-second temporal resolution corresponding to a 13.2-min scan time. An additional ~14-min DESPOT1 scan enables ΔPO2 measures. The whole lung T1 estimates are comparable to the literature value 1200ms using inversion recovery sequence6. Compared to the measurements of asthmatics assessed from a coronal slice using dynamic OE-MRI5, we observed relatively higher median ΔPO2max and shorter time constants ($$$\tau_{up}$$$ and $$$\tau_{down}$$$) in this normal cohort. Experiments with varying temporal resolutions suggest that global MPSE time curves may be more robust than ΔPO2 time curves at a higher temporal resolution where signal-to-noise ratio degrades. Further work improvements include: 1) investigating the optimal temporal resolution for reproducibility and 2) evaluating this technique in asthmatics.CONCLUSION
The feasibility of using 3D dynamic UTE OE-MRI with full chest coverage and isotropic spatial resolution to achieve adequate temporal resolution for characterizing quantitative O2 wash-in and wash-out dynamics, together with the use of conventional MRI equipment and low-cost O2 gas makes this technique promising for clinical application in evaluating obstructive lung disease.Acknowledgements
This project was supported in part by grant UL1TR000427 to UW ICTR from NIH/NCATS, Research and Development Fund from Departments of Radiology and Medical Physics, University of Wisconsin-Madison, and grant support from GE Healthcare. We also acknowledge the research technologists who supported the MRI scanning in this work, including Kelli Hellenbrand, RT, Jenelle Fuller, RT, and Sara John, RT.References
1. Zha W, Kruger SJ, Johnson KM, et al. Pulmonary Ventilation Imaging in Asthma and Cystic Fibrosis Using Oxygen-Enhanced 3D Radial Ultrashort Echo Time MRI. J Magn Reson Imaging. 2017; doi:10.1002/jmri.25877.
2. Deoni SCL, Rutt BK, Peters TM. Rapid combined T1 and T2 mapping using gradient recalled acquisition in the steady state. Magn Reson Med. 2003;49(3):515-526.
3. Johnson KM, Fain SB, Schiebler ML, et al. Optimized 3D ultrashort echo time pulmonary MRI. Magn Reson Med. 2013;70(5):1241-1250.
4. Zaharchuk G, Busse RF, Rosenthal G,et al. Noninvasive oxygen partial pressure measurement of human body fluids in vivo using magnetic resonance imaging. Acad Radiol. 2006;13(8):1016-1024.
5. Zhang W-J, Niven RM, Young SS,et al. Dynamic oxygen-enhanced magnetic resonance imaging of the lung in asthma -- initial experience. Eur J Radiol. 2015;84(2):318-326.
6. Jakob PM, Hillenbrand CM, Wang T, et al. Rapid quantitative lung (1)H T(1) mapping. J Magn Reson Imaging. 2001;14(6):795-799.
Figures