1084
Quantification of gas concentration and fractional ventilation using high temporal resolution MRI of pulmonary fluorinated (19F) gas washin dynamics in free breathing1Institute of Diagnostic and Interventional Radiology, Hannover Medical School, Hannover, Germany, 2Biomedical Research in Endstage and Obstructive Lung Disease Hannover (BREATH), Member of the German Center for Lung Research, Hannover, Germany
Synopsis
19F gas washin/ washout MRI allows quantification of regional lung ventilation in free breathing even in obstructed lungs. By increasing the temporal and spatial resolution of dynamic 19F gas MRI at adequate image quality lung ventilation imaging was improved. In addition to measuring regional gas washin/ washout times, gas density variations during breathing were determined, giving further information of gas dynamics and therefore lung function. Additionally, the concentration of the fluorinated gas tracer and therefore its distribution in the lung was quantified. The new approaches were tested in a healthy volunteer and a COPD patient.
Introduction
Mapping of regional lung ventilation is essential for diagnosis and monitoring of obstructive lung diseases like asthma and COPD. Using fluorinated (19F) gas magnetic resonance imaging (MRI) to measure washin/ washout kinetics by inhaling a mixture of the tracer gas with oxygen over several breaths allows assessment of regional lung ventilation even in obstructed lung regions and in free breathing [1-3]. In a previous study, an excellent correlation of 19F gas washout time of the total lung with pulmonary function testing, the gold standard for diagnosis of COPD, was found [3]. However, gas dynamics and gas distribution while inhaling a normoxic fluorinated gas mixture are still not fully understood. Therefore, purpose of this work was to acquire 19F gas washin / washout dynamics at an increased spatial and temporal resolution and to quantify its distribution in the lung.Methods
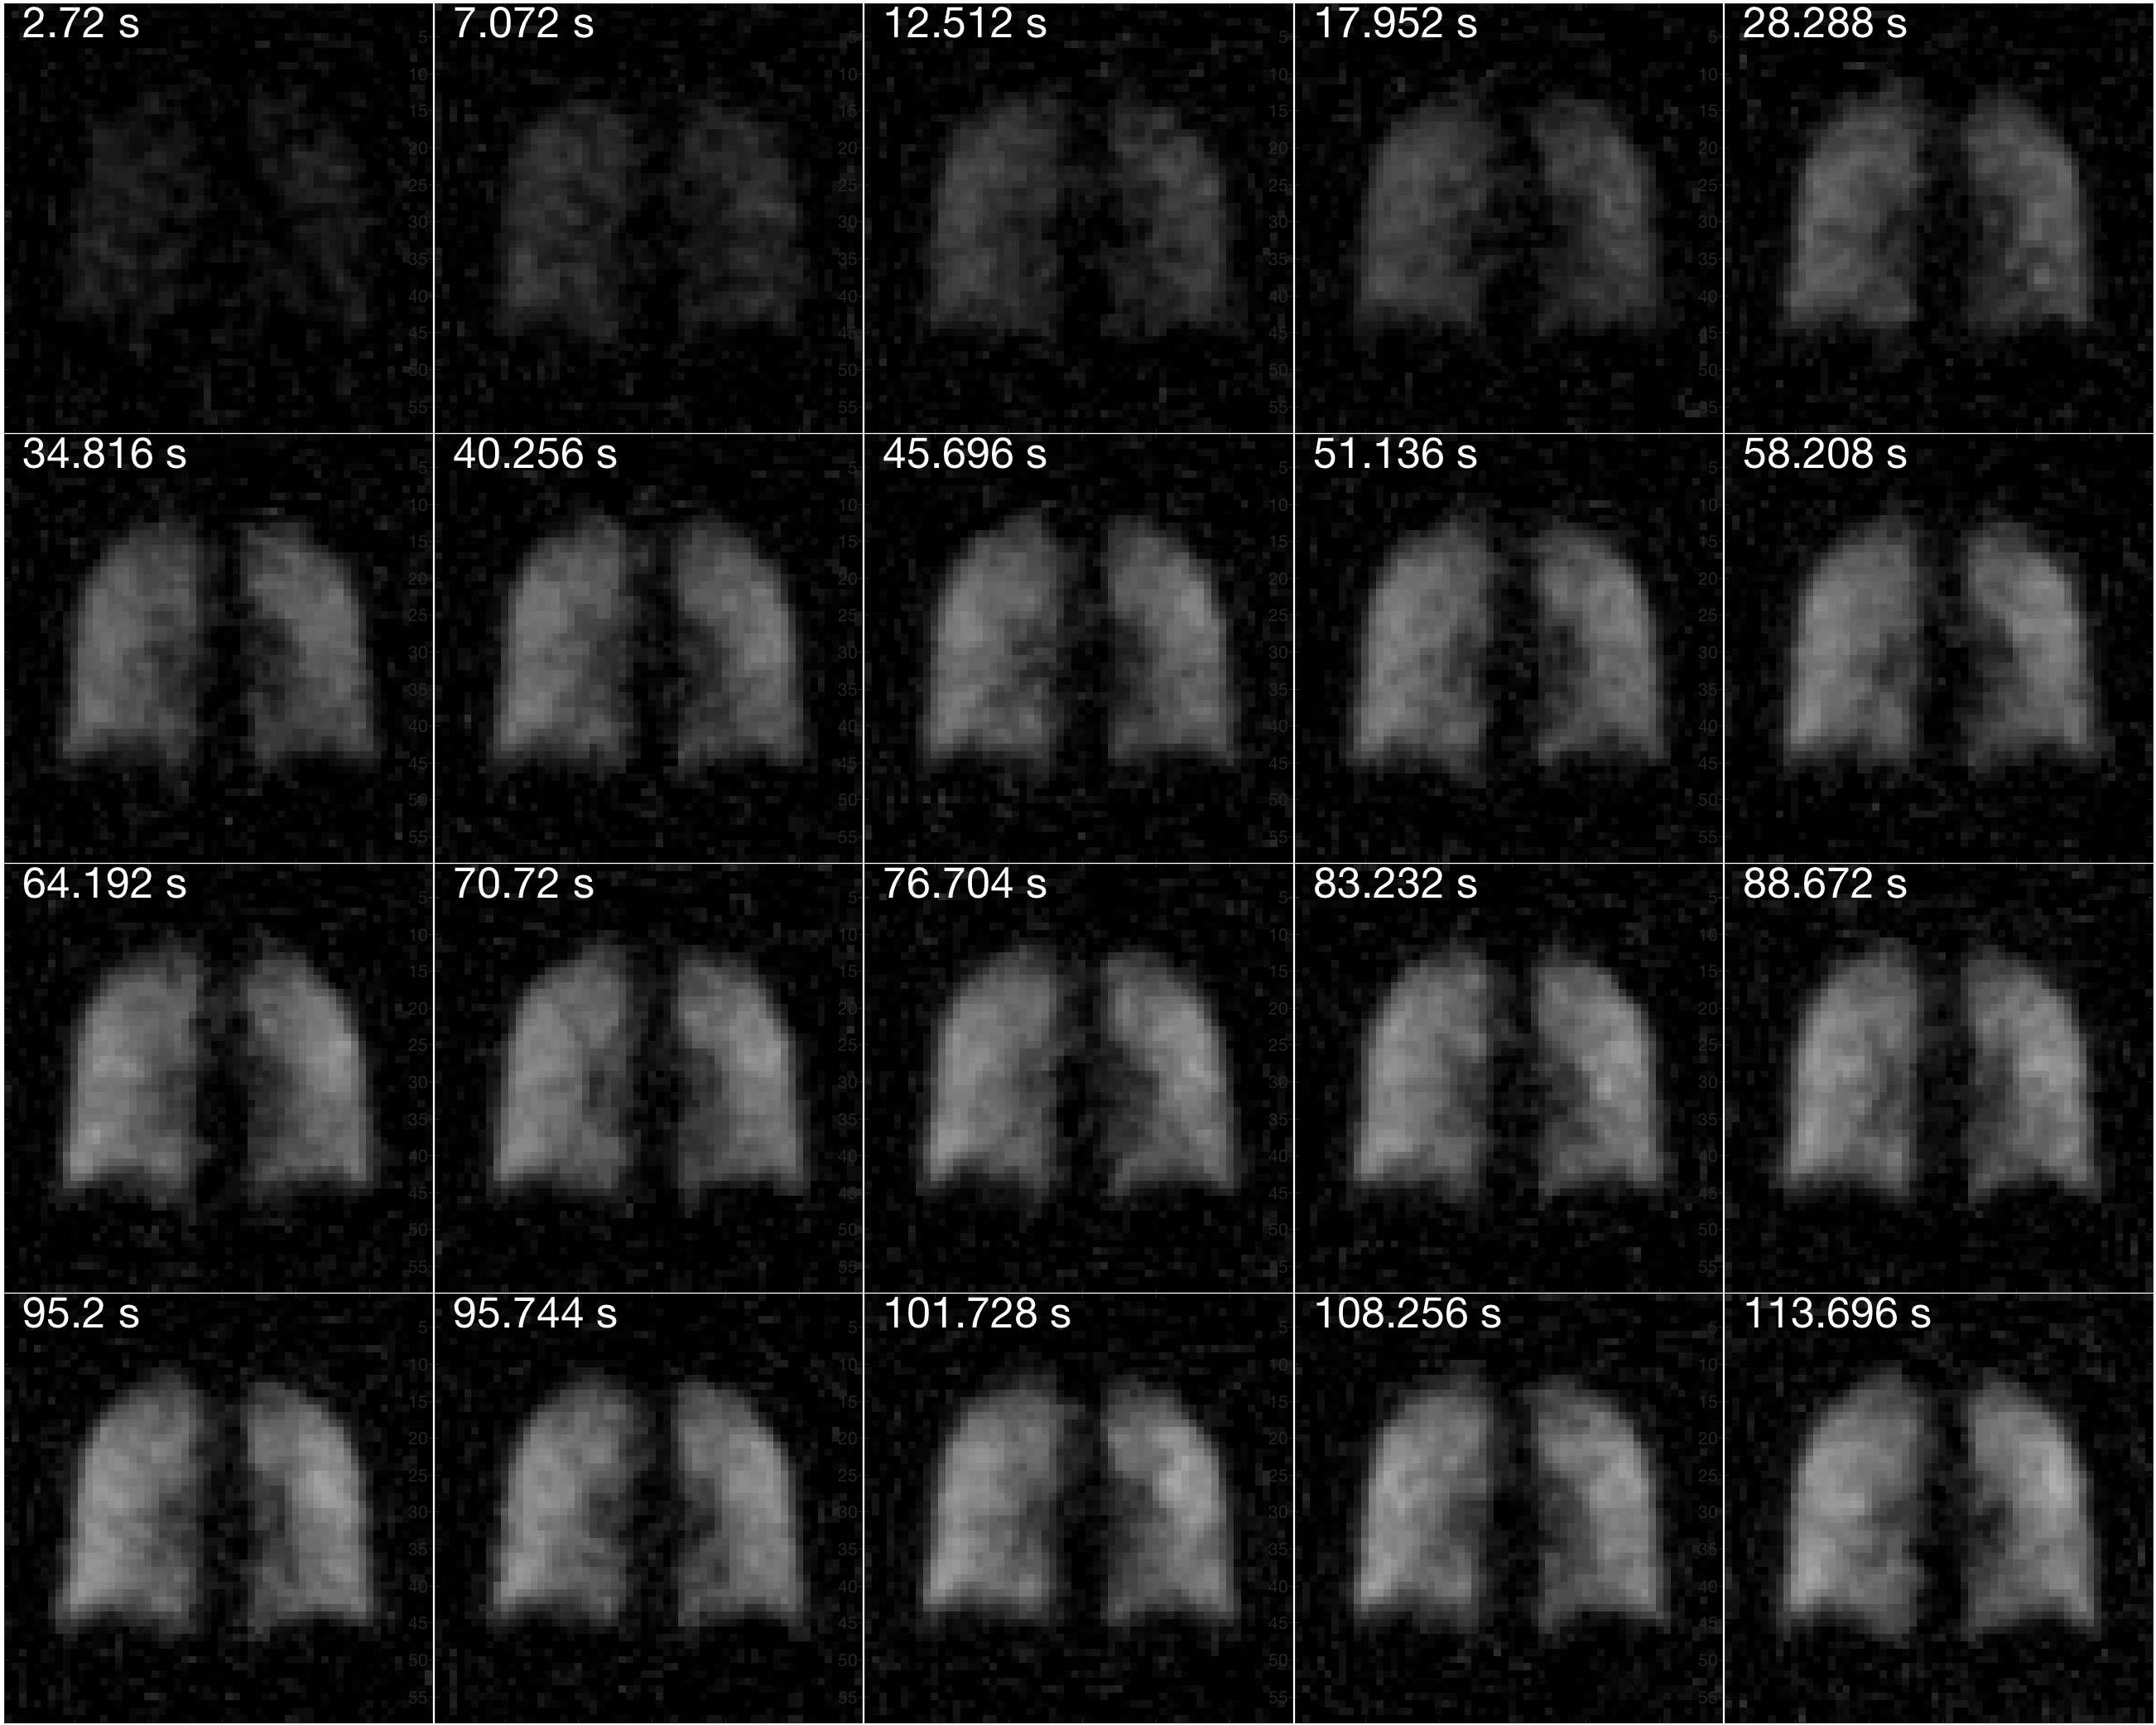
One healthy volunteer (30 years, male) and one patient with COPD (GOLD II, 76 years, male) were enrolled in this feasibility study approved by the institutional review board. Fluorinated gas MRI was performed on a 1.5 T scanner (Avanto, Siemens) with a transmit Helmholtz coil and a separate 16 channel phased-array receive coil (Rapid Biomedical) both tuned to 59.9 MHz. Each subject inhaled a mixture of 79% fluorinated gas (C3F8) and 21% oxygen from a 30L reservoir bag via closed facemask tubing. After inhalation of pure oxygen for 3 minutes, gas delivery was switched to the normoxic 19F gas mixture and gas washin MRI was performed in free breathing for approximately 2 minutes using a spoiled gradient echo (spGRE) sequence with stack of stars trajectory and an incrementation of the projection angle by the golden angle (TE=1.7 ms, TR=3.4 ms, flip angle: 30°, FOV: 400x400x240 mm3, matrix size: 64x64x12, 3496 projections). Applying a sliding window approach, for each 3D block 32 consecutive projections were reconstructed with a non-Cartesian parallel imaging algorithm resulting in 216 time points at a temporal resolution of 544 ms [4]. Subsequently, to quantify 19F gas concentration in the lung, in a single breath-hold T1 relaxation time was determined with the variable flip angle (VFA) method [5-7] (3D spGRE sequence with Cartesian sampling, TE=1.7 ms, TR=5 ms, three flip angles: 20°, 30° and 40°, FOV: 500x375x240 mm3, matrix size: 64x48x12, 2 averages, total scan time: 17.2 s). After switching to pure oxygen again, 19F gas washout imaging was started with the identical sequence as used for washin imaging. Dynamic data were sorted corresponding to its respiratory phase. Regional gas washin/ washout time and fractional ventilation (FV) respectively were calculated from the inspiratory 3D images. Additionally, eight temporal samples of 3D 19F MRI were reconstructed representing one respiratory cycle in order to calculated FV from gas density variations similar to 1H dynamic lung MRI [8, 9].Results
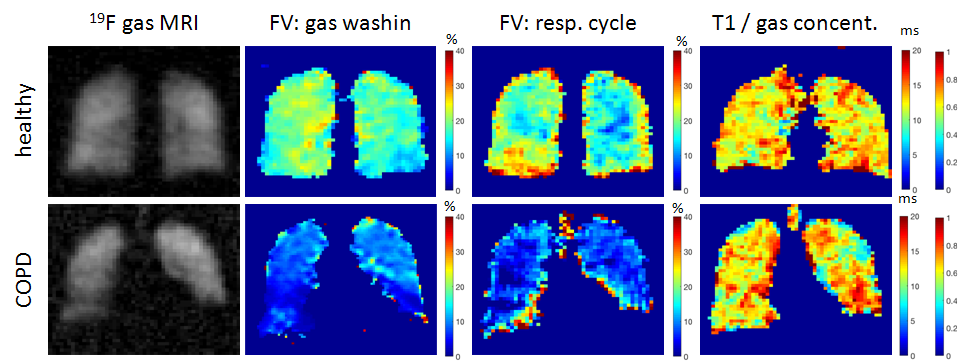
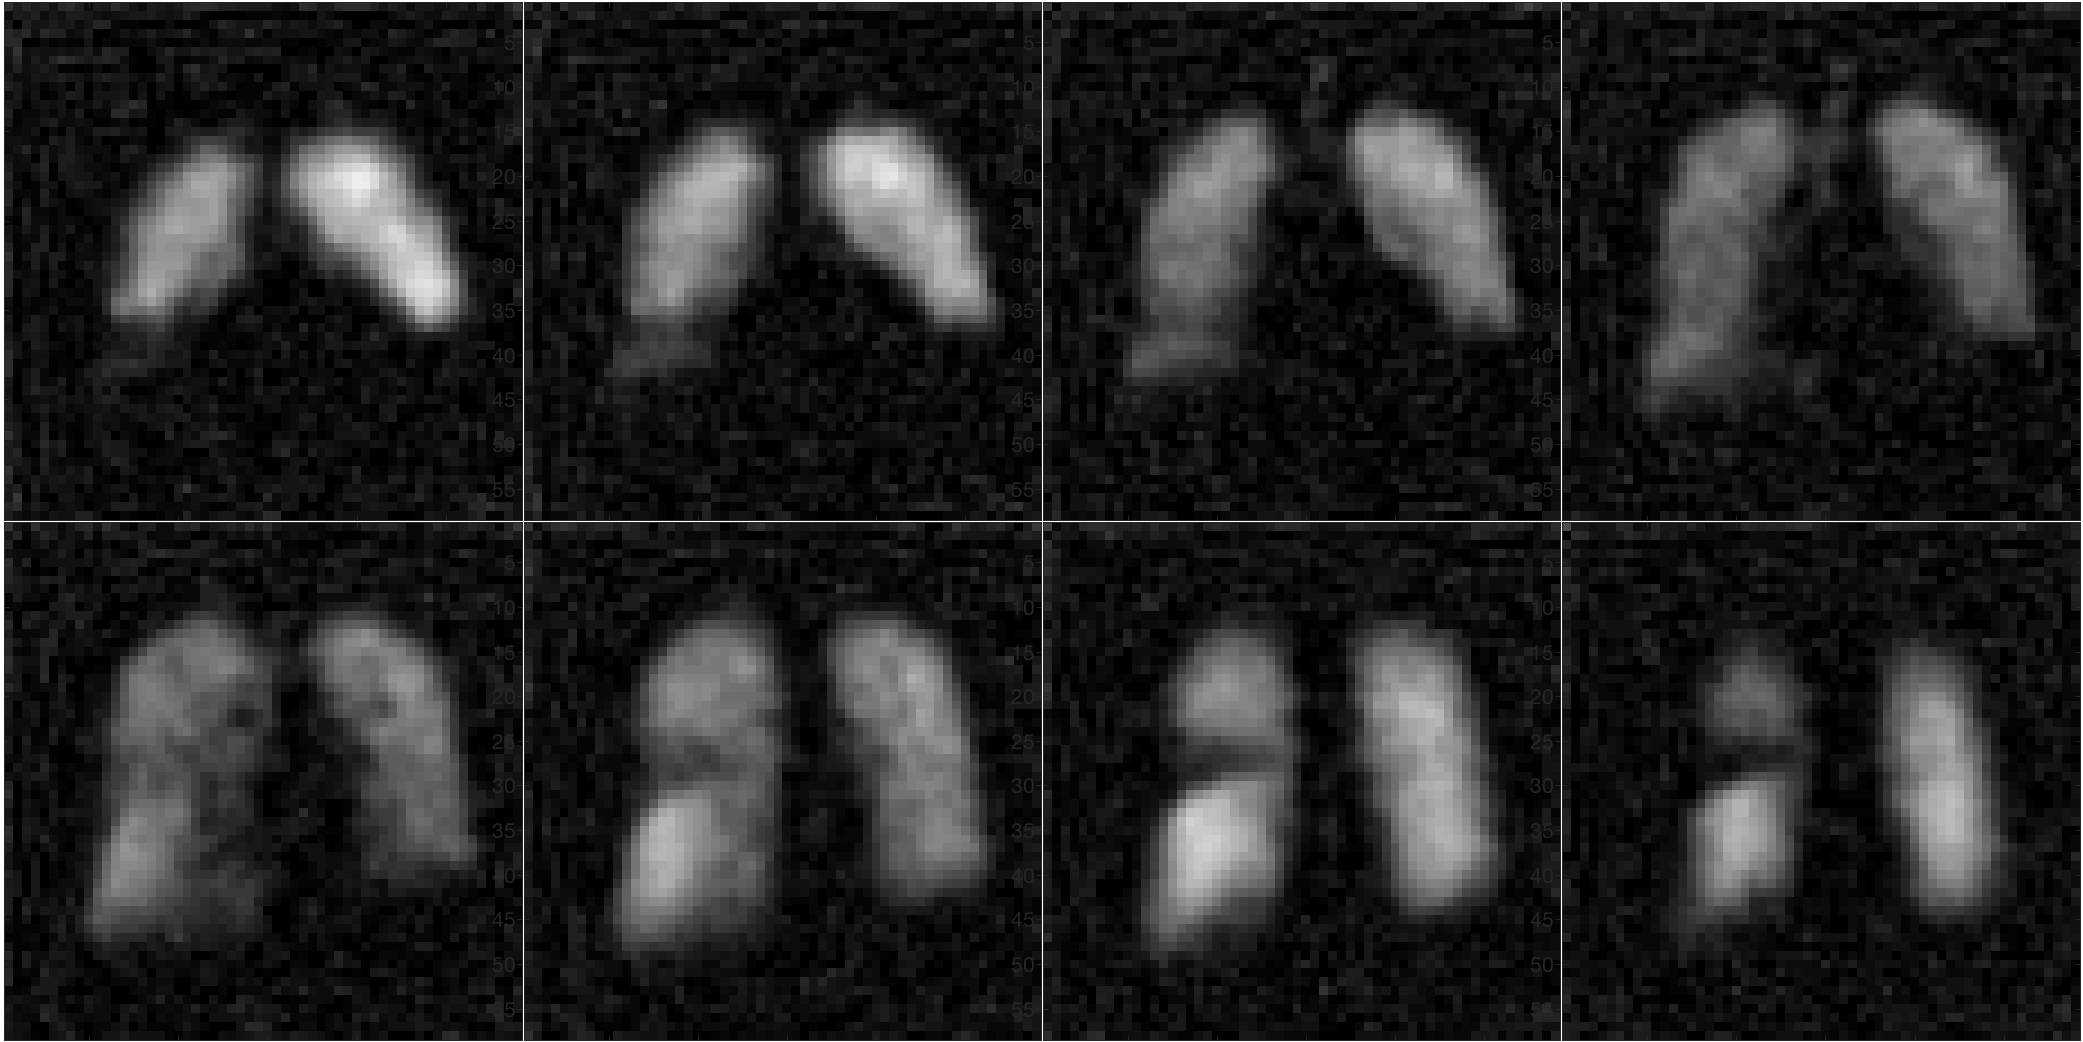
The gas washin dynamics in the healthy volunteer show a very homogeneous gas uptake over the whole lung (Figure 1). Fractional ventilation derived from the gas washin dynamics and by analysis of the gas density variation under breathing provided similar results (Figure 2, average of FV for the total lung: 17.0±5.2% vs. 18.9±8.7% (healthy subject) and 7.3±5.2% vs. 8.5±6.3% (COPD patient)). The mean fluorinated gas concentration in the total lung was below the concentration of the inhaled gas mixture of 79% C3F8 with a lower gas concentration in the COPD lung (healthy: 64.0±27.3% C3F8, COPD: 47.1±26.3% with T1 relaxation times: 13.1±2.8 ms and 12.0±3.1 ms respectively). The gas images acquired after inhalation of approximately 30L of the normoxic 19F gas mixture show regions of reduced gas concentration due to bronchial obstruction in the COPD patient (Figure 3).Discussion
Compared to previous work, spatial and temporal resolution of 19F dynamic gas MRI in free breathing could be improved (by a factor of 2.5 and 4 respectively) at adequate image quality. Acquisition of pulmonary 19F gas washin/ washout imaging at a sampling rate below the respiratory frequency gives the opportunity to quantify regional ventilation by both measuring the gas washin/ washout time and by measuring gas density variations in the lung. The resulting FV showed a good agreement for both approaches. The measured gas concentrations show that after inhalation of 30L of normoxic C3F8 gas mixture the equilibrium gas concentration is not reached. The lower gas concentration in the COPD patient compared to the healthy volunteer may be explained by the increased gas washin time due to bronchial obstruction.Conclusion
Increased spatial and temporal resolution may help to improve quantification of regional lung ventilation. The reduced gas concentration compared to the equilibrium gas concentration even after inhalation of 30L of the gas mixture needs to be considered for future 19F gas applications like diffusion or flow imaging.Acknowledgements
No acknowledgement found.References
[1] Couch MJ, et al. NMR in Biomed. 2014; 27(12): 1525–1534.
[2] Halaweish AF, et al. J Chest. 2013;144(4):1300-10.
[3] Gutberlet M, et al. Radiology 2017; doi: 10.1148/radiol.2017170591, in press
[4] Uecker M, et al. Proc Intl Soc Mag Reson Med 2015;23:2486.
[5] Christensen KA, et al. J Phys Chem 1974;78:1971-1977
[6] Chang Y, et al. J Magn Reson 2006;181(2):191-198
[7] Terekhov MV, et al. Proc Intl Soc Mag Reson Med 2007;15:1136
[8] Zapke M. et al. Respir Rs 2006;7(1):106
[9] Tibiletti M, et al. Proc Intl Soc Mag Reson Med 2017;25:1189
Figures