1083
Hyperpolarised gas MRI shows a decrease in lung ventilation defects at increased inspiratory lung volumes in Cystic Fibrosis1POLARIS, Academic Radiology, University of Sheffield, Sheffield, United Kingdom, 2Sheffield Children's Hospital NHS Foundation Trust, Sheffield, United Kingdom, 3University of Manchester, Manchester, United Kingdom
Synopsis
The effect of lung inflation level on ventilation defects, using hyperpolarised (HP) gas ventilation MRI, has not been assessed. The most commonly adopted method of inhaling a volume of 1L from functional residual capacity (FRC) will result in a lung volume closer to total lung capacity (TLC) for smaller people, compared with taller people. We assessed HP-MRI in 21 people with cystic fibrosis at both end inspiratory tidal volume (EIVt) and at TLC. Ventilation defects decreased in all subjects at TLC when compared to EIVt and therefore the inspiratory volume should be carefully considered when interpreting ventilation-imaging results.
Introduction
Lung imaging with hyperpolarised (HP) gas ventilation MRI is sensitive to early lung disease in cystic fibrosis (CF)1. Ventilation MRI is usually performed during a breath-hold at a lung volume of functional residual capacity (FRC) + 1L of inhaled gas, to represent end inspiratory tidal volume (EIVt). For smaller subjects this volume will be closer to the subject’s total lung capacity (TLC) than in taller subjects, which may impact on the number and size of ventilation defects present. This effect has not been systematically assessed. We hypothesised that there would be a decrease in ventilation abnormalities when imaged at TLC and that the reduction in abnormalities would be related to pulmonary function markers of disease severity.Methods
Children and adults with CF were recruited. Patients were clinically stable at the time of assessment. Patients performed pulmonary function tests to calculate; lung clearance index (LCI), residual volume (RV)/TLC (to measure trapped gas) and FEV1. Ventilation MRI was performed on a 1.5T GE HDX scanner using hyperpolarised helium-32. Ventilation images were acquired at two lung volumes; FRC + the volume of inhaled gas (EIVt); and at TLC. The inhaled bag volume for both EIVt and TLC images was titrated by patient height and based on predicted lung volumes3, using 10cm increments and ranged from 400ml-1L. The TLC image was performed by inhaling air to TLC, after inhaling the bag volume from FRC. Ventilation images were segmented alongside 1H anatomical images4, performed during the same breath-hold2, to calculate the ventilated volume (VV) and the thoracic cavity volume (TCV - to represent the lung volume) from MRI respectively. The ventilation defect percentage (VDP) was calculated as the percentage of un-ventilated lung within the thoracic cavity. The degree of ventilation heterogeneity within the lungs was assessed using the mean co-efficient of variation (CVm) of inter-voxel signal intensity within ventilated lung voxels5. The communicating ventilation fraction was calculated from: $$\frac{(VV_{TLC}-VV_{EIVt})/{VV_{EIVt}}}{(TCV_{TLC}-TCV_{EIVt})/{TCV_{EIVt}}}$$ and represents the percentage increase in ventilated volume in proportion to the percentage increase in thoracic cavity volume from EIVt to TLC. The difference in CVm (ΔCVm) was quantified by: CVm EIVt – CVm TLC .
Results
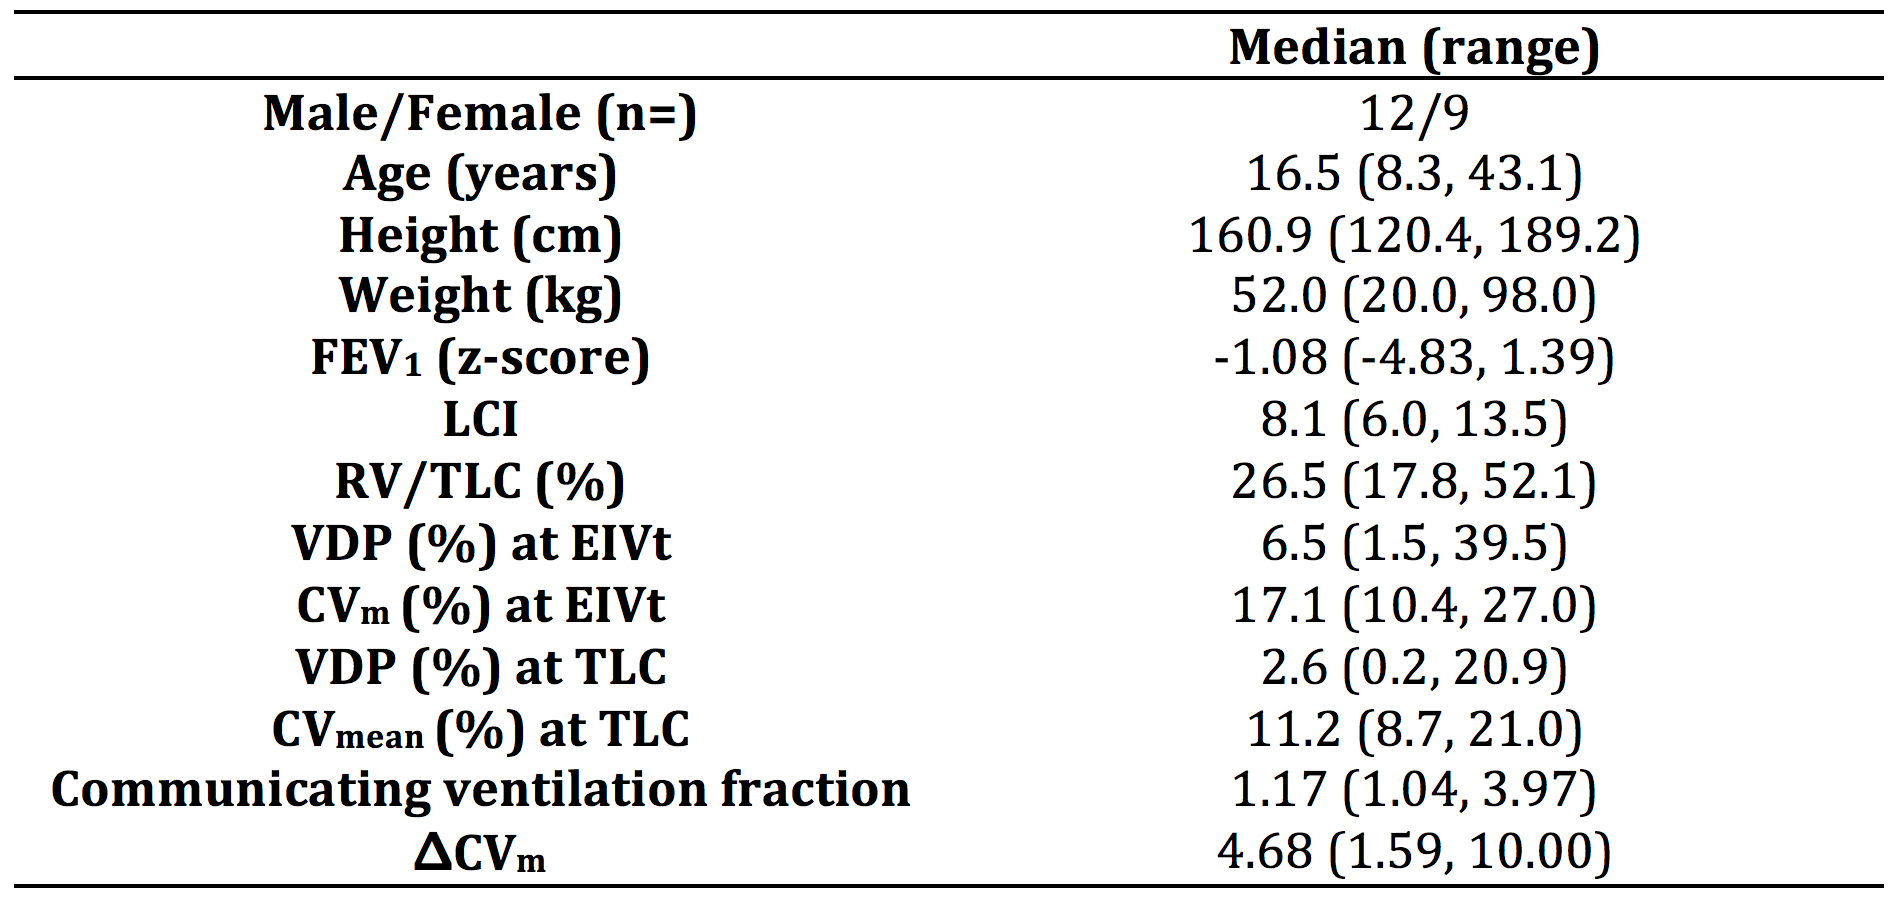
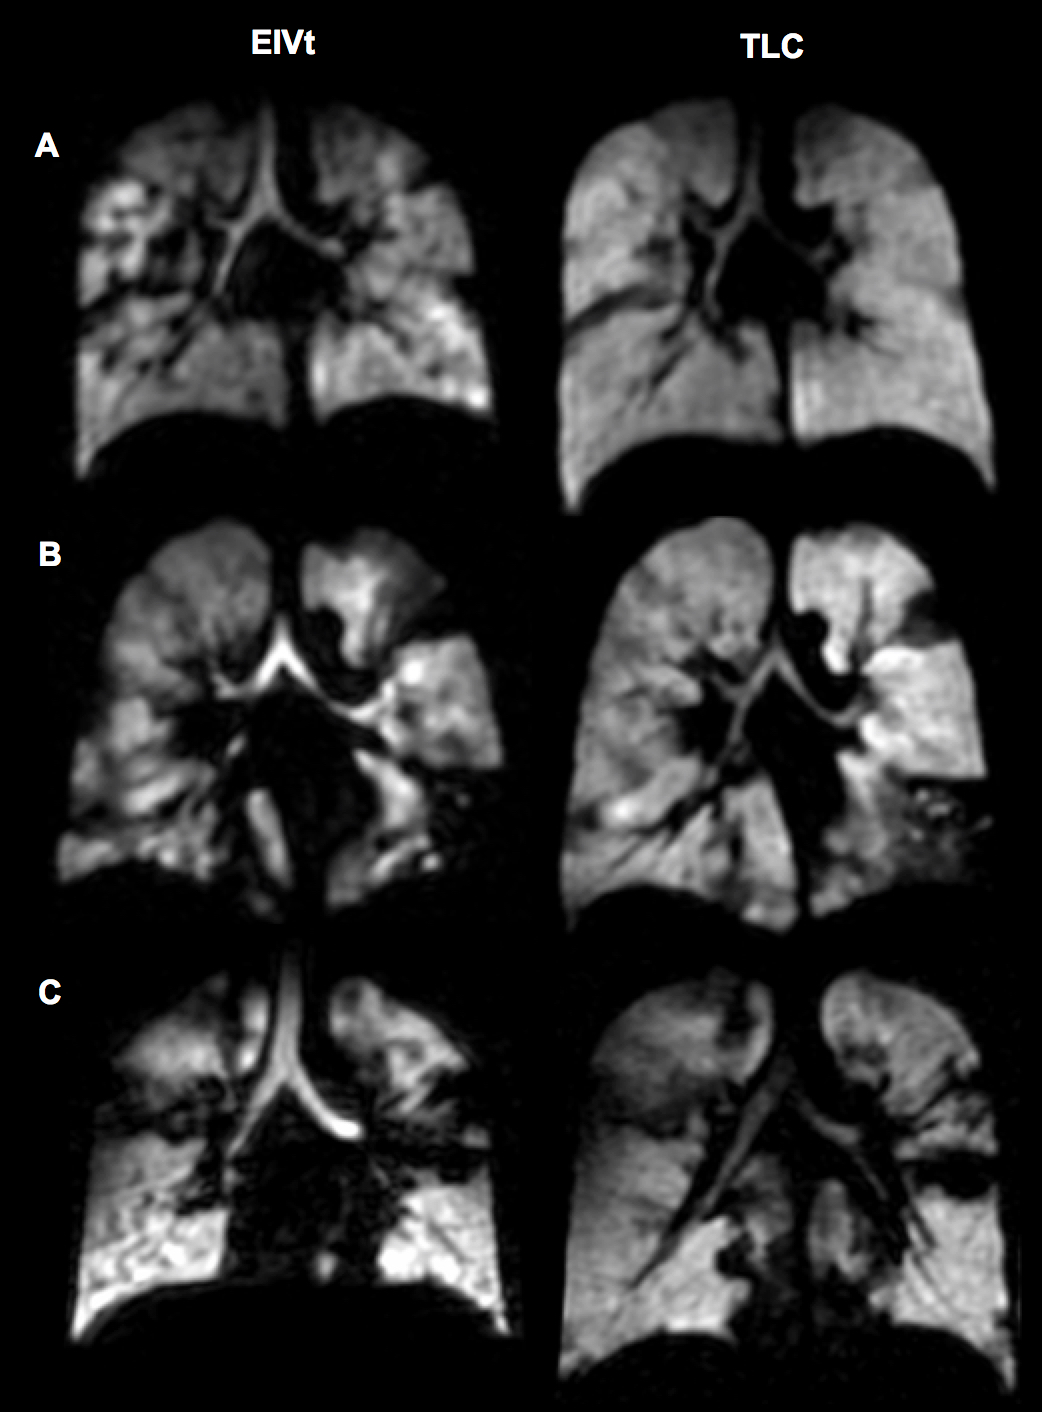
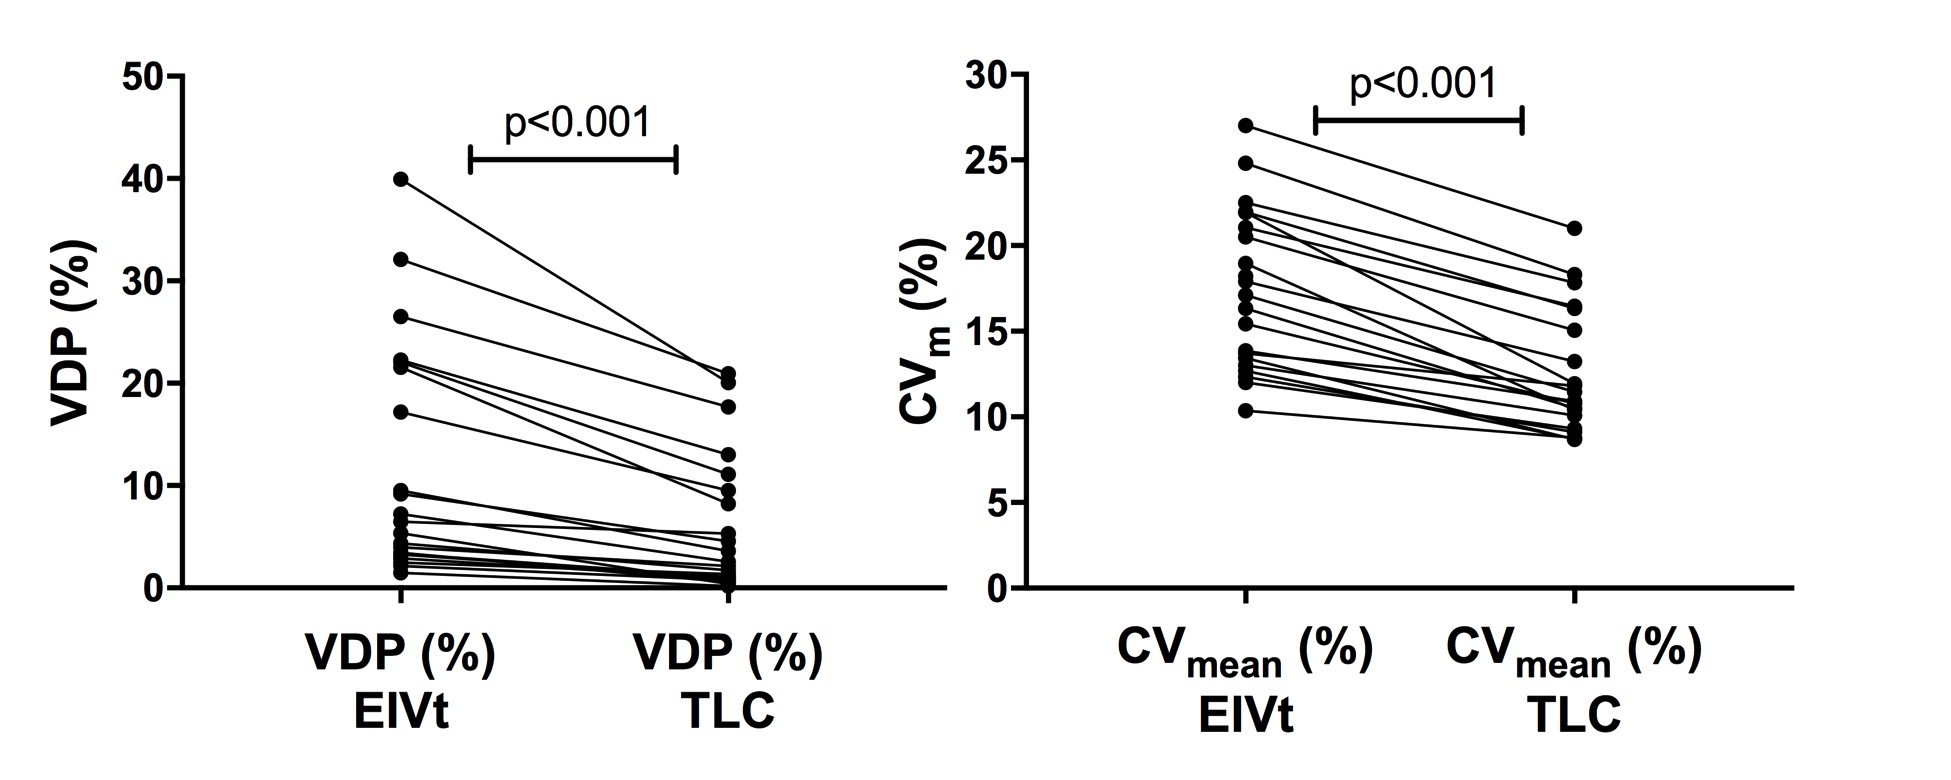
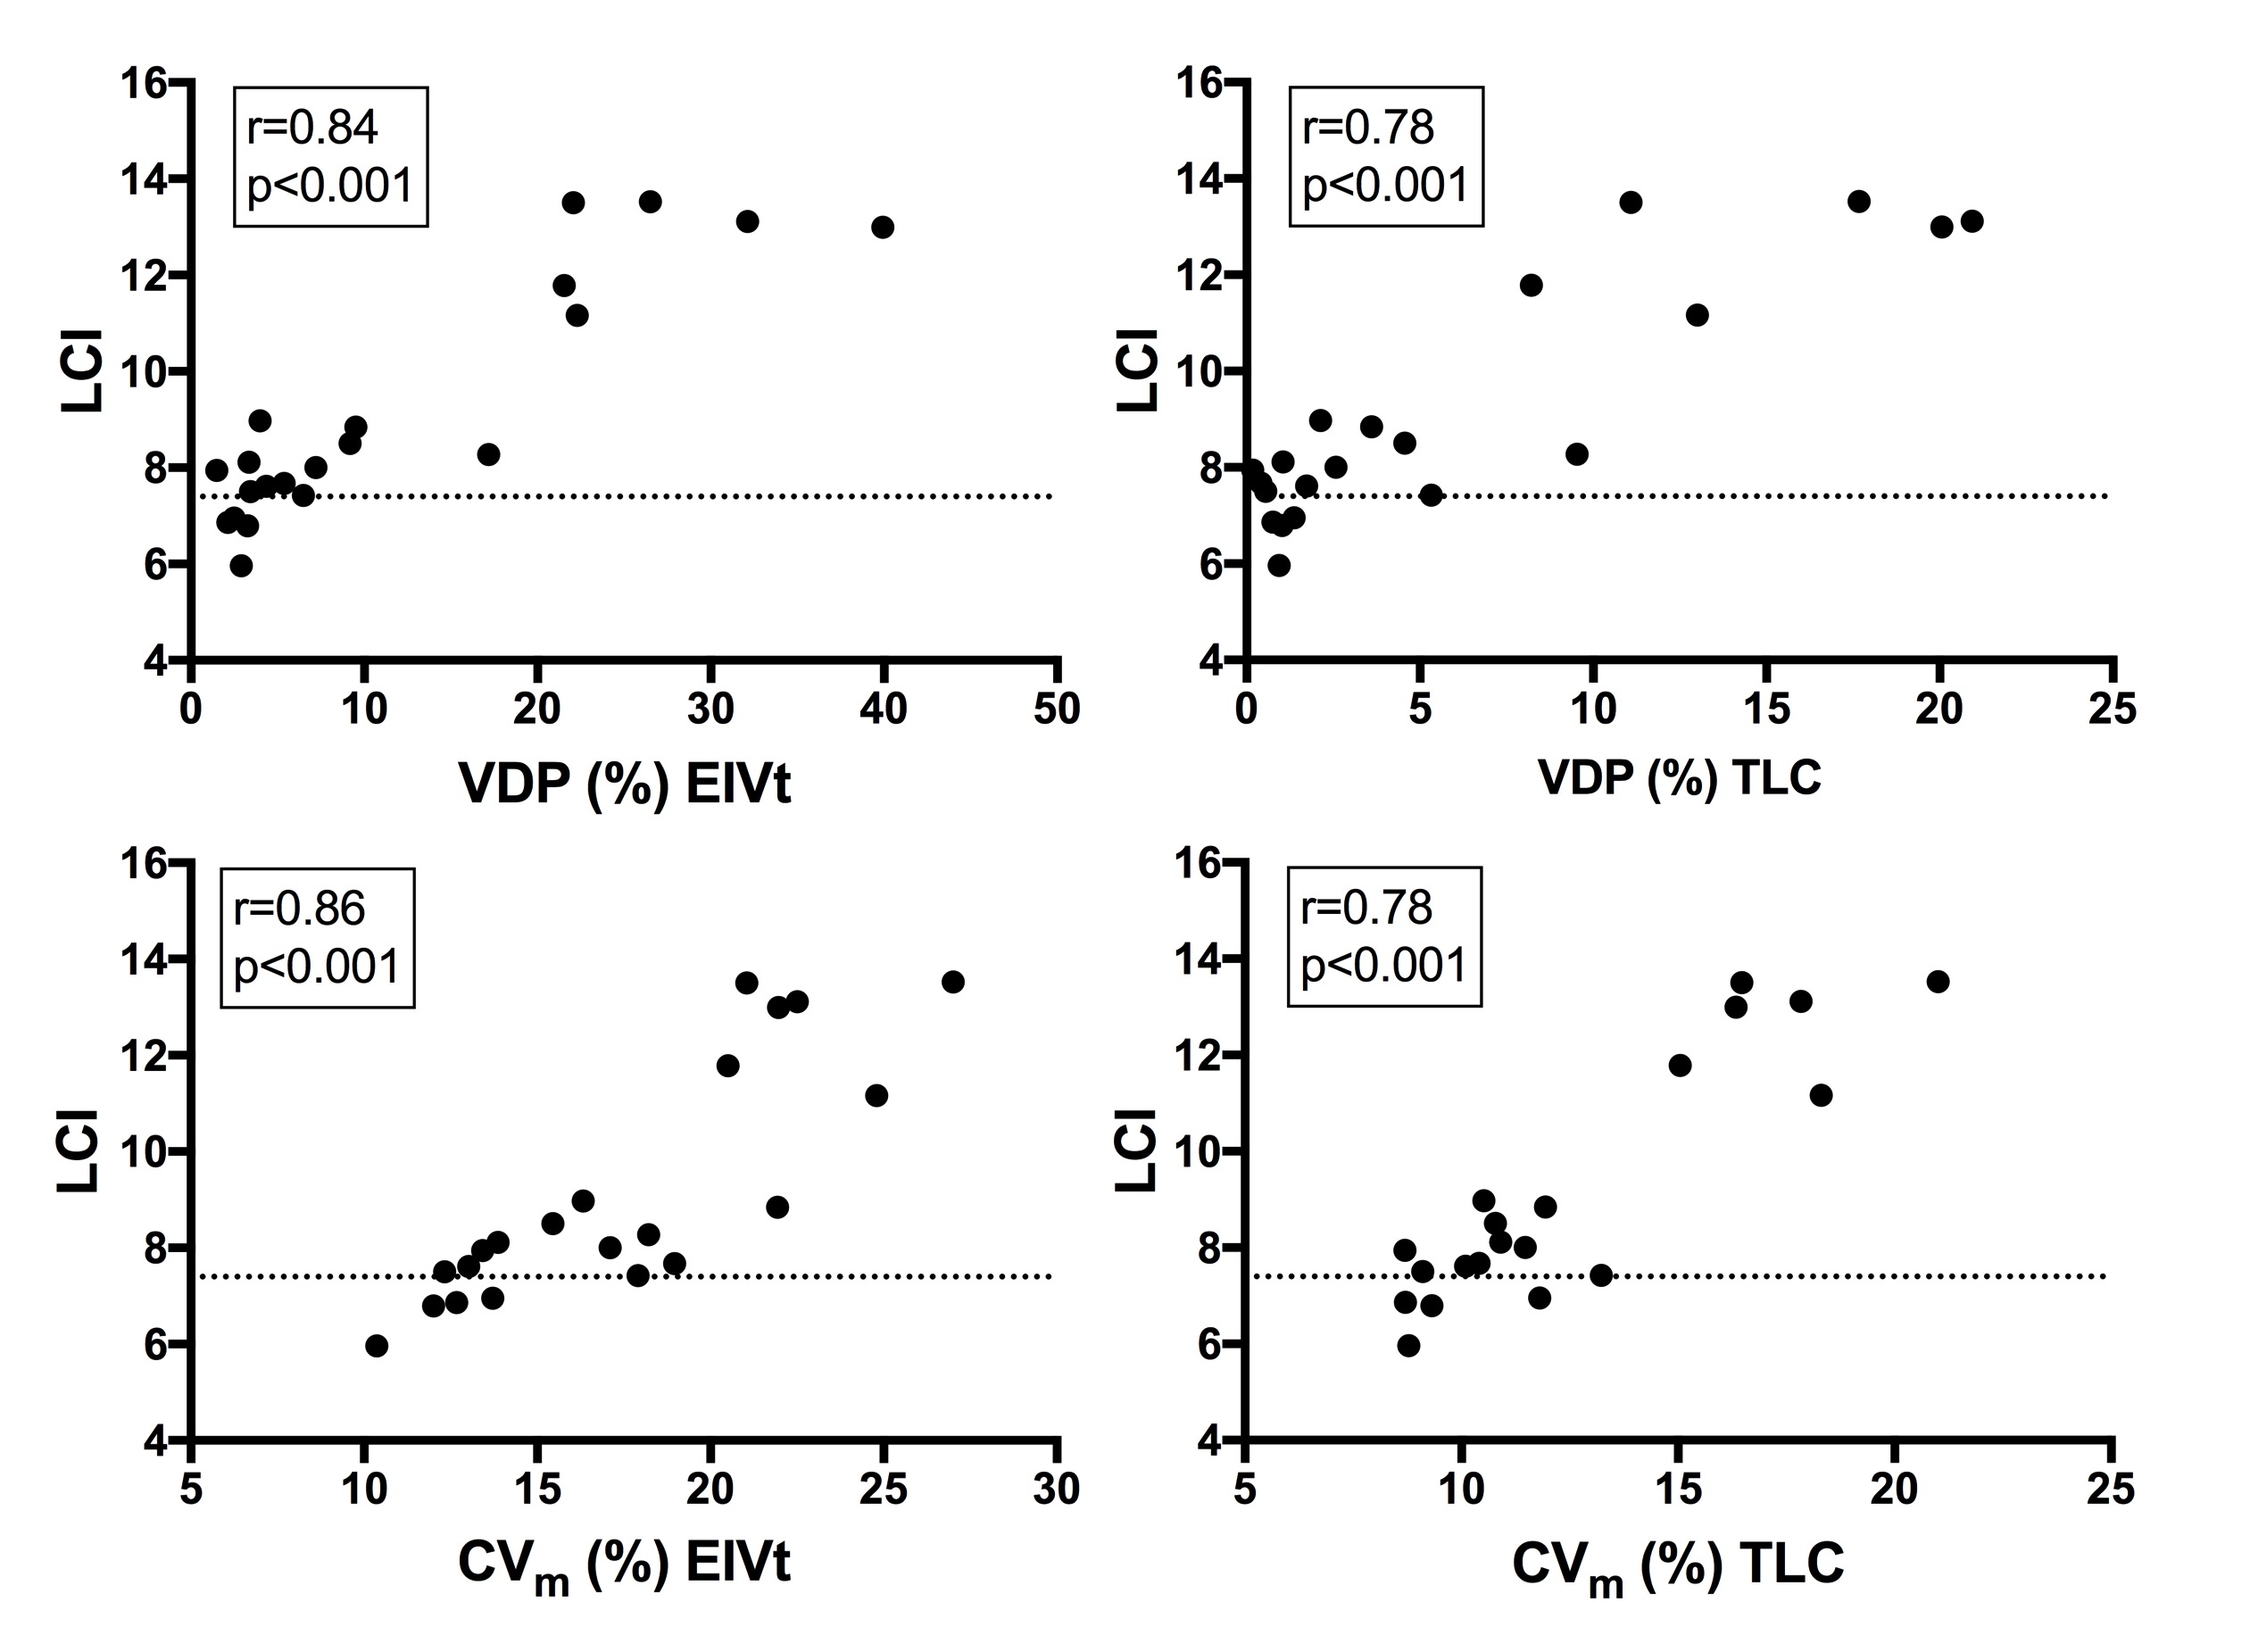
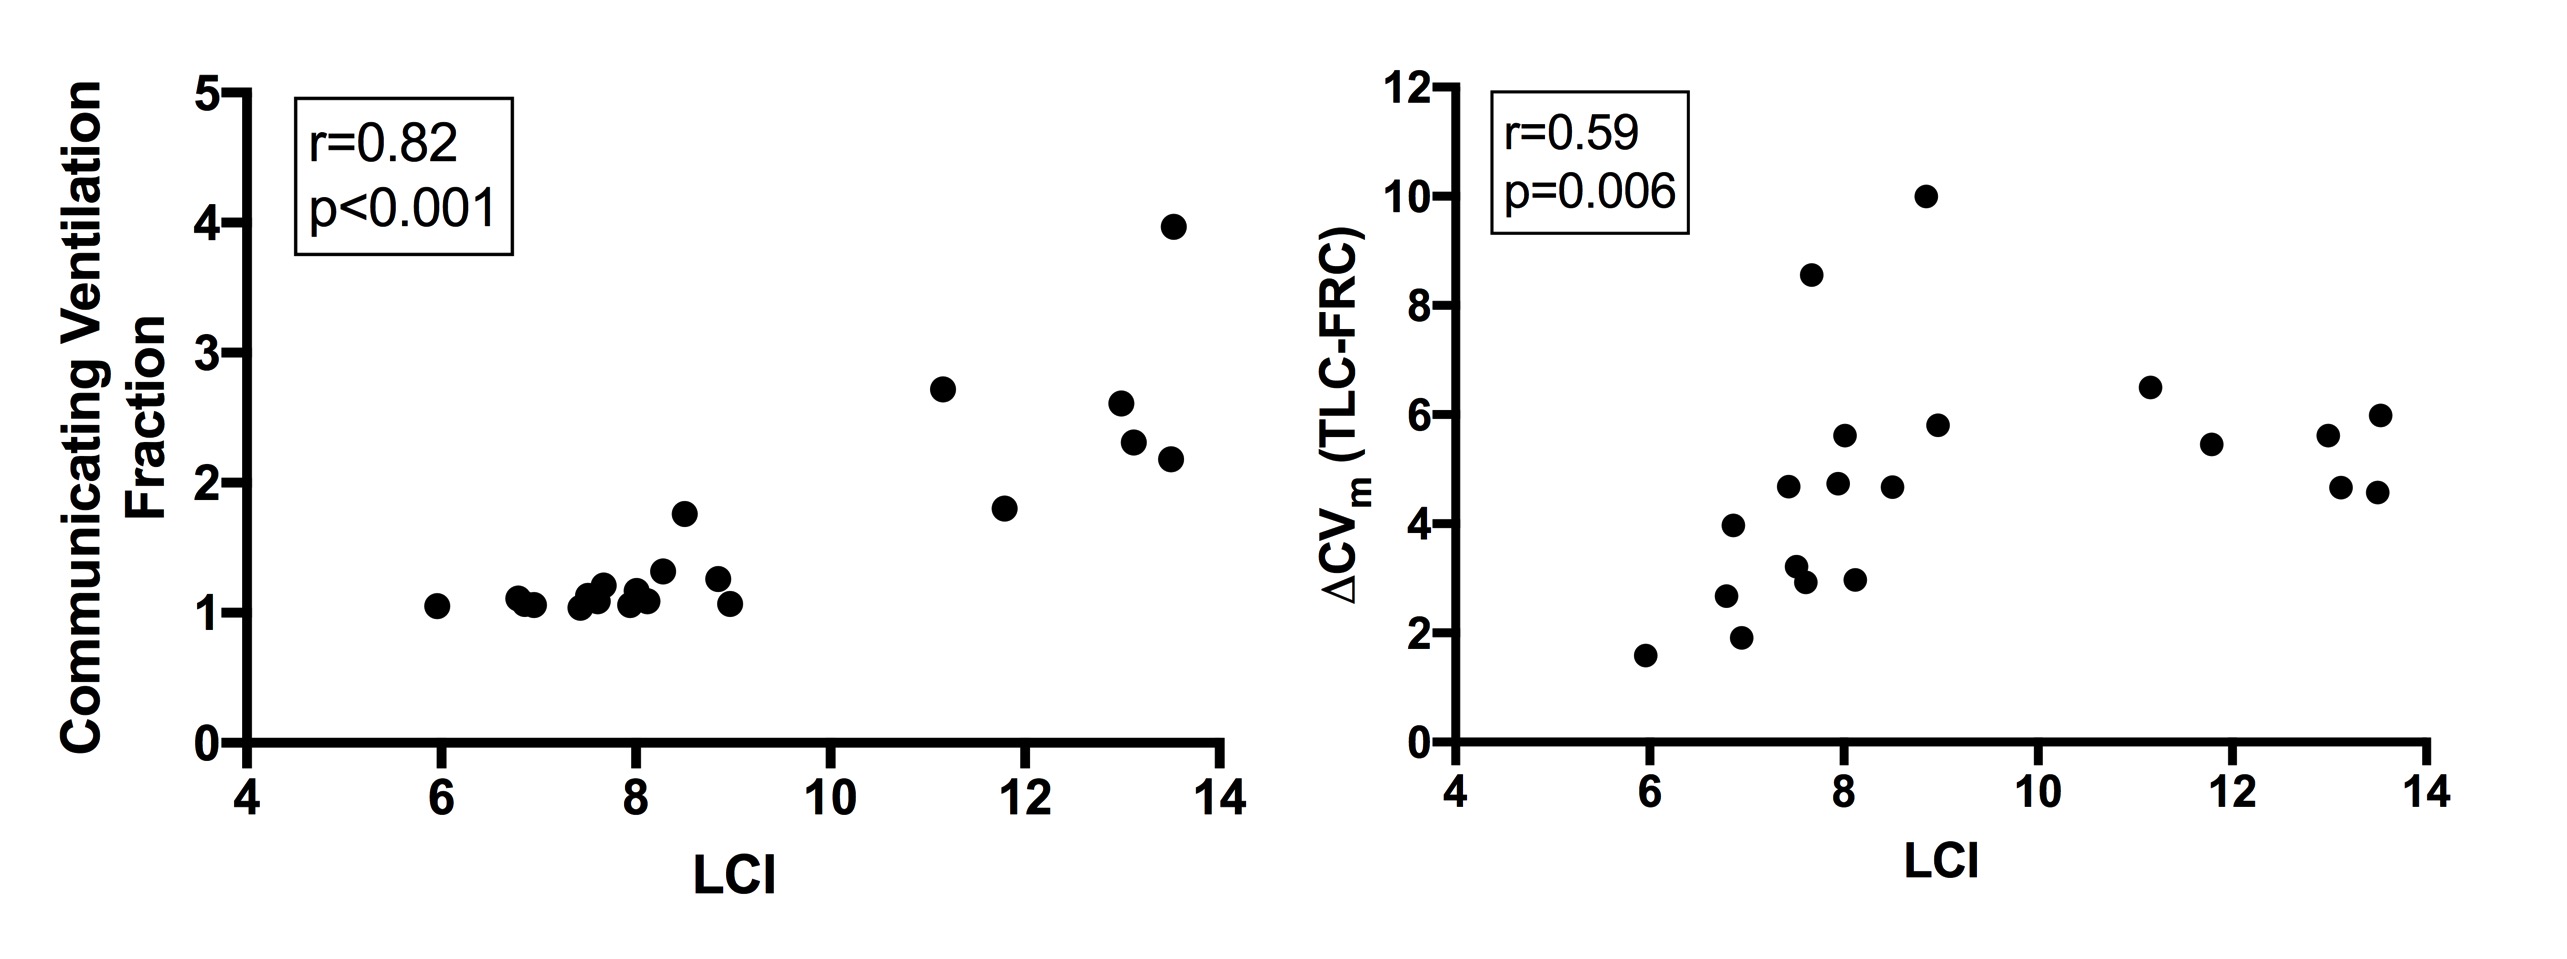
21 children and adults with CF and a range of underlying lung disease were assessed. Demographics, lung function and imaging metrics are summarised in Table 1. All patients had ventilation defects present at EIVt. At TLC these defects became fewer and the ventilation distribution less heterogeneous (Figure 1). Both VDP and CVm were significantly reduced (p<0.001) in all patients at TLC when compared to EIVt (Figure 2). There were significant correlations between LCI and VDP at both EIVt and TLC (r=0.84 and 0.78 respectively, p<0.001), and LCI and CVm at both EIVt and TLC (r=0.86 and 0.78 respectively, p<0.001) (Figure 3). VDP at TLC demonstrated the strongest correlation with RV/TLC (r=0.80, p<0.001). The communicating ventilation fraction (r=0.82, p<0.001) and ΔCVm (r=0.59, p=0.006) were both significantly correlated with LCI (Figure 4).Discussion
Ventilation MRI abnormalities can be expressed as both the amount of un-ventilated lung and the degree of heterogeneity within ventilated lung regions. Ventilation images assessed from patients with CF, performed at approximately end tidal inspiration, show increased values of both metrics, which significantly decrease with increasing lung volume. The relationship between VDP at TLC and RV/TLC suggests that un-ventilated lung regions remaining at TLC may represent completely obstructed lung and therefore trapped gas. There are strong correlations between LCI and both VDP and CVm at both lung volumes. Increasing communicating ventilation fraction appears to correlate well with increasing LCI. Therefore ventilation defects that can achieve ventilation through inhalation may represent slowly communicating lung regions contributing to increased LCI signal. In addition, ventilation becomes more homogeneously distributed at TLC with a decrease in CVm in all subjects.Conclusion
Increasing inspiratory lung volume reduces the amount of ventilation defects seen on hyperpolarised gas ventilation MRI, and should be carefully considered when interpreting ventilation imaging results in patient populations. The degree to which ventilation distribution changes with increased inspiratory volume closely relates to increasing ventilation heterogeneity measured during pulmonary function testing with LCI. Performing imaging assessments at both EIVt and TLC provides functional information on the pathophysiology of airways obstruction and may provide a measure of potentially reversible airways obstruction.Acknowledgements
We would like to acknowledge all members of the POLARIS research group for support. Also the cystic fibrosis clinical teams and their patients at Sheffield Children's and Teaching Hospitals and Manchester Wythenshawe Hospital, for their support. The authors also acknowledge the National Institute for Health Research (NIHR) and the Medical research Council (MRC).References
1. Marshall H, Horsley A, Taylor CJ, et al. Detection of early subclinical lung disease in children with cystic fibrosis by lung ventilation imaging with hyperpolarised gas MRI. Thorax 2017; 72(8): 760-2.
2. Horn FC, Tahir BA, Stewart NJ, et al. Lung ventilation volumetry with same-breath acquisition of hyperpolarized gas and proton MRI. NMR Biomed 2014; 27(12): 1461-7.
3. Rosenthal M, Cramer D, Bain SH, Denison D, Bush A, Warner JO. Lung function in white children aged 4 to 19 years: II--Single breath analysis and plethysmography. Thorax 1993; 48(8): 803-8.
4. Hughes PJC, Horn FC, Collier GJ, Biancardi A, Marshall H, Wild JM. Spatial fuzzy c-means thresholding for semiautomated calculation of percentage lung ventilated volume from hyperpolarized gas and 1 H MRI. J Magn Reson Imaging 2017.
5. Tzeng YS, Lutchen K, Albert M. The difference in ventilation heterogeneity between asthmatic and healthy subjects quantified using hyperpolarized 3He MRI. Journal of applied physiology (Bethesda, Md : 1985) 2009; 106(3): 813-22.
6. Horsley AR, Gustafsson PM, Macleod KA, et al. Lung clearance index is a sensitive, repeatable and practical measure of airways disease in adults with cystic fibrosis. Thorax 2008; 63(2): 135-40.
Figures