1082
A Technique for Quantitatively Measuring Gas Uptake in the Lung and its Distribution to the Kidneys Using Hyperpolarized Xenon-129 MR Imaging1Radiology, University of Pennsylvania, Philadelphia, PA, United States, 2Physiology, University of Pennsylvania, Philadelphia, PA, United States, 3Anesthesiology and Critical Care, University of Pennsylvania, Philadelphia, PA, United States
Synopsis
Hyperpolarized 129Xe was used before to image lung function and structure. It was also shown to be a very good marker of oxygen diffusion and uptake from the lung, and a surrogate for alveolar wall thickness. Here, we demonstrated a technique for quantitatively measuring gas uptake in the lung and its distribution to the kidney and calculate the arrival time of the gas to the kidneys. Appropriate acquisition parameters will enable the same technique to be used to measure the gas’ arrival at the heart, specific vasculature, or other organs/tissue as appropriate to specific disease states.
Introduction: Acute Lung Injury (ALI) and reduced kidney filtration are comorbid factors; patients in renal failure rarely survive ALI1, and compromised renal oxygenation contributes to acute and chronic kidney disease2. Although lung oxygen uptake and organ-specific delivery are difficult to measure in real time, hyperpolarized xenon-129’s similar blood saturation and hemodynamics allow it to be used as a hemoglobin-binding surrogate. Unlike x-ray based xenon techniques, RF-induced manipulation can be used to label the gas as it moves among different physical locations or chemical environments (e.g., gas and dissolved phases).
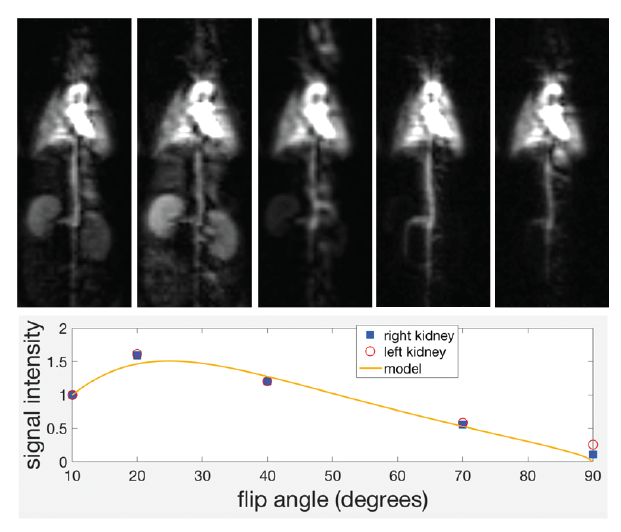
Materials and Methods: A Sprague-Dawley rat was anesthetized IP, intubated, and continuously ventilated with TV = 3ml, BR = 43min-1 and FiO2 = 1. At the beginning of image acquisition, FiO2 was reduced to 0.5 with balance hyperpolarized 129Xe. For each of a series of five images using dissolved phase flip-angles of 90, 70, 10, 20 and 40 degrees, respectively, one k-space line was acquired after every end-exhale (120 PE lines in total). TR/TE = 1.39s/2.3ms and acquisition bandwidth was maintained low enough (110 Hz/pixel) that separate, non-overlapping images of gas and dissolved phases were obtained in the readout direction (80 readout pixels, L-R in the figure). The RF pulse was centered on the dissolved phase and was sufficiently selective that it caused negligible gas phase relaxation. After normalizing each dissolved image to the delivered gas magnetization as obtained from the gas phase image, a recursive model of signal build-up was fit to the image intensity over both kidneys as a function of flip-angle. The model included the rates of xenon uptake into lung tissue, RF-induced magnetization loss en route to the kidneys, and gas dissolution and relaxation in kidney tissue as:
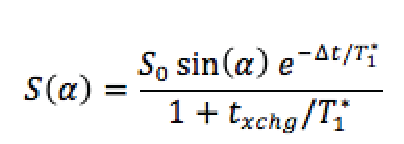
$$
in which T1 refers to the effective spin-lattice relaxation time including RF-induced relaxation » 1/T1 + [1-cos(a)]/TR. Δt and txchg refer to the time delay between gas dissolution in the lung parenchyma and uptake by the kidneys, and the characteristic time required for kidney dissolved gas concentration to equilibrate with that of the blood. Δt and txchg are allowed to vary freely along with T1 and the arbitrary normalization S0 in the fit. Note that the factors in the above equation correspond to the efficiency of the pulse [sin(a)], the loss of magnetization during transit [exp(…)] and the balance between blood and kidney tissue magnetization [1+txchg/T1*]-1
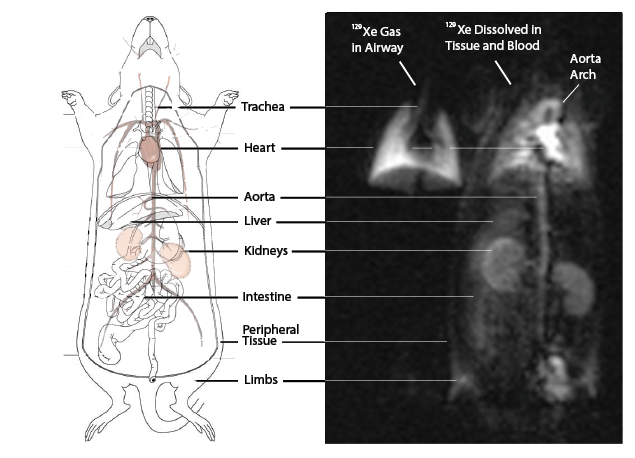
Results and Discussion: Figure 1 shows the distribution of Hyperpolarized 129Xe gas in the lung airways (Left), and the 129Xe dissolved/blood phase (Right) in the Lung Parenchyma, which can also be visualized in the aortic arch, heart, kidneys, liver, intestine, limbs and peripheral tissues. 129Xe signal dynamics are indistinguishable between left and right kidneys (Figure 2). At low flip-angle, steady-state dissolved phase signals in the kidney (and elsewhere) are low due to inefficient RF excitation. At high flip-angle, the signal is again reduced due to magnetization loss en route, either while dissolved in lung parenchymal tissue, in the heart or in other vasculature. Through the fit we constrain the exchange time for gas to saturate the kidneys to 24.7 +/ 1.8s, and the mean time between gas dissolution in the lung and arrival at the kidney to 0.83 +/ 0.22s. Although of less direct interest, the derived blood and tissue T1 is 20.6 +/- 2.4s, which is within or slightly below the generally-accepted range used for in vivo modeling3. Three assumptions were made in this analysis that require further verification: first, blood and tissue relaxation were described by the same parameter T1, which may be an oversimplification; second, the same flip angle was assumed to be appropriate for all locations within the field of view; third, the expression for T1* implicitly contains a small flip-angle approximation and assumes multiple excitations during the relevant signal buildup period, although a discrete-excitation modeling of signal buildup did not reveal significant error introduced by this approximation.
Conclusion: We demonstrated a technique for quantitatively measuring gas uptake in the lung and its distribution to the kidney. Future studies will determine the relationship between alterations to these values and experimental models of lung or kidney injury. Appropriate acquisition parameters will enable the same technique to be used to measure the gas’ arrival at the heart, specific vasculature, or other organs/tissue as appropriate to specific disease states.
Acknowledgements
No acknowledgement found.References
[1] Paladino JD, Hotchkiss JR, Rabb H. Acute kidney injury and lung dysfunction: a paradigm for remote organ effects of kidney disease?Microvasc Res 77(1):8-12(2009).
[2] Singh P, Rickstein S-E, Bragadottir G, Redfors B, Nordquist L. Renal oxygenation and hemodynamics in acute kidney injury and chronic kidney disease. Clin Exp Pharmacol Physiol 40(2):138-147 (2013).
[3] Kazan SM, et al. Kinetic modeling of hyperpolarized 13C pyruvate metabolism in tumors using a measured arterial input function. MRM 70(4): 943-953 (2013).
Figures