1081
Altered Right-Heart 3D Blood Flow and Kinetic Energy in Chronic Obstructive Pulmonary Disease. The MESA COPD Study1Department of Medical Imaging, Lurie Children's Hospital, Chicago, IL, United States, 2Department of Radiology, Northwestern University, Chicago, IL, United States, 3Department of Medicine and Epidemiology, Columbia University, New York, NY, United States, 4Department of Radiology, University of Wisconsin School of Medicine and Public Health, Madison, WI, United States, 5Department of Radiology, Weill Cornell Medical College, New York, NY, United States, 6Department of Radiology, Columbia College of Physicians and Surgeons, New York, NY, United States, 7Division of Cardiology, John Hopkins University, Baltimore, MD, United States, 8Department of Medicine, UCLA, Los Angeles, CA, United States
Synopsis
Chronic Obstructive Pulmonary Disease (COPD) affects over 65 million people worldwide and is the third leading cause of death in the US. The aim of this feasibility study was to employ 4D-flow MRI for the comprehensive assessment of the effects of COPD on right-sided hemodynamics. Measures of blood kinetic energy (KE) were used to quantify hemodynamic changes in COPD patients compared to controls. Findings showed a significant increase in KE in the right atrium across increasing categories of COPD severity. Right-sided 4D flow MRI maybe a promising tool for the detection of hemodynamic disruptions in COPD and other vasoconstrictive diseases.
Purpose:
Chronic obstructive pulmonary disease (COPD) affects over 65 million people worldwide and accounts for 5% of all deaths globally1,2. COPD is characterized by the partially irreversible obstruction of airflow to the lungs. Chronic hypoxia induces vasoconstriction of the pulmonary arteries to redirect the distribution of capillary blood flow to well-ventilated regions of the lungs3. The resultant increase in pulmonary vascular resistance may lead to pulmonary hypertension and is suspected to have a wider impact on changes in right-sided (right heart, main pulmonary arteries) hemodynamics4. However, normal right-sided flow characteristics are complex (normal physiologic vortex flow in the right atrium, pulmonary outflow patterns) and the impact of COPD induced changes are poorly understood. The aim of this feasibility study was to employ 4D-flow MRI for the comprehensive assessment of the effects of COPD on right-sided 4D (3D+time) hemodynamics. 4D-flow derived measures of blood kinetic energy (KE) were used to quantify hemodynamics changes in COPD patients compared to healthy controls. We hypothesized that COPD causes a disruption of normal right-sided flow physiology and associated changes in blood kinetic energy.Methods:
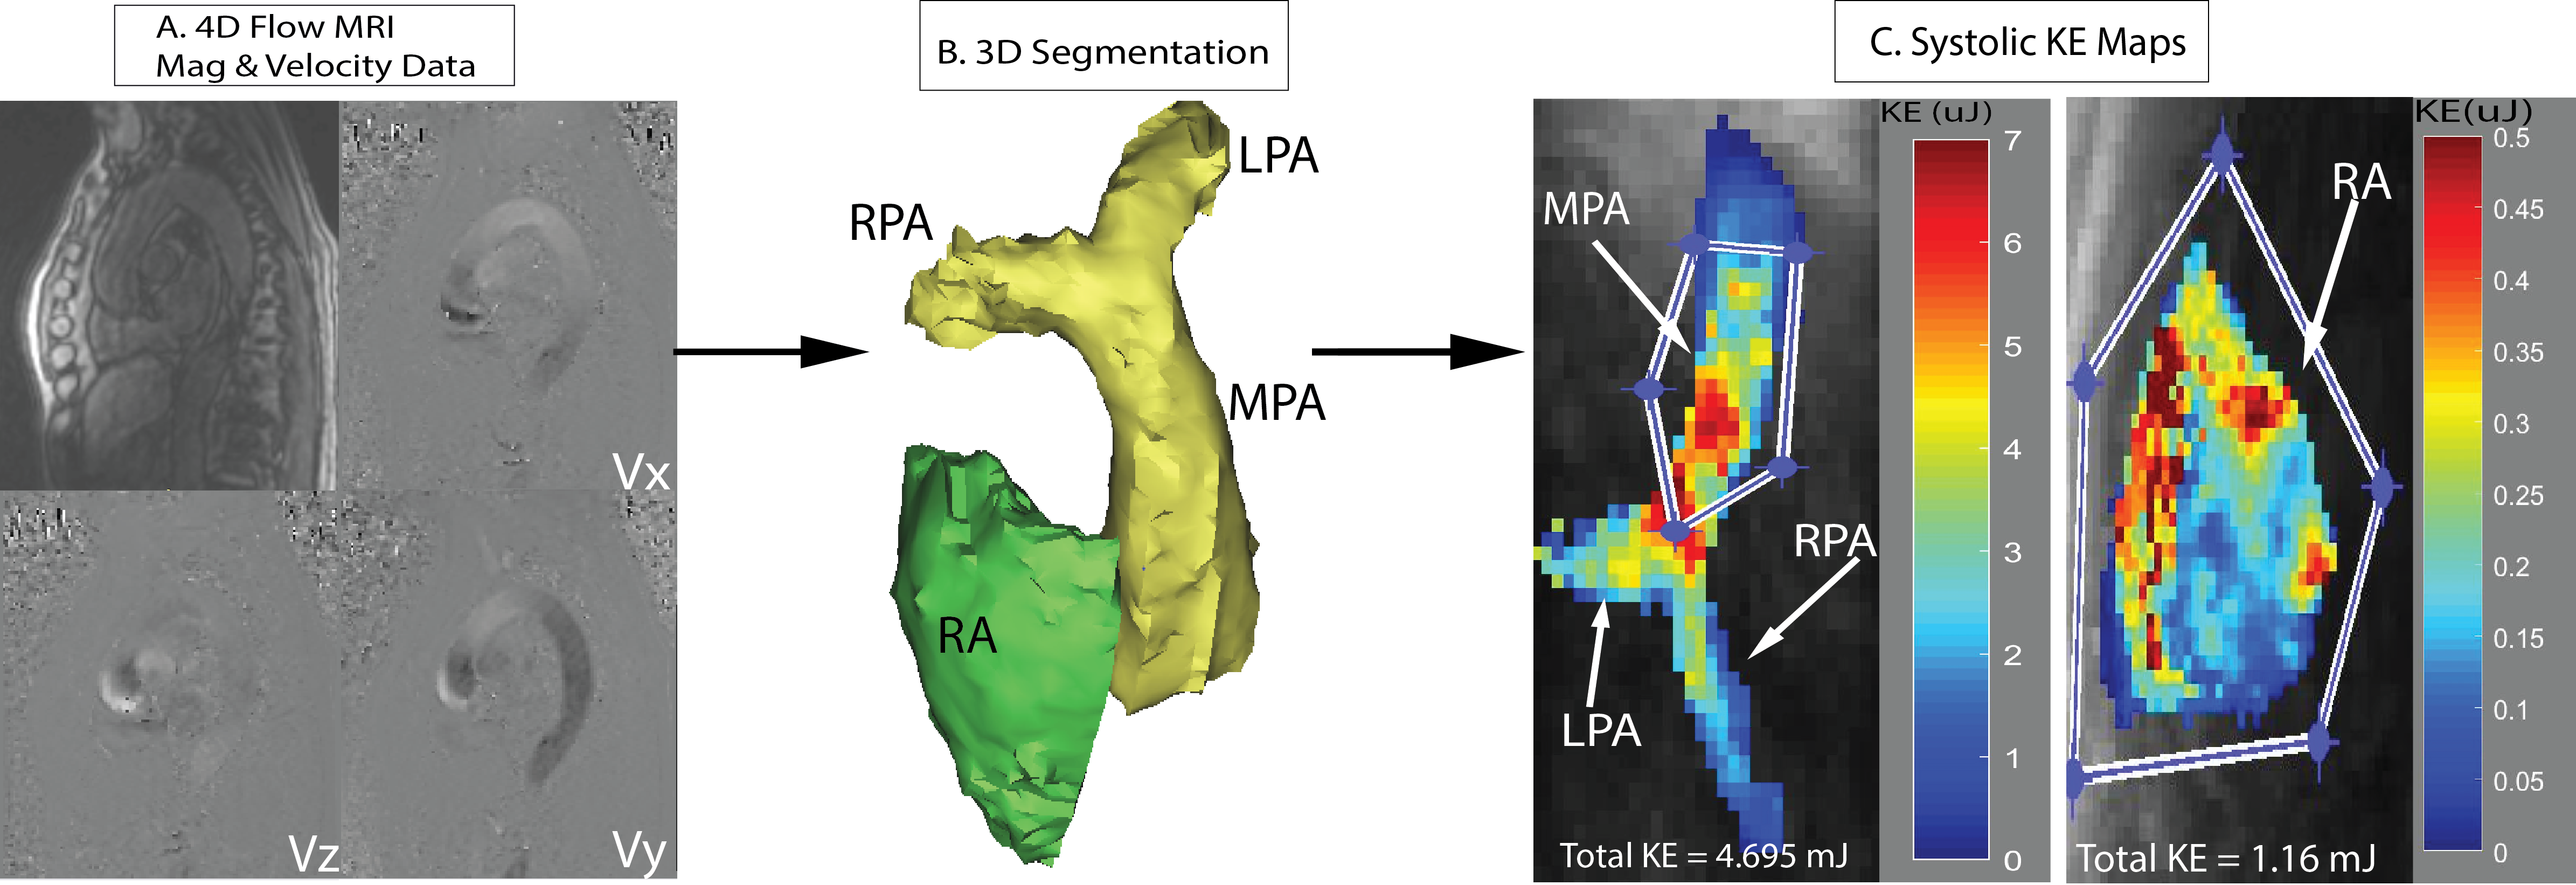
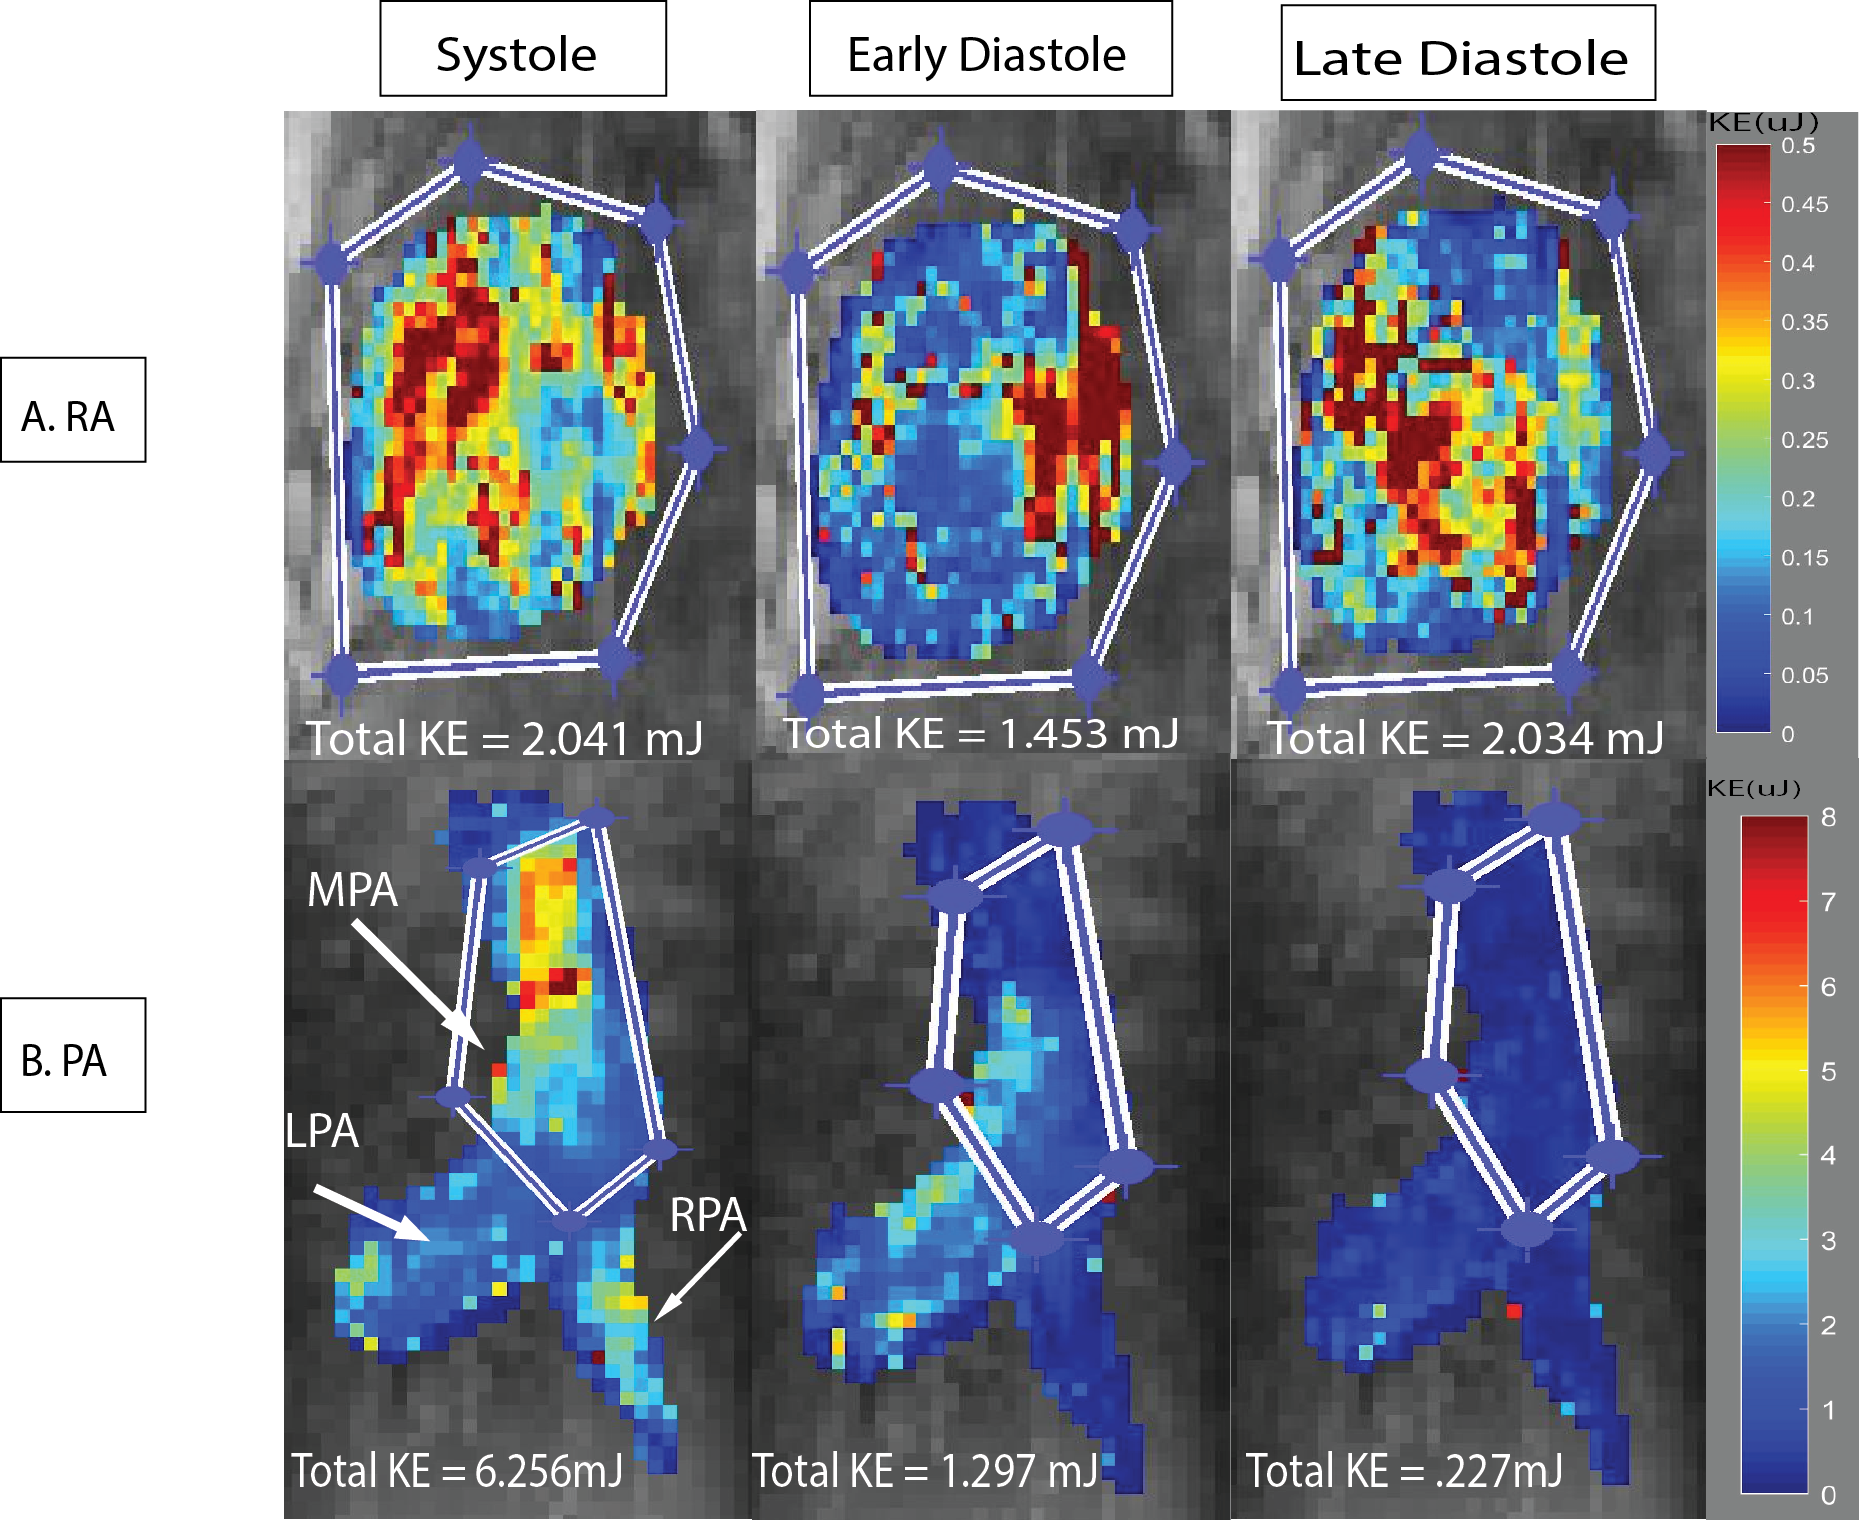
Measurements were performed in the multicenter MESA COPD Study, a nested case-control study of older smokers with COPD and controls. ECG and respiratory navigation gated 4D-flow MRI exams were performed in 56 patients with suspected COPD across three different sites (UCLA Medical Center, John Hopkins Hospital, and Northwestern Memorial Hospital). Pulse sequence parameters were: spatial resolution=2.1-2.4mm x 2.1-2.6mm x 3.1-3.4mm, temporal resolution=40.0–41.6ms, venc=80cm/s. Each subject was assessed into one of four categories: healthy control, severe COPD, moderate COPD, and mild COPD as defined by the GOLD criteria5. The 4D-flow data analysis workflow is illustrated in Figure 1 and included 1) corrections for velocity aliasing, Maxwell terms, and eddy currents; 2) 3D segmentation of the pulmonary artery (PA) and right atrium (RA) from 3D-PC angiograms using commercial software (Mimics, Materialise, Belgium); and 3) calculation of KE maps from the segmented RA and PA and 4D-flow data. For each voxel in the MPA and RA, KE was calculated through the equation KE=(1/2)mv2, where mass (m) is determined by the voxel volume multiplied by the density of blood (1.05g/mL) and absolute velocity (v) from the 4D-flow data. PA and RA maps for 3 select cardiac time frames (systole, early and late diastole) were generated by projecting the mean KE on a 2D plane transecting the PA and RA, respectively (Figure 1C). Region of interests were manually drawn to distinguish the main pulmonary artery (MPA) from the PA branches (Figures 1C and 2B). Total KE was defined as the sum over all voxels in RA and MPA and used to calculate average (mean over all cardiac time frames), overall (sum over all cardiac time frames), and peak systolic KE.Results:
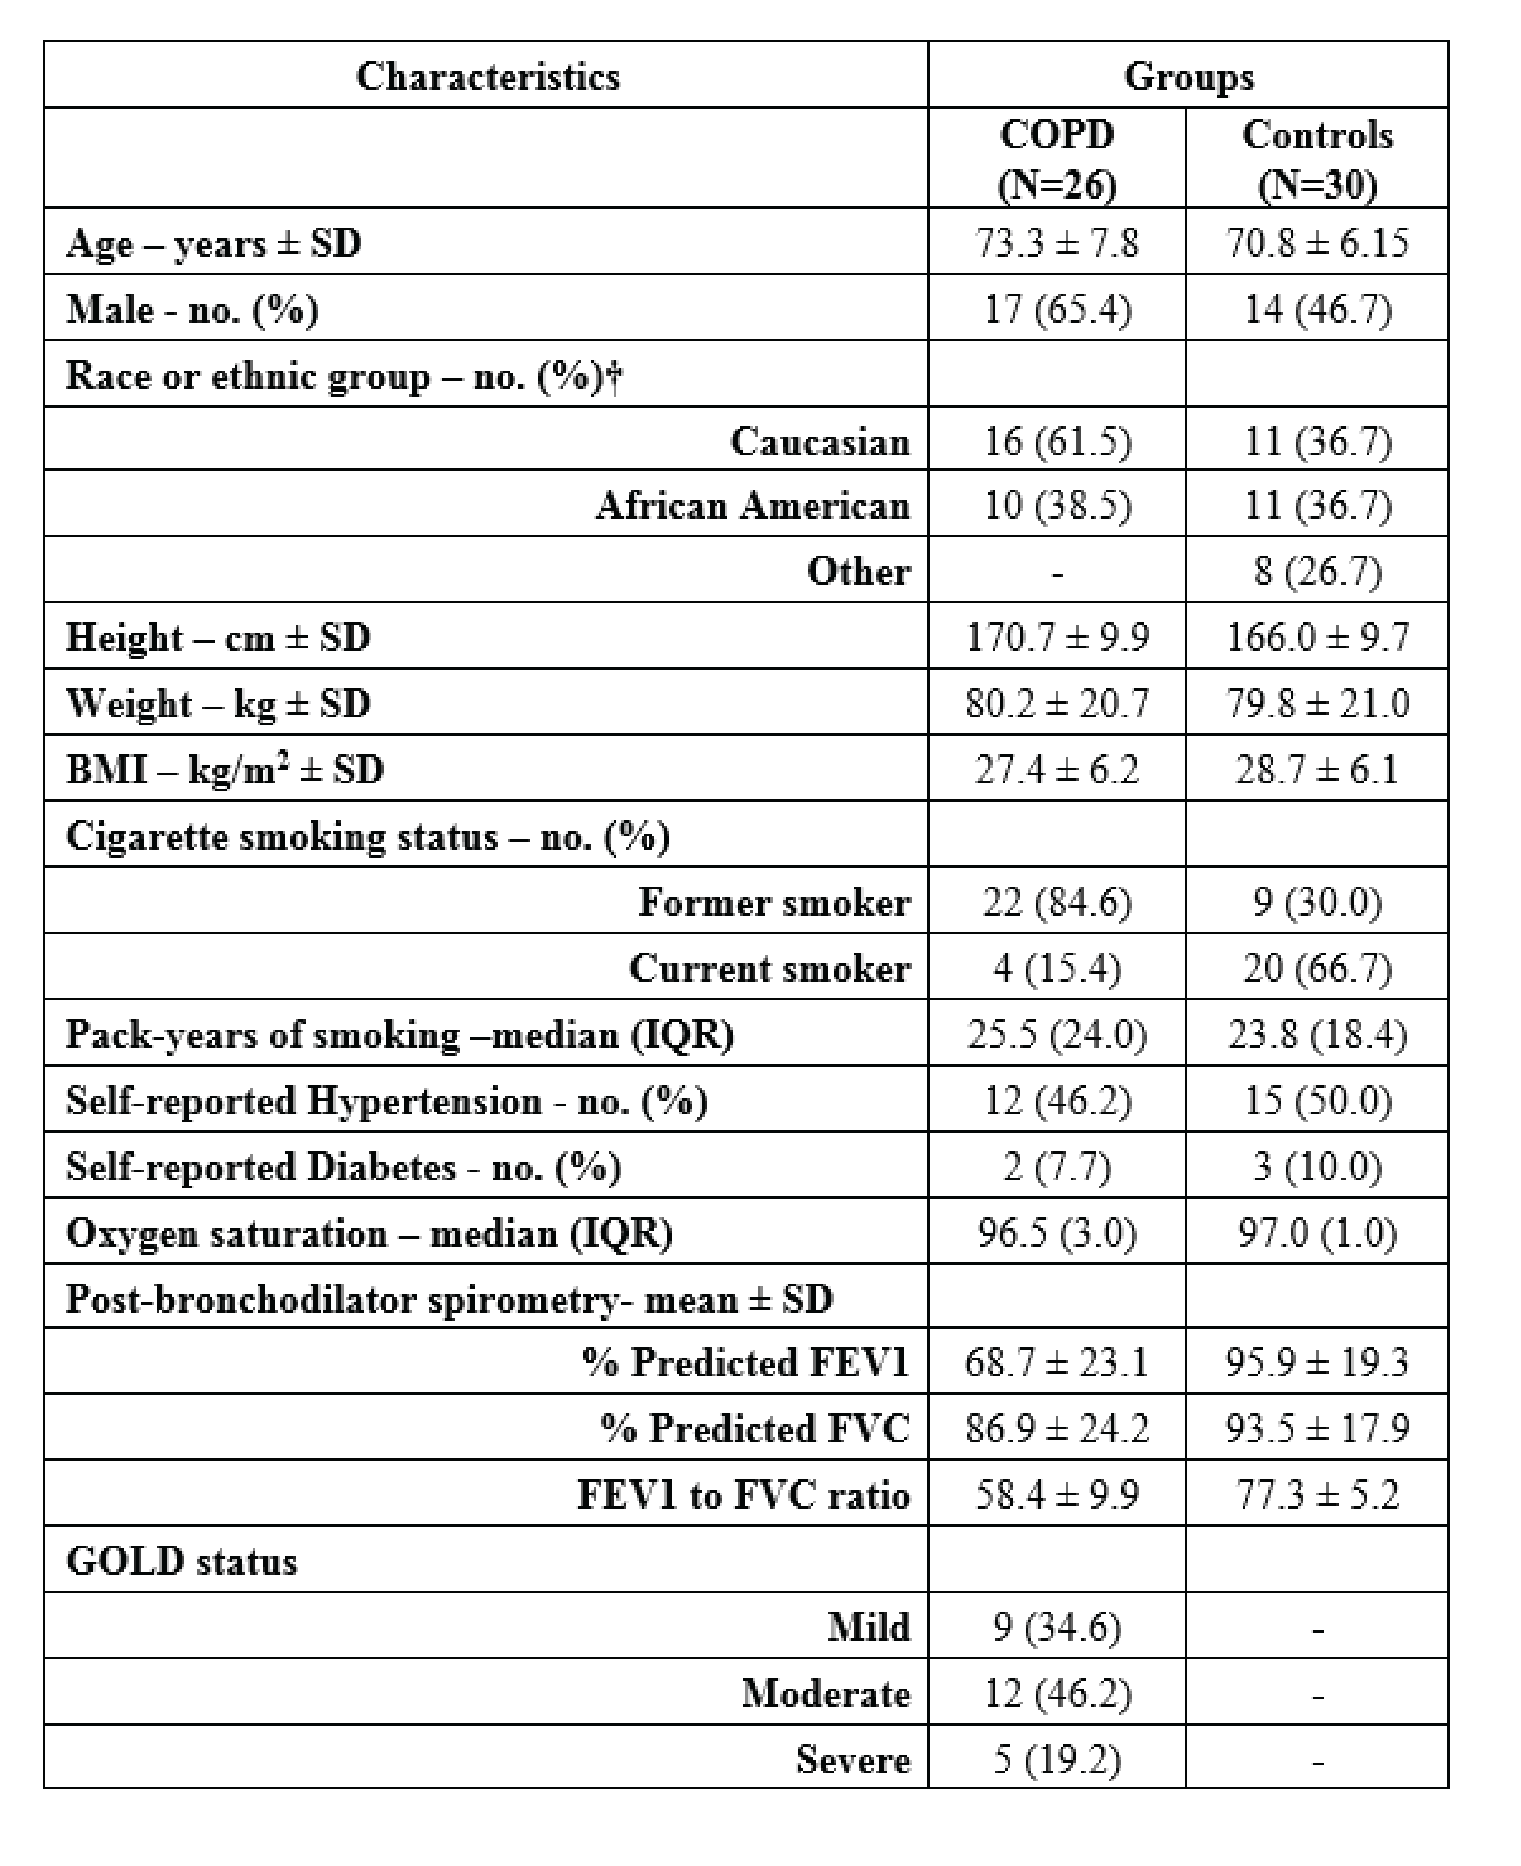
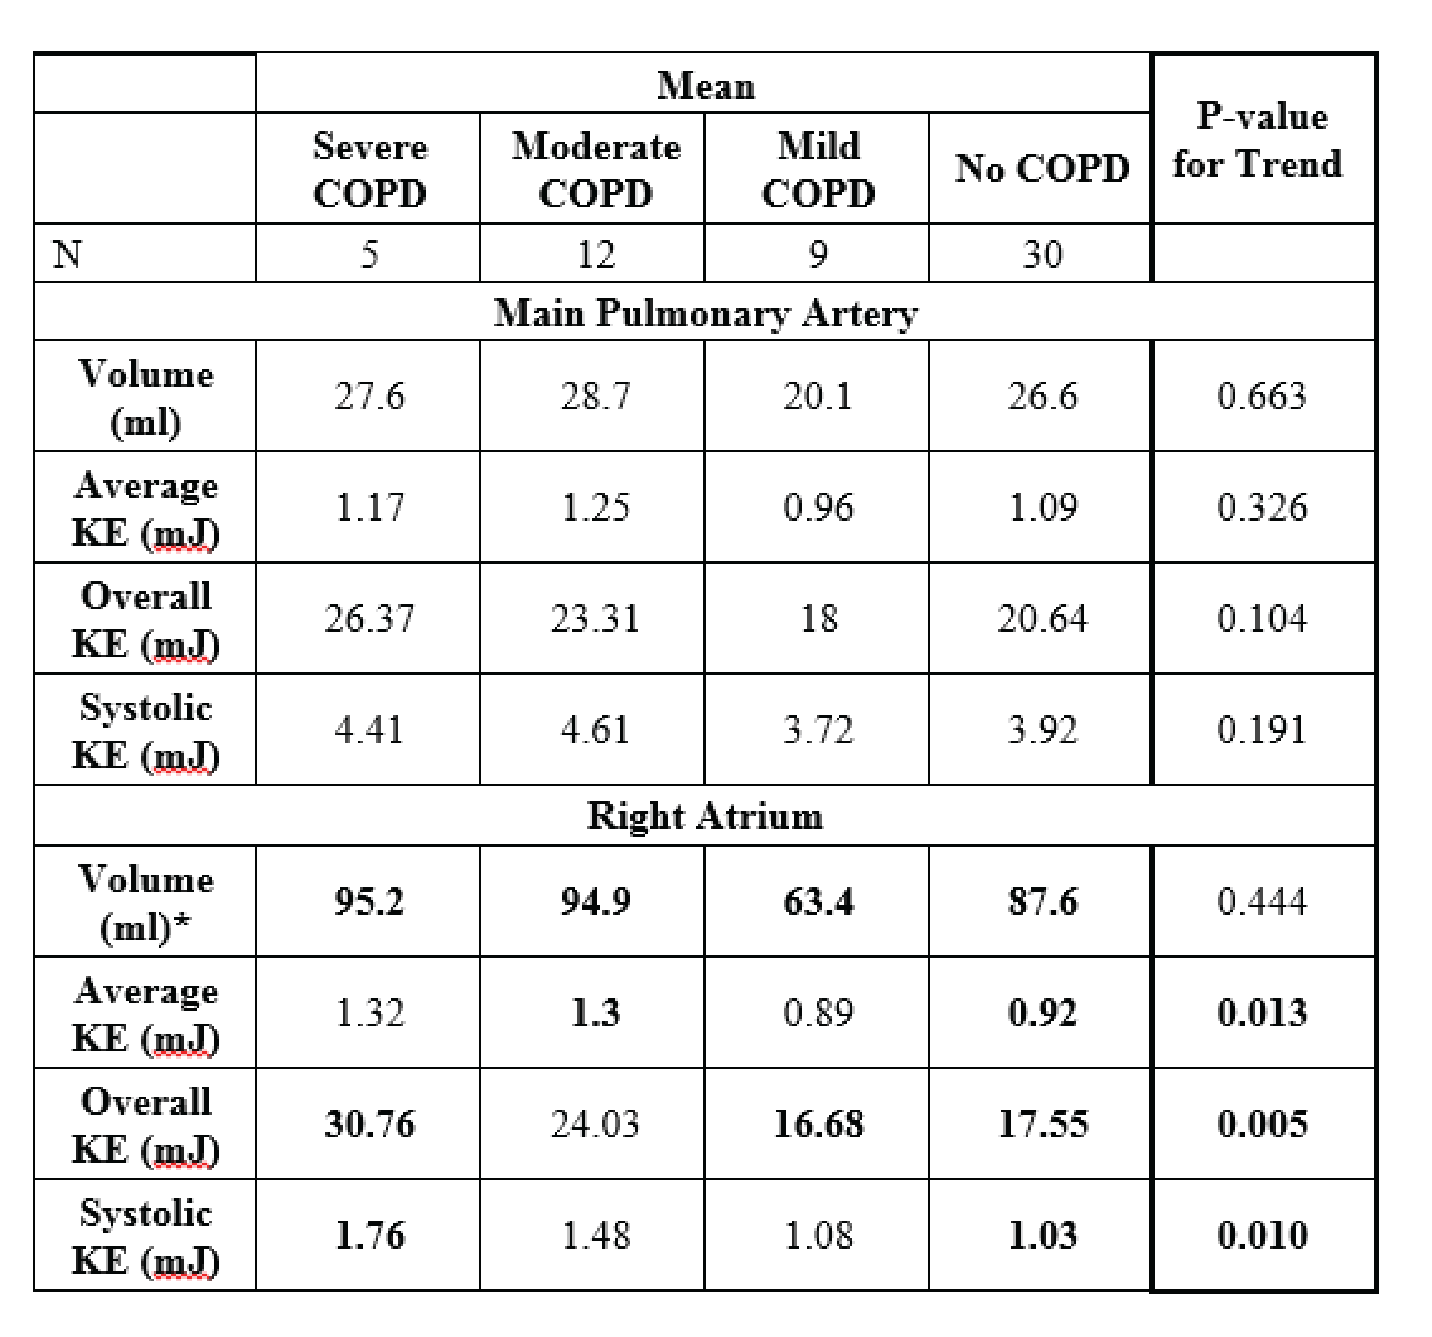
Patient demographics are summarized in Table 1. 26 patients (46%) had COPD (9 mild COPD, 12 moderate COPD, 5 severe COPD) and 30 subjects (54%) were classified as healthy age matched smokers without clinical lung disease. Examples of KE maps of the PA and RA are shown in Figure 2 and illustrate marked pulsatile changes of KE for the PA (high systolic KE compared to reduced diastolic KE). In contrast, less pulsatile flow in the RA resulted in overall lower KE values but more consistent KE across the cardiac cycle. As summarized in Table 2, there was a significant increase in average, overall, and systolic KE in the right atrium across increasing categories of COPD severity (p-trend = 0.023, 0.005, 0.017), which was maintained after adjustments for age, height, weight, and gender (p-trend = 0.012, 0.005, 0.009). Differences were most pronounced for overall KE for severe COPD compared to controls (30.8 mJ vs. 17.6mJ; P=0.009). No differences between subject groups were found for kinetic energy in the MPA (Table 2).Discussion:
Right-sided 4D flow MRI maybe a promising tool for the detection of hemodynamic disruptions associated with COPD induced changes in lung function. The observed increase in right atrial kinetic energy in patients with COPD may indicate a compensatory mechanism for pulmonary vasoconstriction by increasing venous return flow (and thus KE) to the RA. A limitation of this study is the small cohort size. Nonetheless, this is among the first studies to investigate changes in right-sided hemodynamics related to COPD.Acknowledgements
Funding: NIH R01HL093081, R01HL077612
References
1Adeloye D, Chua S, Lee C, et al. Global and regional estimates of COPD prevalence: Systematic review and meta–analysis. Journal of Global Health. 2015;5(2):020415.
2GBD 2015 Chronic Respiratory Disease Collaborators. Global, regional, and national deaths, prevalence, disability adjusted life years, and years lived with disability for chronic obstructive pulmonary disease and asthma, 1990-2015: a systematic analysis for the Global Burden of Disease Study 2015. Lancet Respir Med. 2017; 5:691.
3Sommer N, Dietrich A, Schermuly R.T., Ghofranu H.A., Guderman T, Schulz R, Seeger W, Grimminger F, Weissmann N. Regulation of hypoxic pulmonary vasoconstriction: basic mechanisms. European Respiratory Journal. 2008; 32(6): 1639-1651.
4Sakao S, Voelkel N, Tatsumi K. The vascular bed in COPD: pulmonary hypertension and pulmonary vascular alterations. European Respiratory Review. 2014; 23: 350-355.
5Rabe KF, Hurd S, Anzueto A, Barnes PJ, Buist
SA, Calverley P, Fukuchi Y, Jenkins C, Rodriguez-Roisin R, van Weel C,
Zielinski J and Global Initiative for Chronic Obstructive Lung D. Global
strategy for the diagnosis, management, and prevention of chronic obstructive
pulmonary disease: GOLD executive summary. Am
J Respir Crit Care Med. 2007;176:532-55.
Figures