1079
Imaging-Based Spirometry in Chronic Obstructive Pulmonary Disease (COPD) Patients using Phase Resolved Functional Lung Imaging (PREFUL)1Institute of Diagnostic and Interventional Radiology, Hannover Medical School, Hanover, Germany, 2Biomedical Research in Endstage and Obstructive Lung Disease Hannover (BREATH), German Center for Lung Research (DZL), Hanover, Germany, 3Clinical Airway Research, Fraunhofer Institute of Toxicology and Experimental Medicine, Hanover, Germany
Synopsis
Recently, an alternative proton lung MRI Fourier Decomposition (FD) method for phase resolved functional lung imaging (PREFUL) was proposed. Using a sine model, respiratory and cardiac cycles with increased temporal resolution are obtained, enabling the assessment of dynamic parameters. Similar to flow-volume loops in spirometry, the regional ventilation can be quantified in terms of fractional ventilation (FV) loops. In this study the FV loops of six healthy volunteers and 16 chronic obstructive pulmonary disease patients are evaluated. As a metric the cross-correlation to a healthy reference is used. The results suggest potential benefits for early detection or treatment monitoring.
Introduction
Currently the assessment of flow-volume curves during forced maneuvers, as part of the lung function test, is daily clinical routine. Using grid-tagging MRI and velocimetry algorithms, the feasibility of imaging-based spirometry was demonstrated1. Being a signal-based method, Fourier Decomposition (FD) lung MRI is an alternative to this motion tracking approach2. Fast acquisition strategies3, self-gating4 and a post-processing method5 were proposed to increase temporal resolution, thus enabling the assessment of new dynamic (e.g. phase) parameters. While most FD studies were concerned with dynamic perfusion information3,6, it was also proposed to apply the flow-volume loop concept to the fractional ventilation to assess regional ventilation in terms of fractional ventilation (FV) loops5. The initial results in a single chronic obstructive pulmonary disease (COPD) patient showed promising sensitivity even during normal tidal breathing. In this study, a method for extended FV loop analysis is presented and applied in a COPD patient cohort.Methods
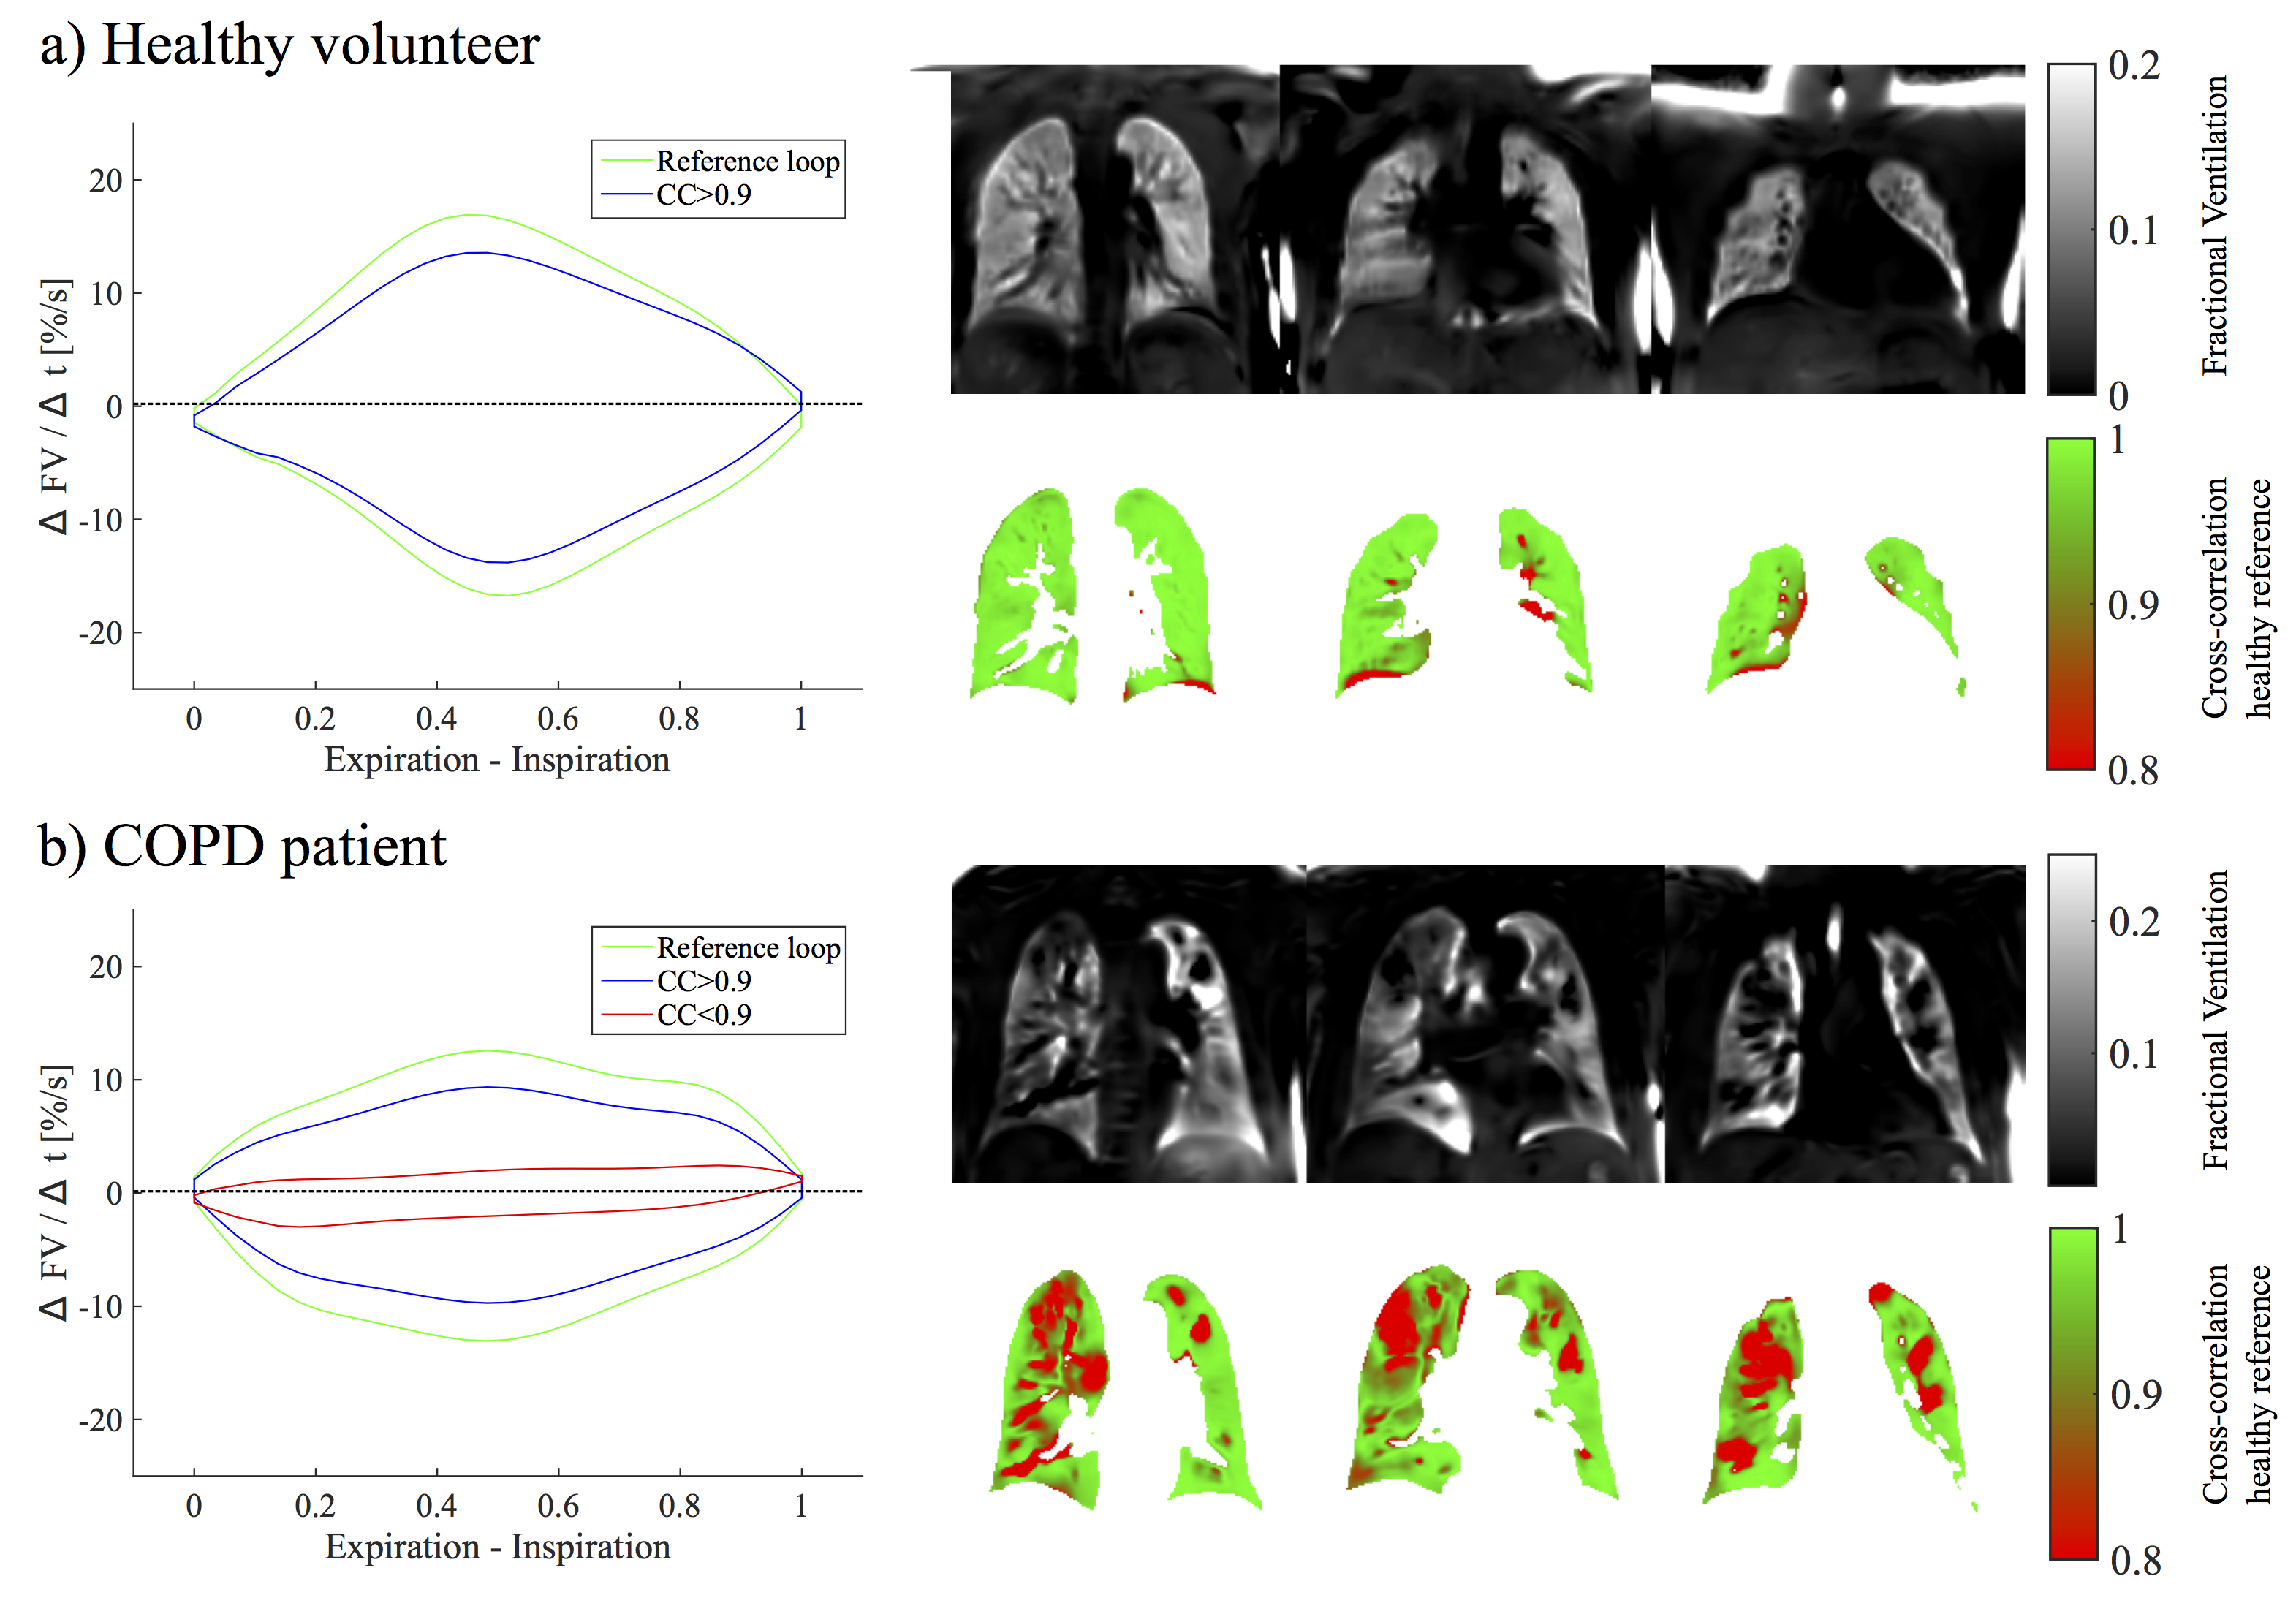
The study was approved by the institutional ethical review board and all subjects gave written informed consent. Six healthy volunteers (age 25-51, three females) and 16 patients with COPD (age 47-76, five females, median FEV1%pred 52%) underwent 1.5T MRI. For FD MRI three coronal slices were acquired in free breathing using a spoiled gradient sequence with TE 0.82 ms, TR 3 ms, FA 5°, matrix 128 x 128, field of view 50 x 50 cm, slice thickness 15 mm, 1500 bandwidth / pixel, GRAPPA with an acceleration factor of 2 and a temporal resolution of 220 ms. After a non-rigid registration7, the acquisitions were sorted according to their phase to create one respiration cycle St as previously described5. The static FV and FVt time series were calculated using the following equations8:
$$$FV_t=\frac{S_{Exp}-S_{t}}{S_{Exp}} \textrm{ ; } FV=\frac{S_{Exp}-S_{Insp}}{S_{Exp}}$$$
The FVt slope was calculated for each voxel in the lung parenchyma by symmetric difference quotient (1st derivative). Regions with high FV values (80-90% quantile) were used to define an averaged healthy reference FVt slope. The similarity of slopes to each other and the reference slope was assessed by cross-correlation (CC) analysis. For statistical analysis the mean parenchymal FV and reference slope CC were derived. Additionally, all patients underwent a lung function test including the measurement of the following predicted % parameters: forced expiratory volume in 1 s (FEV1%pred), ratio of FEV1 to the forced vital capacity (FEV1/FVC%pred) and forced expiratory flow from 25% to 75% of vital capacity (FEV25-75%pred). The parameter correlation was assessed using Pearson’s correlation coefficient. Differences between healthy volunteers and patients were tested with Mann-Whitney U-test.
Results
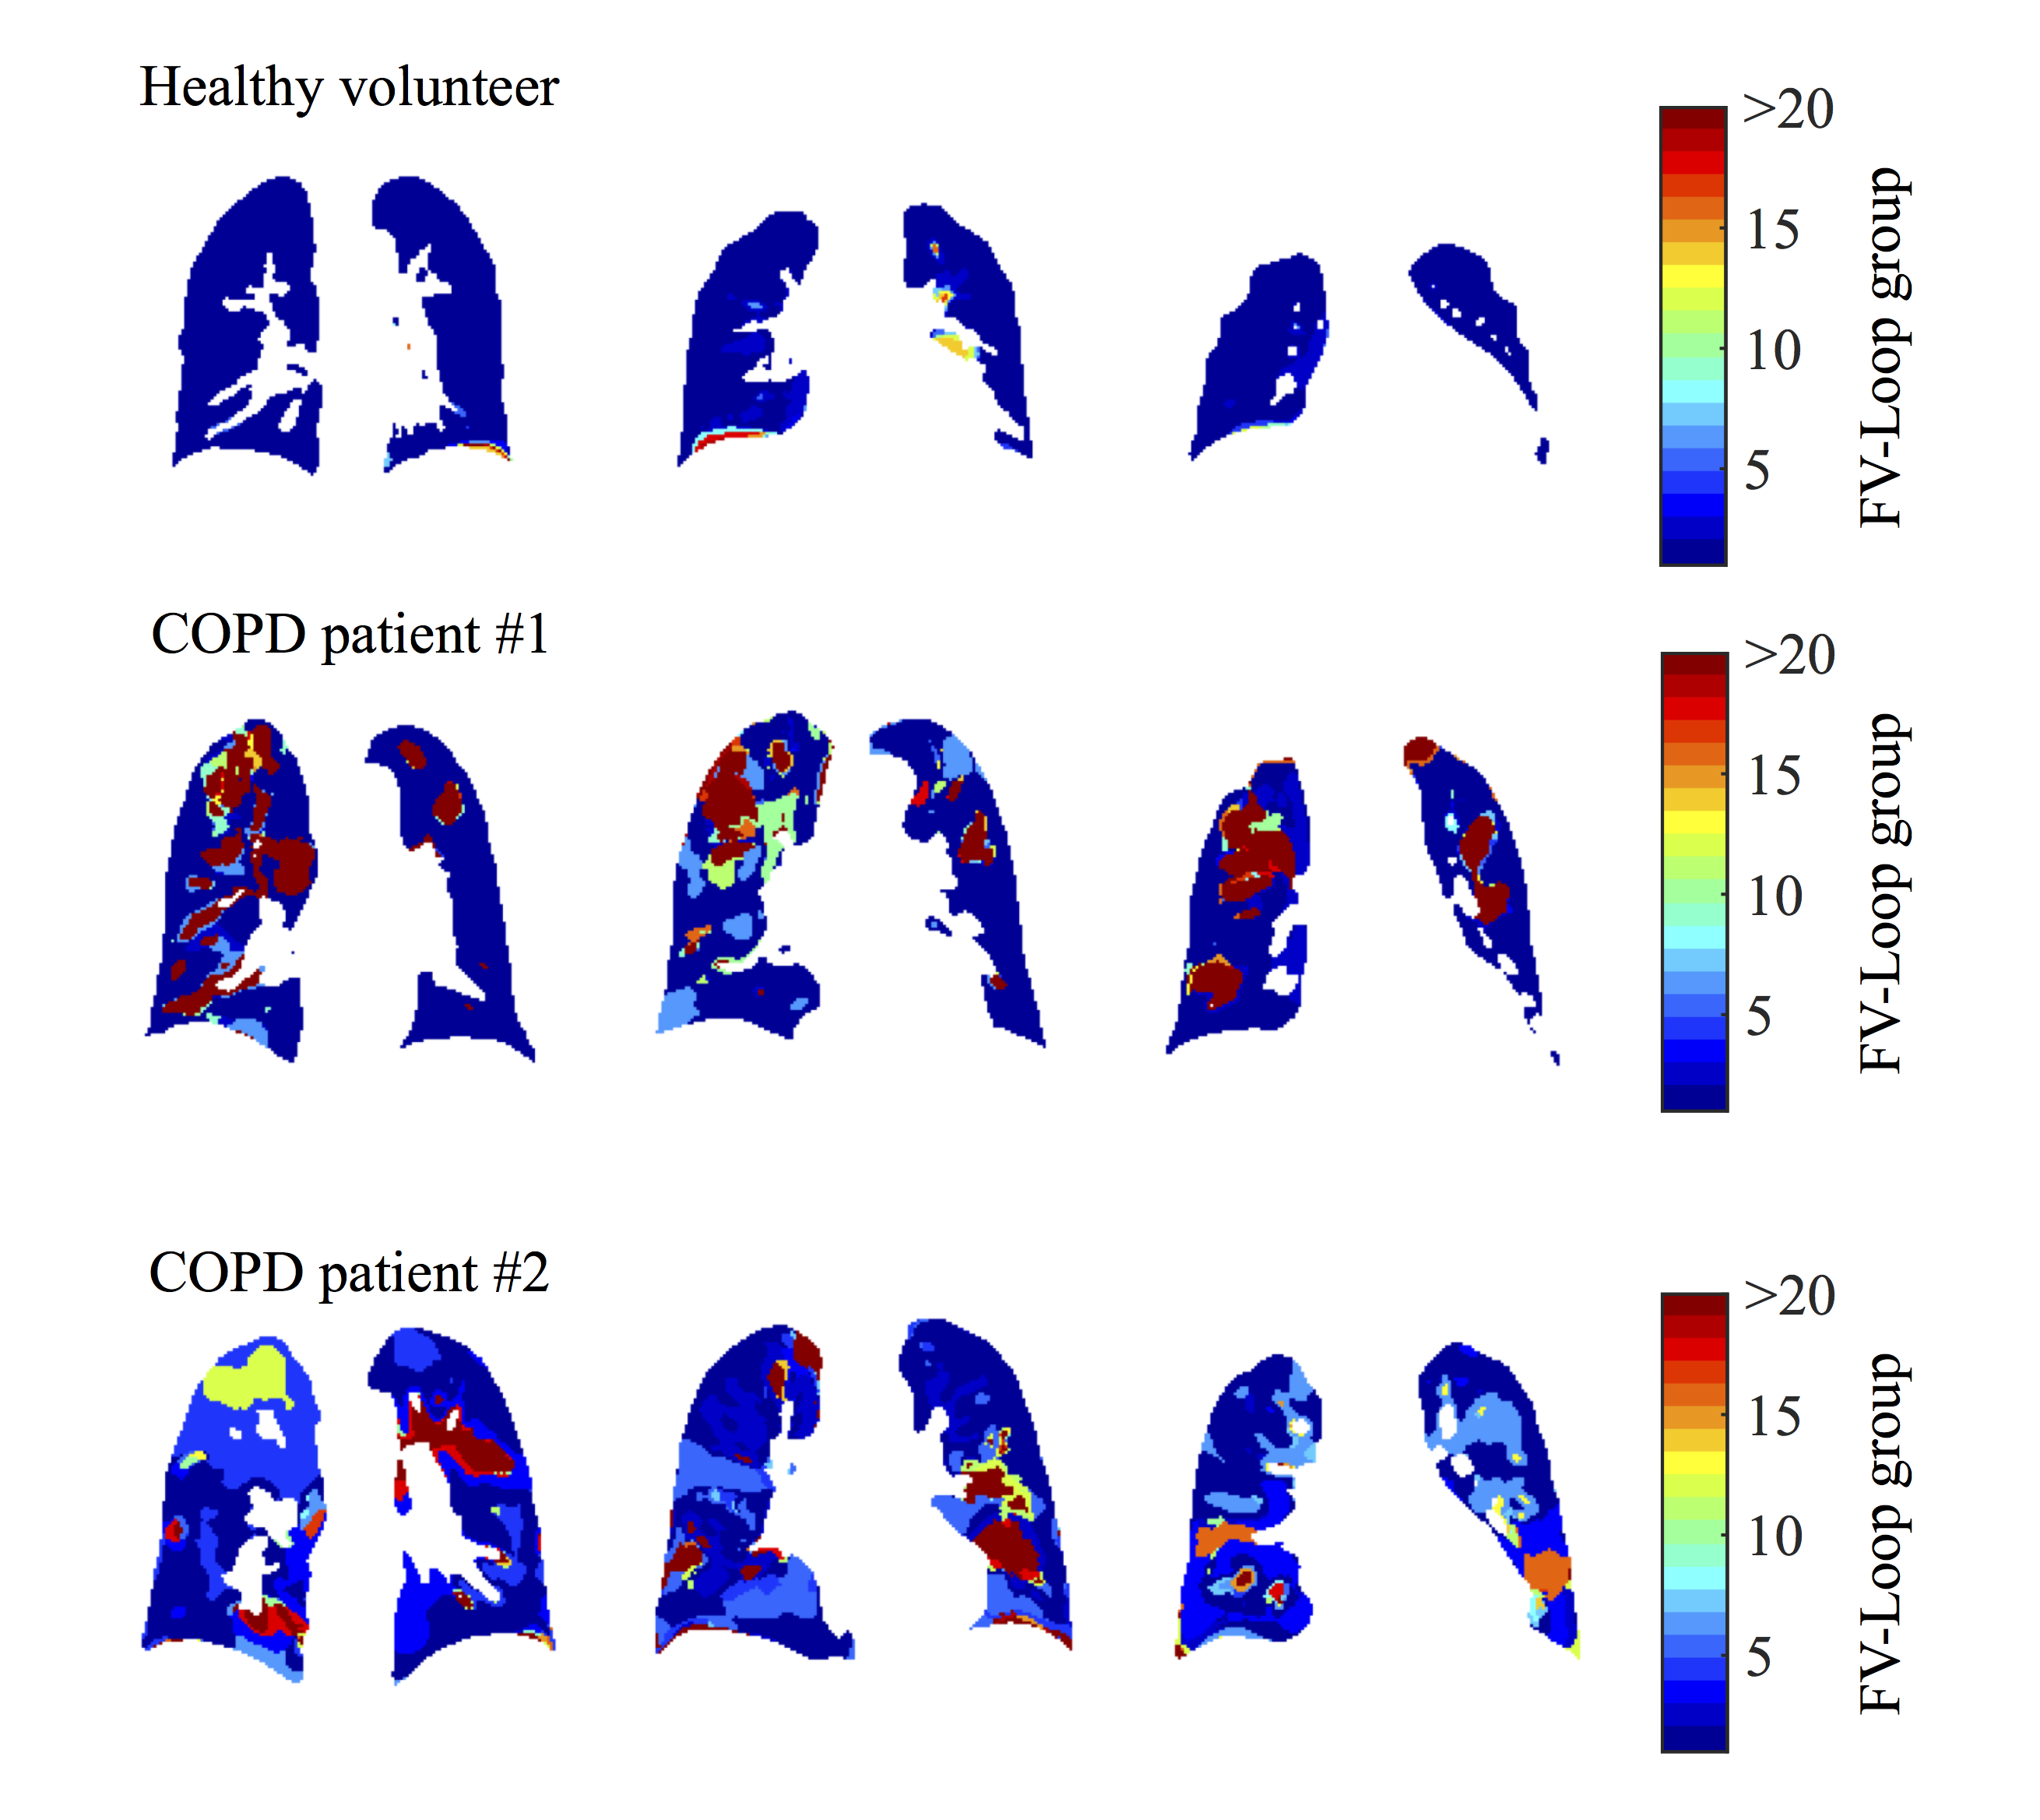
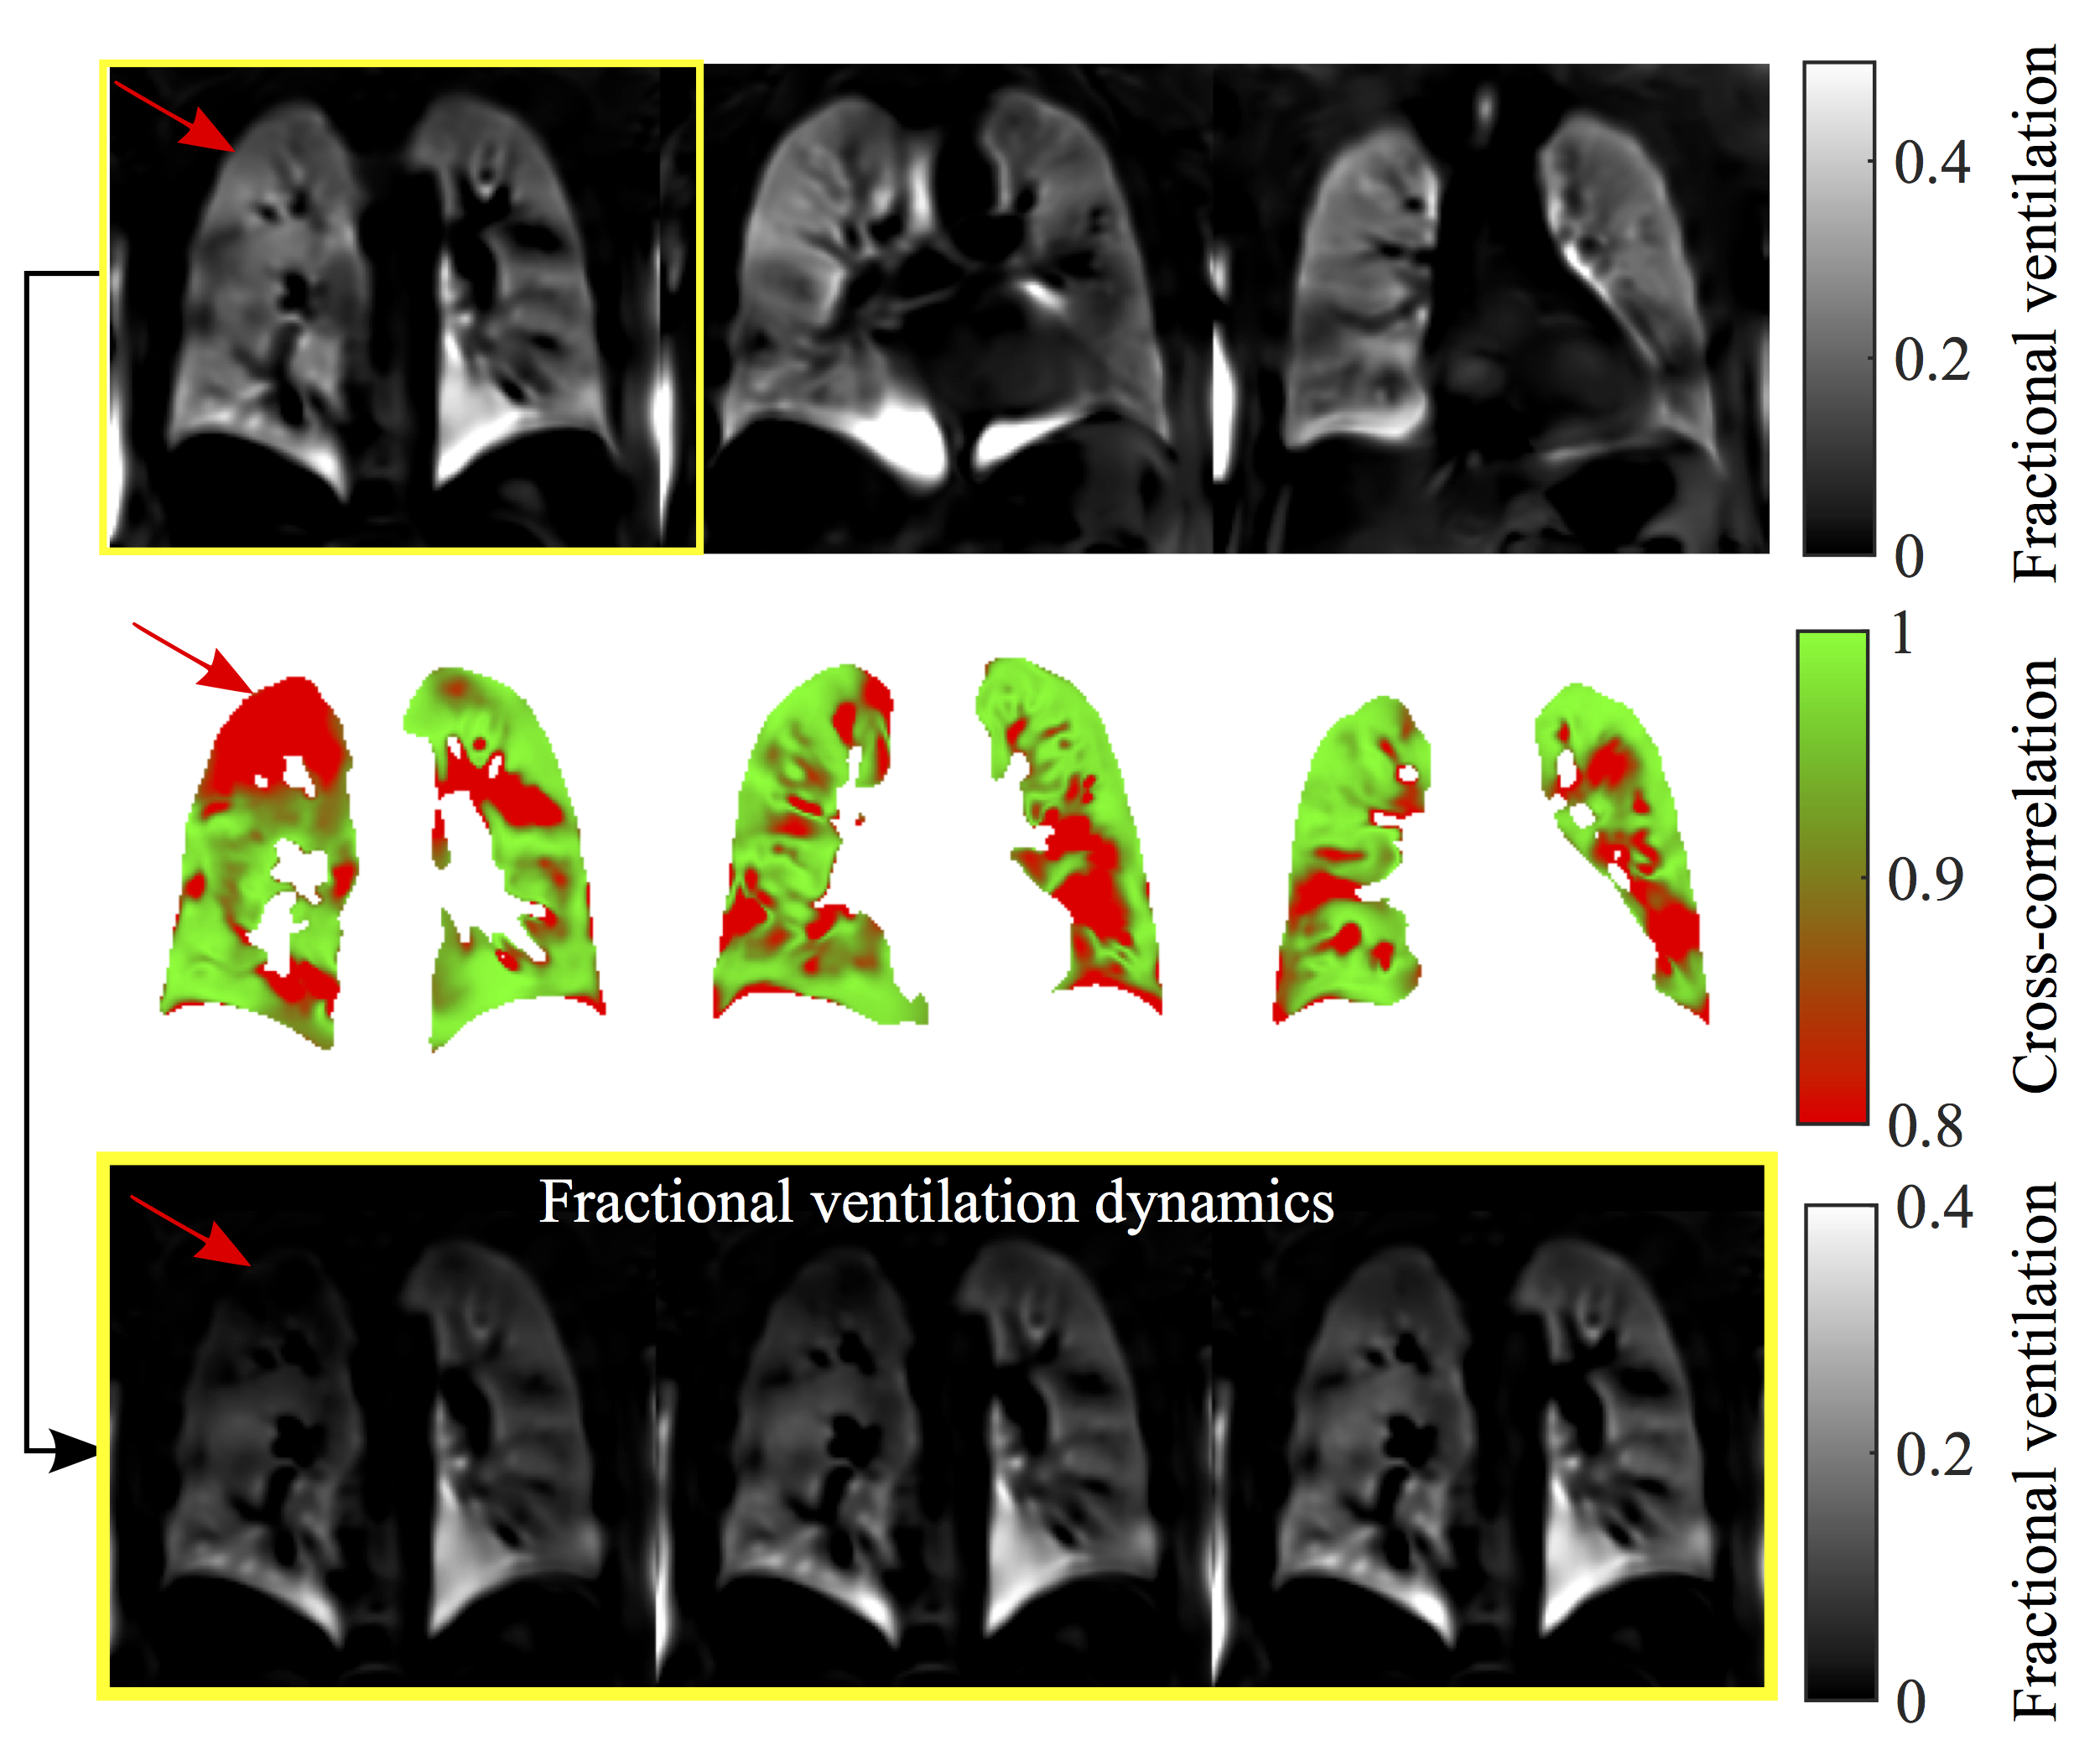
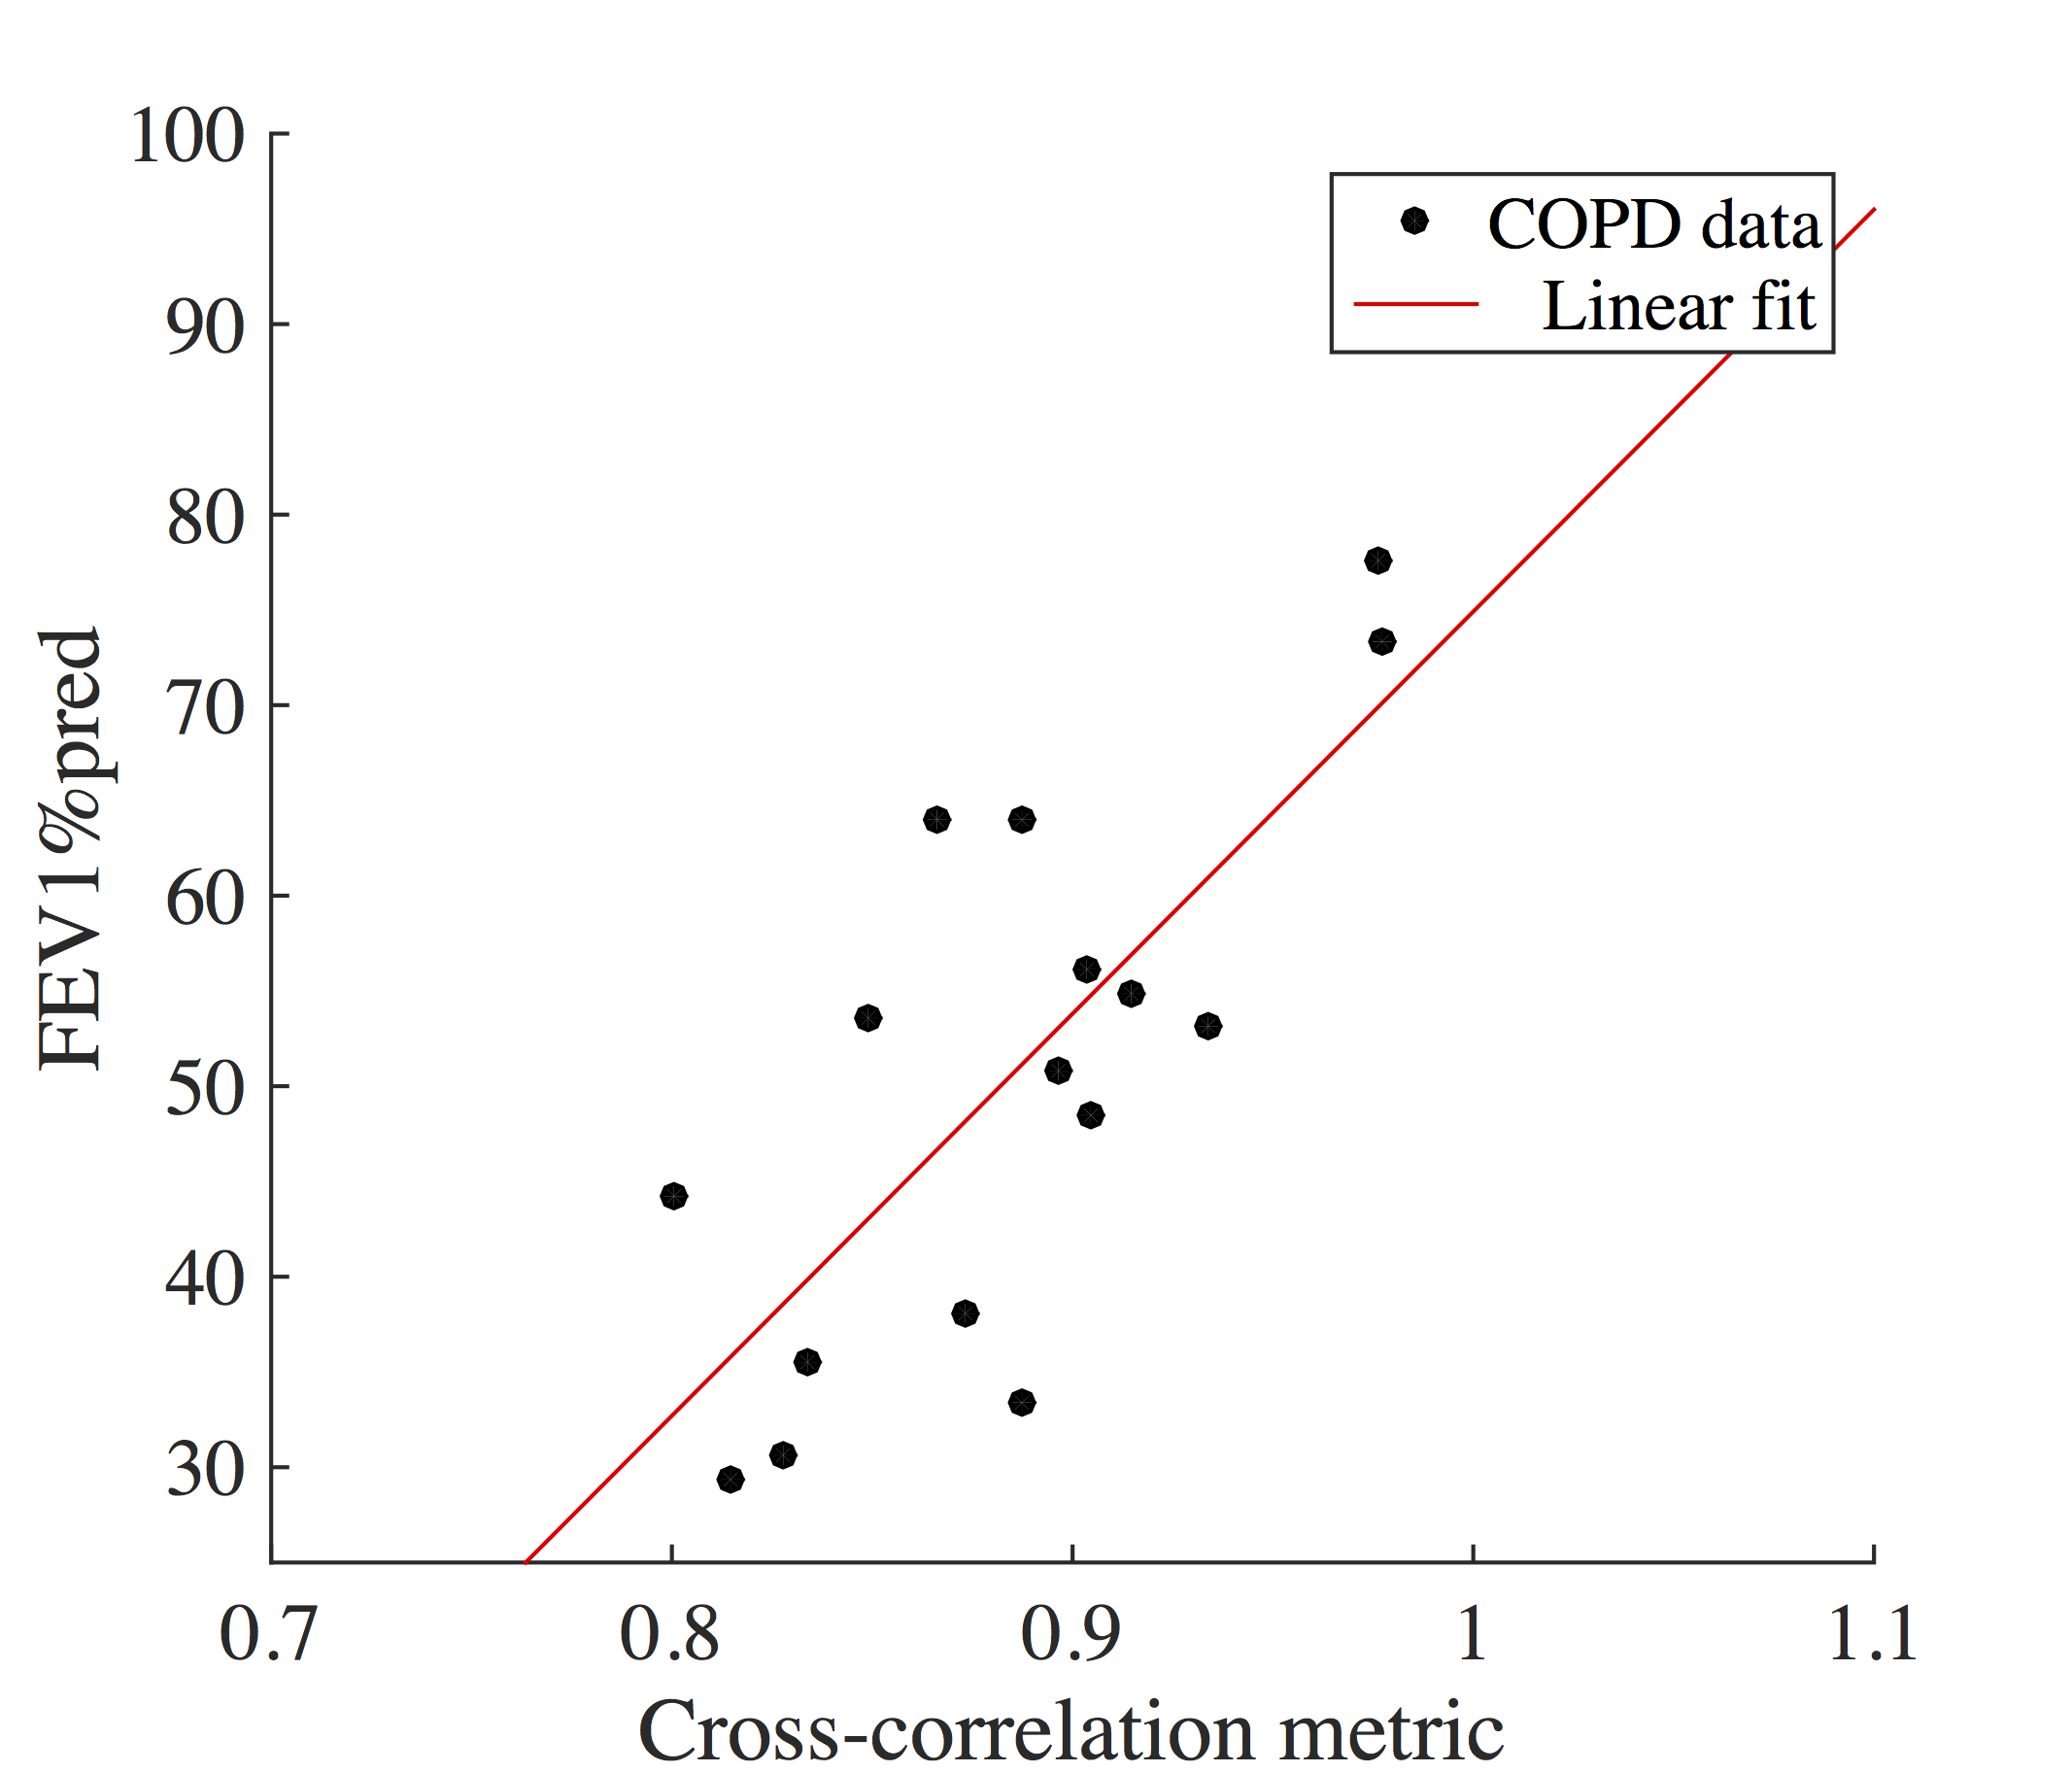
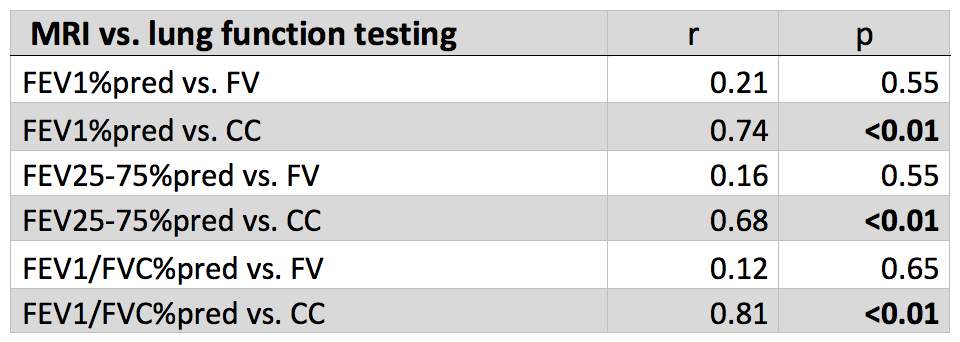
For the volunteers mostly one FV loop group was found (see figure 1). On the contrary, more groups were found for the COPD patients. In accordance, the healthy reference CC (see figure 2) was significantly increased for volunteers (median 97% vs. 88%, p=0.003). No significant differences were found for FV (median 12% vs. 11%, p=0.44). The median voxel-by-voxel correlation of FV and CC was 0.51 (healthy volunteers) and 0.64 (COPD). In figure 4 a COPD case with a prominent regional mismatch of FV and CC is presented. The same regions showed delayed ventilation on FVt. The correlation between MRI imaging and pulmonary function test (PFT) parameters is shown in table 1. CC correlated with all evaluated PFT parameters (FEV1/FVC%pred: r=0.81, FEV1%pred: r=0.74 (figure 4), FEV25-75%pred: r=0.68). No significant correlations were found for FV and PFT.Discussion
The results show a diversity of FV loop patterns in COPD patients, which can be quantified in relation to a healthy reference loop using a CC metric. Unlike FV, which considers only two time points (expiration and inspiration), this metric contains information of the whole respiration cycle and may be more sensitive to early changes, which are not visible on the FV map (see example in figure 4). In comparison with phase metrics, the CC metric offers the advantage of being insensitive to phase wrapping. Nevertheless, it is advised to include additional manual check using dynamic information FVt during healthy reference selection. A limitation of this study is the partial coverage of the lung parenchyma (3 slices). Also no age matching was performed, therefore, significant differences between healthy volunteers and COPD patients cannot be ascribed to COPD only. Furthermore, the CC metric is an abstract quantity. This issue might be addressed by further analysis of loop shape and comparison with computed tomography.Conclusion
This study shows a novel method of imaging-based spirometry using conventional FD acquisition, which shows a good concordance with PFT in a COPD cohort and might offer added value in early detection or patient monitoring.Acknowledgements
This work was supported by a grant from the German Federal Ministry of Education and Research (IFB-Tx, reference number: 01EO1302) and the German Center for Lung Research (DZL).References
1. Voorhees A, An J, Berger KI, Goldring RM, Chen Q. Magnetic resonance imaging-based spirometry for regional assessment of pulmonary function. Magn Reson Med 2005;54(5):1146-1154.
2. Bauman G, Puderbach M, Deimling M, Jellus V, Chefd'hotel C, Dinkel J, Hintze C, Kauczor HU, Schad LR. Non-contrast-enhanced perfusion and ventilation assessment of the human lung by means of fourier decomposition in proton MRI. Magn Reson Med 2009;62(3):656-664.
3. Bauman G, Eichinger M, Uecker M. High temporal resolution radial bSSFP sequence with nonlinear inverse reconstruction for the measurement of the pulmonary blood inflow time using Fourier decomposition MRI. Proc Intl Soc Mag Reson Med 2012;20:1340.
4. Fischer A, Weick S, Ritter CO, Beer M, Wirth C, Hebestreit H, Jakob PM, Hahn D, Bley T, Köstler H. SElf-gated Non-Contrast-Enhanced FUnctional Lung imaging (SENCEFUL) using a quasi-random fast low-angle shot (FLASH) sequence and proton MRI. NMR in Biomedicine 2014;27(8):907-917.
5. Voskrebenzev A, Gutberlet M, Klimeš F, Kaireit TF, Schönfeld C, Rotärmel A, Wacker F, Vogel-Claussen J. Feasibility of quantitative regional ventilation and perfusion mapping with phase-resolved functional lung (PREFUL) MRI in healthy volunteers and COPD, CTEPH, and CF patients. Magn Reson Med;10.1002/mrm.26893:n/a-n/a.
6. Veldhoen S, Weng AM, Wirth C, Kunz AS, Knapp JN, Stäb D, Segerer F, Hebestreit HU, Bley TA, Köstler H. Pulmonary Phase Imaging using Self-Gated Fourier Decomposition MRI in Patients with Cystic Fibrosis. Proc Intl Soc Mag Reson Med 2016;24:1144.
7. Avants BB, Tustison NJ, Song G, Cook PA, Klein A, Gee JC. A reproducible evaluation of ANTs similarity metric performance in brain image registration. Neuroimage 2011;54(3):2033-2044.
8. Zapke M, Topf H-G, Zenker M, Kuth R, Deimling M, Kreisler P, Rauh M, Chefd'hotel C, Geiger B, Rupprecht T. Magnetic resonance lung function - a breakthrough for lung imaging and functional assessment? A phantom study and clinical trial. Respir Res 2006;7(1):106.
Figures