1077
Motion-resolved UTE based Pulmonary Quantitative Susceptibility Mapping1Bioengineering, UCSF&UC Berkeley, San Francisco, CA, United States, 2Department of Radiology and Biomedical Imaging, UCSF, San Francisco, CA, United States, 3Department of Electrical Engineering and Computer Sciences, UC Berkeley, Berkeley, CA, United States, 4Department of Medical Physics, University of Wisconsin, Madison, Madison, WI, United States, 5Department of Radiology, University of Wisconsin, Madison, Madison, WI, United States, 6Heartvista Inc., Los Altos, CA, United States, 7Department of Radiology, Stanford University, Stanford, CA, United States
Synopsis
Pulmonary MRI is challenging due to many factors, such as short T2* relaxation time and respiratory motion corruption. However, the large susceptibility differences in the lungs from blood oxygenation and O2 content might provide more information related to pulmonary function. In this work, we combined ultra-short TE(UTE) acquisition, quantitative susceptibility mapping(QSM), and motion-resolved reconstruction techniques together to look at the susceptibility contrast in the lung and changes in different motion states. According to the results, this technique provides extra contrast information compared to traditional intensity images, and shows susceptibility changing of lung in different respiration states.
Introduction
Pulmonary MRI is challenging due to many factors, such as short T2* relaxation time and respiratory motion corruption. The short T2* relaxation time is mainly caused by large field inhomogeneity due to large susceptibility difference between diamagnetic pulmonary parenchyma and paramagnetic air in the alveoli and bronchi[1]. Recently, researchers used ultra-short TE (UTE) sequence to overcome the fast signal decay effects in pulmonary MRI[2]. The phase from these images includes both local and non-local susceptibility effects. Quantitative Susceptibility Mapping (QSM) utilizes the phase information to compute the exact local susceptibility distribution following the non-local source-to-field relationship[3]. Recently, researchers have used multi-echo radial MRI and applied QSM on the mouse lung and they showed the positive susceptibility in lung was sensitive to changes in lung O2 partial pressure[4]. Applying QSM to human pulmonary MRI with free breathing is more challenging because respiration during scan would cause motion artifacts and the large susceptibility range would lead to streaking artifacts in QSM images. In this work, we used a self-navigation based method to reduce the respiratory motion artifacts. A motion-resolved QSM (MQSM) to investigate local susceptibility changes during the respiration cycle. Our results showed that QSM could reflect the dynamic susceptibility changes at different respiration phases, which might provide a quantitative measurement of oxygenation and pulmonary function.Methods
Acquisition
Data was from cystic fibrosis (CF) patients scans (n=2) using 3D UTE sequence with free-breathing and variable density radial readout acquisition[2]. The scan parameters were: FOV=32x32x32cm, flip angle=4°, 1.25mm isotropic resolution, effective TE=80μs, sampling bandwidth=125kHz.
Data Binning and Reconstruction
With 3D UTE acquisition, the repeatedly acquired center k-space was used for respiratory motion estimation[5]. Unlike traditional motion resolved methods, we binned data based on the respiratory phases instead of motion signal intensity, which is shown in Fig.2(A). After binning data to different respiratory phases, images were reconstructed with compressed sensing motion resolved reconstruction[6].
$$\underset{x}{\operatorname{argmin}} \sum_i^n{||P_iFSx_i-d_i||_2^2}+\lambda_{TV}TV(x_i)+\lambda_W||\Psi(x_i)||_1$$
$$$F$$$is Fourier transform. $$$P_i$$$is gridding and sampling operator. $$$\Psi$$$is wavelet transform. $$$TV$$$stands for total variation. $$$\lambda_{TV}$$$and$$$\lambda_W$$$are the penalty terms, $$$i$$$stands for specific motion state.
QSM reconstruction
After image reconstruction, the phase images were used for QSM calculation. In this study, wrapped phase was unwrapped using Laplacian-based phase unwrapping method and the background phase was then removed using the V-SHARP method[7]. Due to relative low SNR in pulmonary phase images with large susceptibility ranges, a compressed sensing based QSM algorithm called improved Compressed Sensing (iCS) was used in this work.
$$\underset{\chi}{\operatorname{argmin}} ||F^HWF(\exp(i\gamma B_0T_EF^HD_2F\chi)-\exp(i\phi))||_2^2+\lambda_{TV}TV(\chi)+\lambda_W||\Psi\chi||_1$$
$$$F$$$is Fourier transform. $$$W$$$is k-space weighting term. $$$D_2$$$is dipole kernel. $$$T_E$$$ is effective echo time. $$$\Psi$$$is wavelet transform. $$$TV$$$stands for total variation. $$$\lambda_{TV}$$$and$$$\lambda_W$$$are the penalty terms.
Results and Discussions
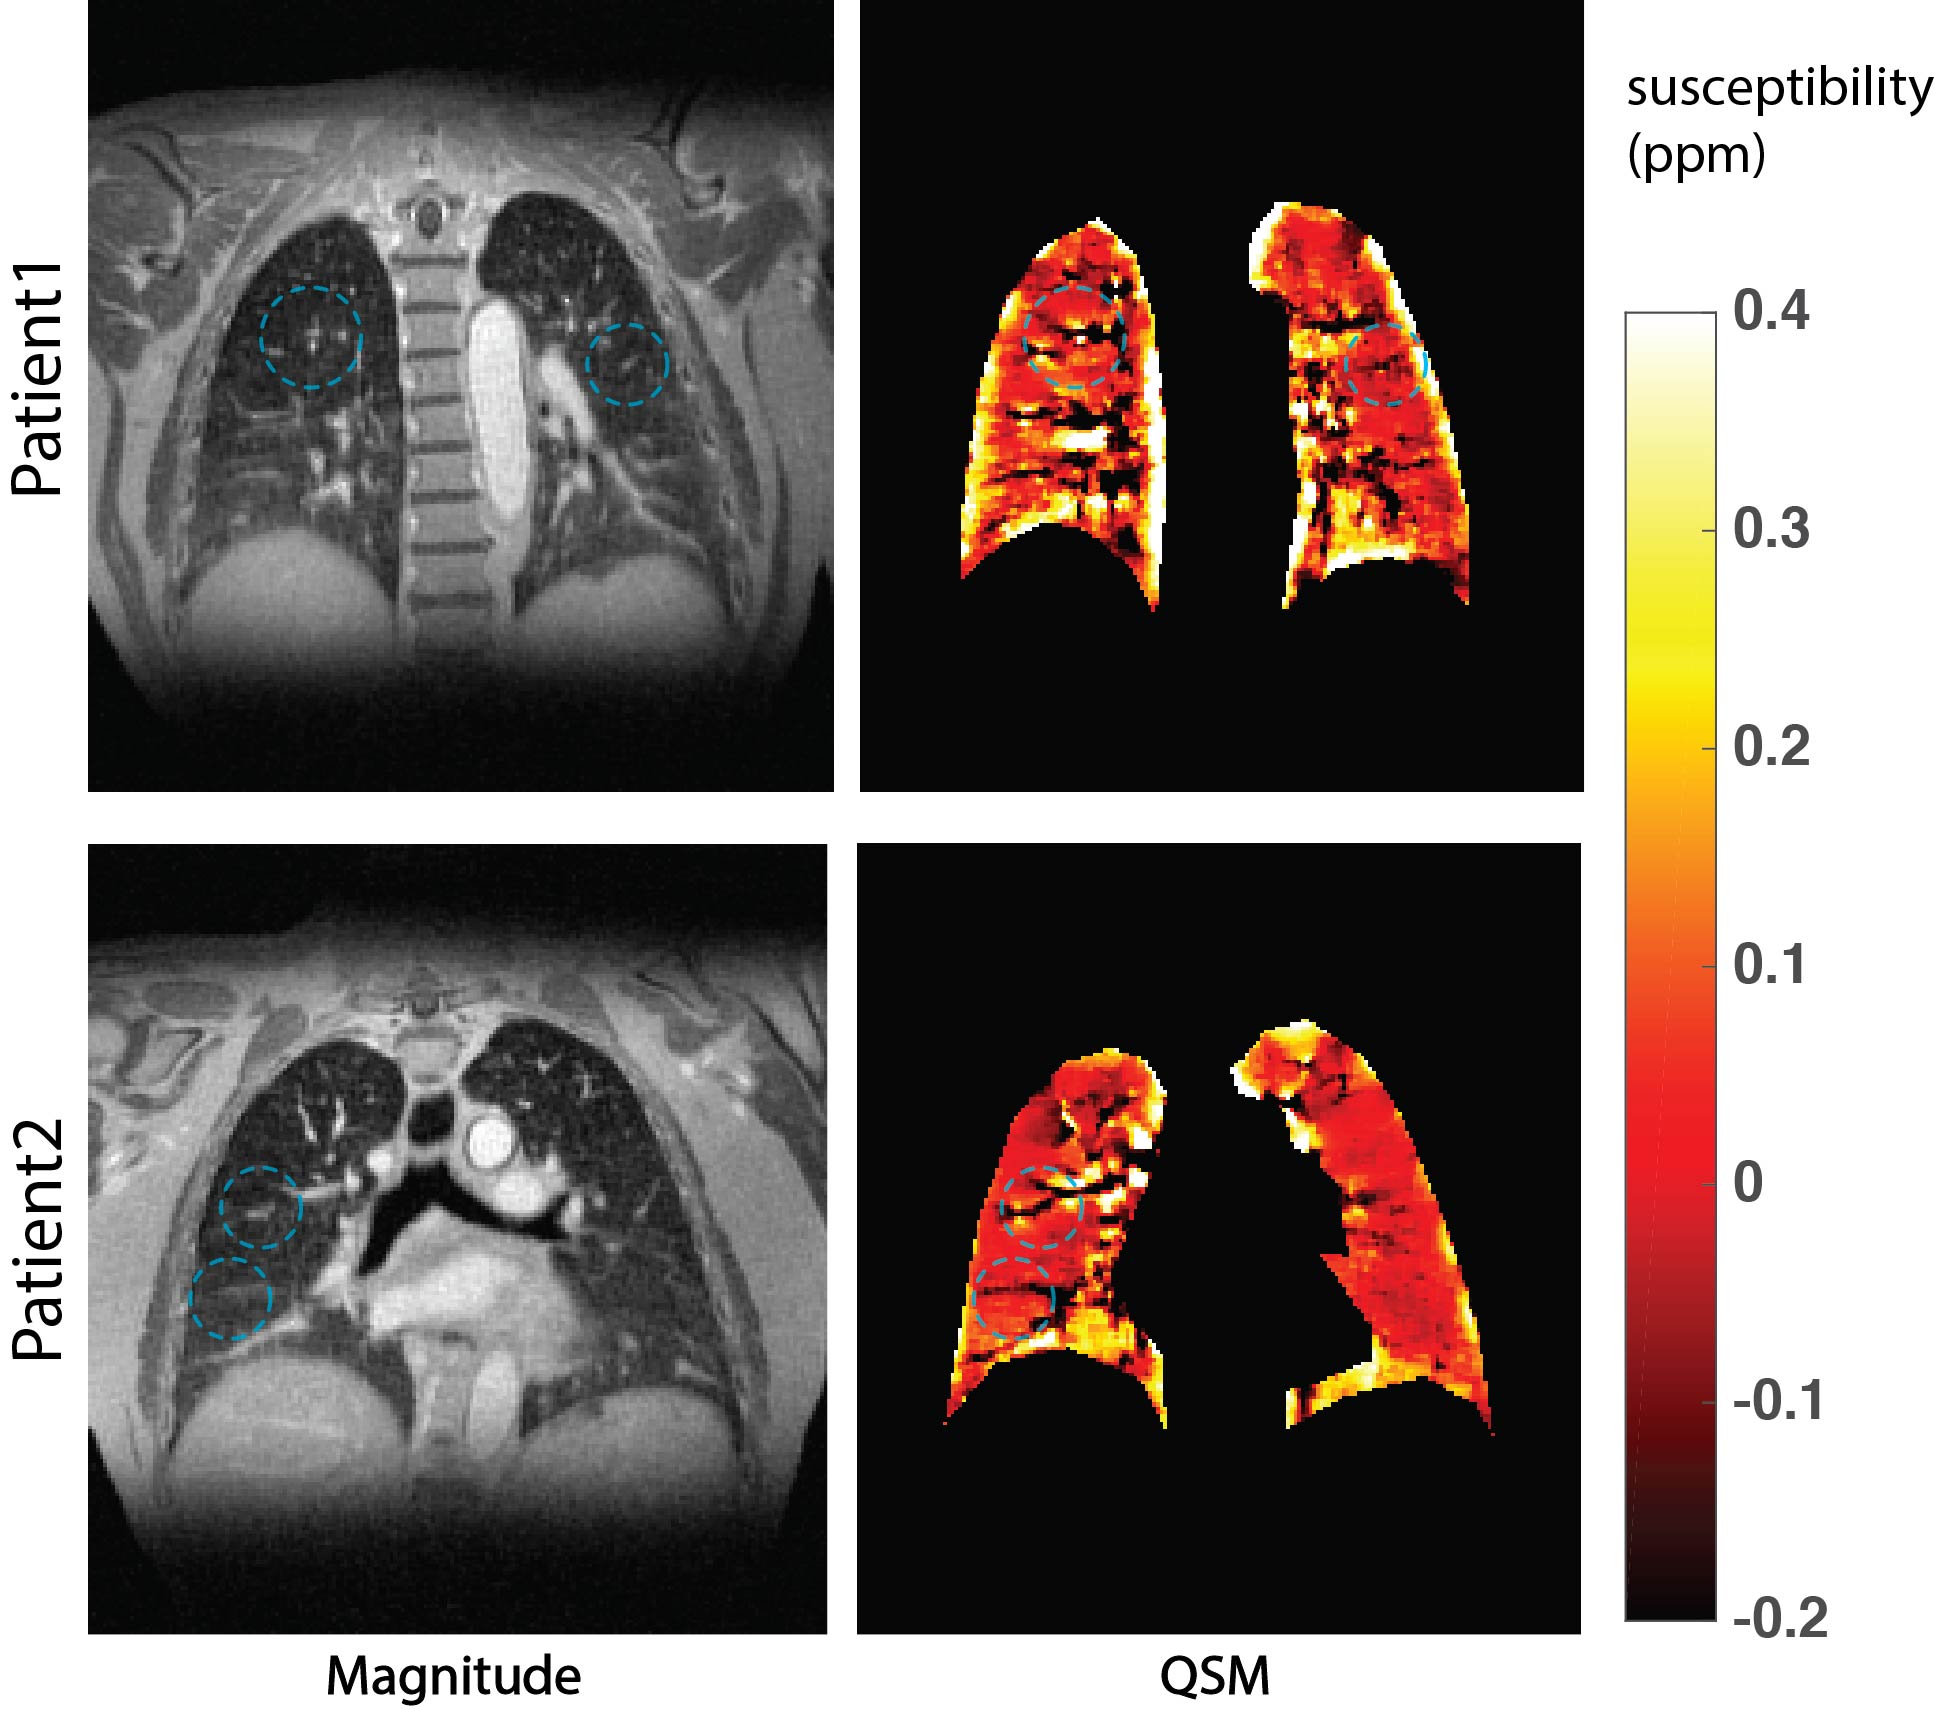
As QSM aims to derive the exact local susceptibility distribution by solving the inverse problem from field to magnetic susceptibility, we expected that QSM could provide an extra lung tissue contrast in addition to signal intensity based contrast. As indicated by the blue circles in Fig.1, some pulmonary structures (bronchi and vessels) could be distinguished from parenchyma based on the susceptibility differences whereas difficult to achieve on magnitude. Moreover, QSM also showed the susceptibility variation in different areas due to inhomogeneous susceptibility distribution in the lung.
Due to different air composition ratio in different respiration states, susceptibility distribution was expected to change in different respiration states. In Fig.2(A), MQSM showed large susceptibility differences in the bronchi between different phases compared to magnitude images. Typically, the inhaled air is ~21% O2, and the exhaled air is ~15% O2, the decrease of the O2 should lead to a reduced susceptibility value in the ROIs. The average susceptibility of ROIs was calculated and plotted in Fig.2(B). Susceptibility of a few representative ROIs in II, III phases (exhalation) show lower values than I, IV (inhalation), which matched the previous analysis.
Conclusion
In this work, we combined for the first time UTE, motion-resolved reconstruction and QSM to investigate the susceptibility variations during the respiratory cycle in humans. Utilizing a UTE sequence and QSM, we showed that QSM could provide additional anatomical details compared to magnitude only image. Moreover, MQSM showed susceptibility changes in lung tissue and bronchi, which is likely caused by the different O2 partial pressure in air between inhalation and exhalation. Together, this technique shows potential to investigate pulmonary function and to evaluate the susceptibility changes caused by various pulmonary diseases such as cystic fibrosis, asthma, COPD, and pulmonary fibrosis.Acknowledgements
No acknowledgement found.References
[1] Chen, X. Josette, et al. "Spatially resolved measurements of hyperpolarized gas properties in the lung in vivo. Part I: diffusion coefficient." Magnetic resonance in medicine 42.4 (1999): 721-728.
[2] Johnson, Kevin M., et al. "Optimized 3D ultrashort echo time pulmonary MRI." Magnetic resonance in medicine 70.5 (2013): 1241-1250.
[3] Wang, Yi, and Tian Liu. "Quantitative susceptibility mapping (QSM): decoding MRI data for a tissue magnetic biomarker." Magnetic resonance in medicine 73.1 (2015): 82-101.
[4] Cleveland, Zackary I., et al. "Quantitative Susceptibility Mapping of the Lungs with Multi-echo Radial MRI: Sensitivity to Pulmonary Oxygen Content." ISMRM2017.
[5] Larson, Andrew C., et al. "Self‐gated cardiac cine MRI." Magnetic Resonance in Medicine 51.1 (2004): 93-102.
[6] Jiang, Wenwen, et al. "Motion robust high resolution 3D free‐breathing pulmonary MRI using dynamic 3D image self‐navigator." Magnetic Resonance in Medicine (2017).
[7] Li, Wei, et al. "Integrated Laplacian‐based phase unwrapping and background phase removal for quantitative susceptibility mapping." NMR in Biomedicine 27.2 (2014): 219-227.
Figures