1075
Respiratory-triggered (RT) spin-echo echo-planar imaging (SE-EPI) based MR Elastography (MRE)1Philips, Cincinnati, OH, United States, 2Radiology, Cincinnati Children's Hospital Medical Center, Cincinnati, OH, United States, 3Philips, Wickliffe, OH, United States
Synopsis
In this work, we describe the development of respiratory-triggered (RT) SE-EPI MR elastography (MRE) and its validation with respect to breath-hold (BH) SE-EPI MRE in adult volunteer subjects.
Introduction
MRE allows noninvasive measurement of liver stiffness which correlates with histopathologic grading of fibrosis (1-3). SE-EPI is an alternative to gradient (fast field) echo imaging for performing MRE that is faster and less susceptible to signal loss and susceptibility artifacts(4). In this work, we describe the development of a novel two-dimensional (2D) RT SE-EPI MRE pulse sequence.Materials and Methods
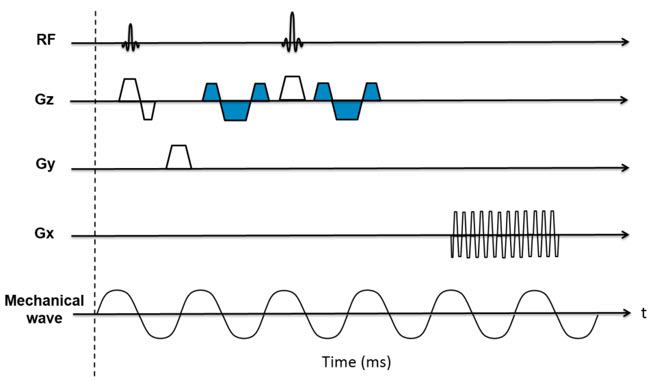
The SE-EPI MRE pulse sequence diagram is shown in Fig. 1. Motion sensitivity is achieved by placing a pair of Motion Encoding Gradients (MEG, 16.7 msec and 18 mT/m) in the SE-EPI sequence along the slice select (Gz) direction. The polarity of the MEG was reversed every repetition time (TR) to generate a motion sensitive phase image. TTL trigger pulses were produced by the pulse sequence to synchronize the active driver to the imaging sequence. For the respiratory triggering (RT) technique, a respiratory sensor placed on the subject’s abdomen/chest was used to detect patient respiration. Data acquisition occurred during the quiescent portion of expiration.
Twenty subjects (18 with normal liver stiffness, 2 with known stiff livers) (6 hours fasting status) were recruited under an institutional review board-approved research protocol and scanned using the RT SE-EPI MRE sequence on a Philips Ingenia 1.5T scanner (Best, The Netherlands). Scan parameters were as follows: TR=1000 msec; TE=58 msec; flip angle=90°; acquisition matrix=64x64; 60 motion cycles per TR; motion frequency=60 Hz; slice thickness=10 mm, slice gap=1 mm; and SENSE factor=2. A standard BH SE-EPI acquisition (9 second breath hold) was also acquired for comparison. Liver MRE scans were performed using a 28-channel posterior and anterior coil array. Four axial slices through the mid liver were obtained for each sequence.
MR elastograms were generated using a multimodal direct inversion (MMDI) algorithm (Mayo Clinic, Rochester, MN), with overall liver stiffness calculated as the average of the mean stiffness measured on each slice (kPa). The size of the reliable region of interest (ROI) provided by the MMDI algorithm was recorded. Mean liver stiffness values between RT and BH SE-EPI MRE techniques were compared using a paired t-test and Bland-Altman difference analysis. Absolute agreement between techniques was determined by calculating a single-measure intra-class correlation coefficient (ICC). ROI size was compared using the paired t-test.
Results
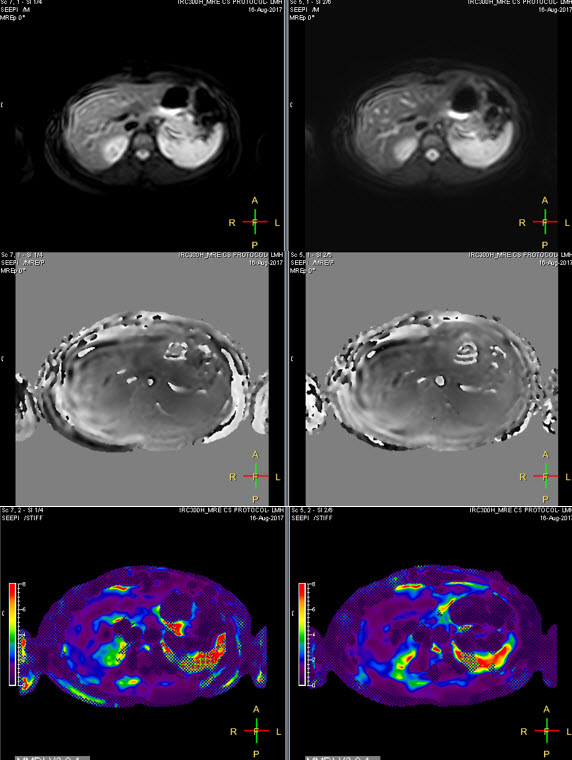
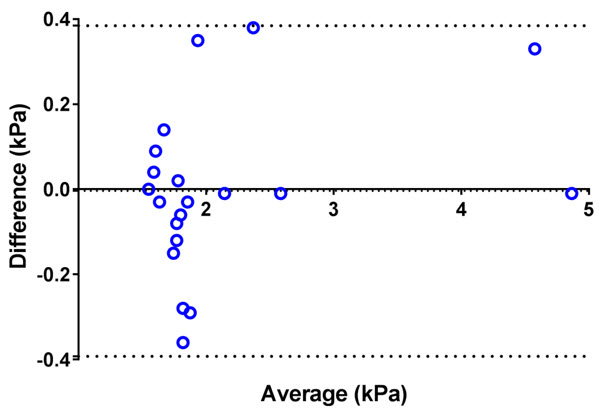
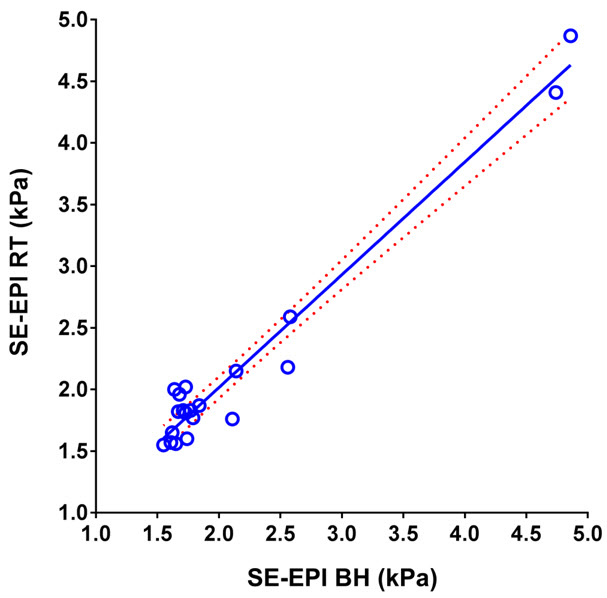
Mean liver stiffness was 2.14 ± 0.96 kPa by BH SE-EPI MRE and 2.14 ± 0.89 kPa by RT SE-EPI MRE (n=20; p=0.93). Fig.2 shows representative MRE data from one of the volunteer subjects. Mean bias between techniques was -0.004 kPa (95% limits of agreement: -0.39 to 0.38 kPa) by Bland-Altman analysis (Fig. 3). There was excellent agreement between stiffness values acquired with the two techniques with ICC=0.98 (Fig. 4), with no statistical outliers. There was no significant difference in the mean size of measurable regions of interest (ROI) between BH SE-EPI MRE (2843 ± 846 mm2) and RT SE-EPI MRE (2727 ± 799 mm2) (p=0.08) (Fig. 5).Conclusion
We have successfully developed and validated RT SE-EPI MRE. In 20 subjects, we have demonstrated no significant differences in measured stiffness between RT SE-EPI MRE and BH SE-EPI MRE confirming the viability of the new technique, which may be of value in children and adults with limited breath hold capacity.Acknowledgements
No acknowledgement found.References
[1] Yin et.al, Radiology 2016, 278(1):114-24. [2] Xanthakos et. al, J Pediatr 2014, 164(1):186-8. [3] Serai et. al, Abdom Imaging 2015, 40(4): 789-94. [4] Trout et. al, Radiology 2016, 281(3):793-804.Figures