1074
In Vivo MR Elastography in Abdominal Aortic Aneurysm Porcine Model: A Comparison to Burst Testing and Mechanical Testing1Department of Radiology, The Ohio State University Wexner Medical Center, Columbus, OH, United States, 2Department of Biomedical Engineering, The Ohio State University, Columbus, OH, United States, 3Dorothy M. Davis Heart and Lung Research Institute Interventional Cardiology Catheterization Core Lab, The Ohio State University Wexner Medical Center, Columbus, OH, United States, 4Center for Biostatistics, The Ohio State University, Columbus, OH, United States
Synopsis
Abdominal aortic aneurysm (AAA) can result in death due to rupture. Aortic stiffness is an important biomechanical property that can potentially provide accurate rupture risk evaluation. MR elastography (MRE) is a non-invasive technique to estimate aortic stiffness and has not been validated. Therefore, the aim of this study is to use in vivo aortic MRE to estimate aortic stiffness in AAA-induced animal models, and compare it with mechanical testing as well as burst testing. Results demonstrated that aortic stiffness was significantly higher in AAA when compared to normal aorta, while bursting pressure and peak stress was significantly lower in AAA.
Introduction
Abdominal aortic aneurysm (AAA) is an abnormal aortic dilation of the abdominal aorta. Despite its symptomless development, AAA rupture is a leading cause of death in the United States [1]. In clinical practice, AAA with diameter >5.5cm is considered high-risk. However, studies have observed that small AAAs (<5.5cm) also rupture frequently, arguing that diameter is a poor metric in assessing rupture potential [2-4]. Aortic stiffness can be a better alternative as it can provide crucial information about the mechanical integrity of AAA [5-7]. MR elastography (MRE) is a non-invasive phase-contrast MR technique through which the shear stiffness of AAA can be estimated. However, in vivo aortic MRE has not been validated against other gold standard methods. Therefore, the aim of this study is to validate aortic MRE in AAA-induced porcine model, and compare MRE-derived effective aortic stiffness with burst testing as well as mechanical testing.Methods
AAA was induced in 26 Yorkshire pigs using elastase and calcium chloride after mechanically stretching the abdominal aortic wall via an endovascular approach [9]. There were 6 and 20 animals involved in burst and mechanical testing, respectively. Data from a few animals were discarded due to technical issues.
MR imaging was performed in a 1.5T MR scanner (Avanto, Siemens Healthcare, Erlangen, Germany). Animals were placed in feet first-supine position inside the scanner. MRE was performed prior to the AAA-induction surgery (baseline) and each week after the surgery. A retrospectively pulse-gated GRE MRE sequence was employed. Imaging parameters included: TE/TR=10.77/14.29ms; FOV=400x400mm2; slice thickness=6mm; no. of slices=3; reconstruction matrix=256x256; mechanical frequency=70Hz; MEG frequency=120Hz; three-directional motion encoding; 4 phase offsets.
Aortic MRE data was processed using MRElab (Mayo Clinic, Rochester, MN). The first harmonic displacement was filtered using eight 4th-order Butterworth band-pass directional filters with cutoffs of 1-40waves/FOV to eliminate longitudinal components and wave reflections. A local-frequency estimation (LFE) inversion was performed on the 3D volumetric MRE dataset to obtain the stiffness in each motion encoding direction [10]. The reported stiffness was calculated by a weighted combination of first harmonic amplitudes from all three motion encoding directions.
Burst testing was performed on harvested normal and AAA specimens from the same animal. Both ends of the abdominal aorta were cannulated to the inflation system (See Figure 1). During testing, specimens were immersed under room-temperature saline. The pressure at which aorta specimens failed to remain intact was recorded as bursting pressure.
During mechanical testing, aorta specimens were secured using cryogrips. Uniaxial tensile test was performed at a stretching rate of 10mm/min until specimen failure, and peak stress was obtained.
Results and Discussion
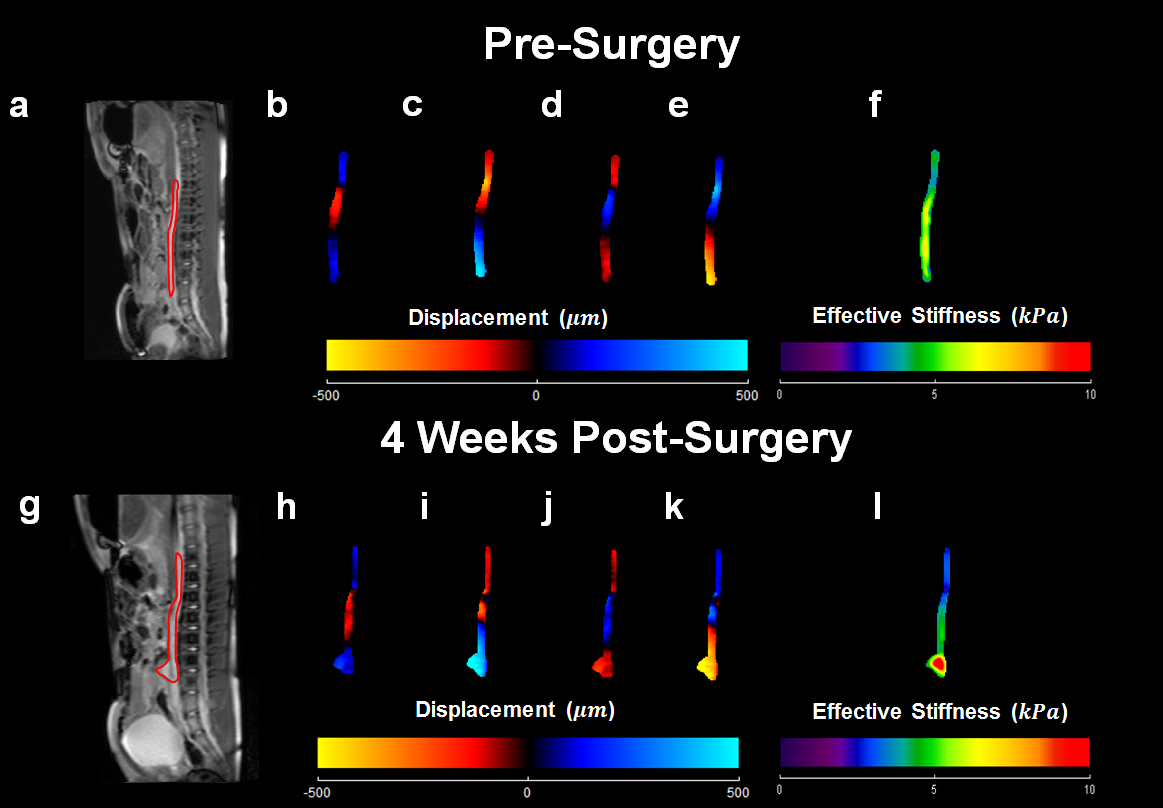
AAA development and stiffness increase can be observed at week 4. Figure 2 demonstrates the magnitude images in sagittal view, wave images and corresponding aortic stiffness maps of the same animal before AAA-induction surgery and 4 weeks post-surgery.
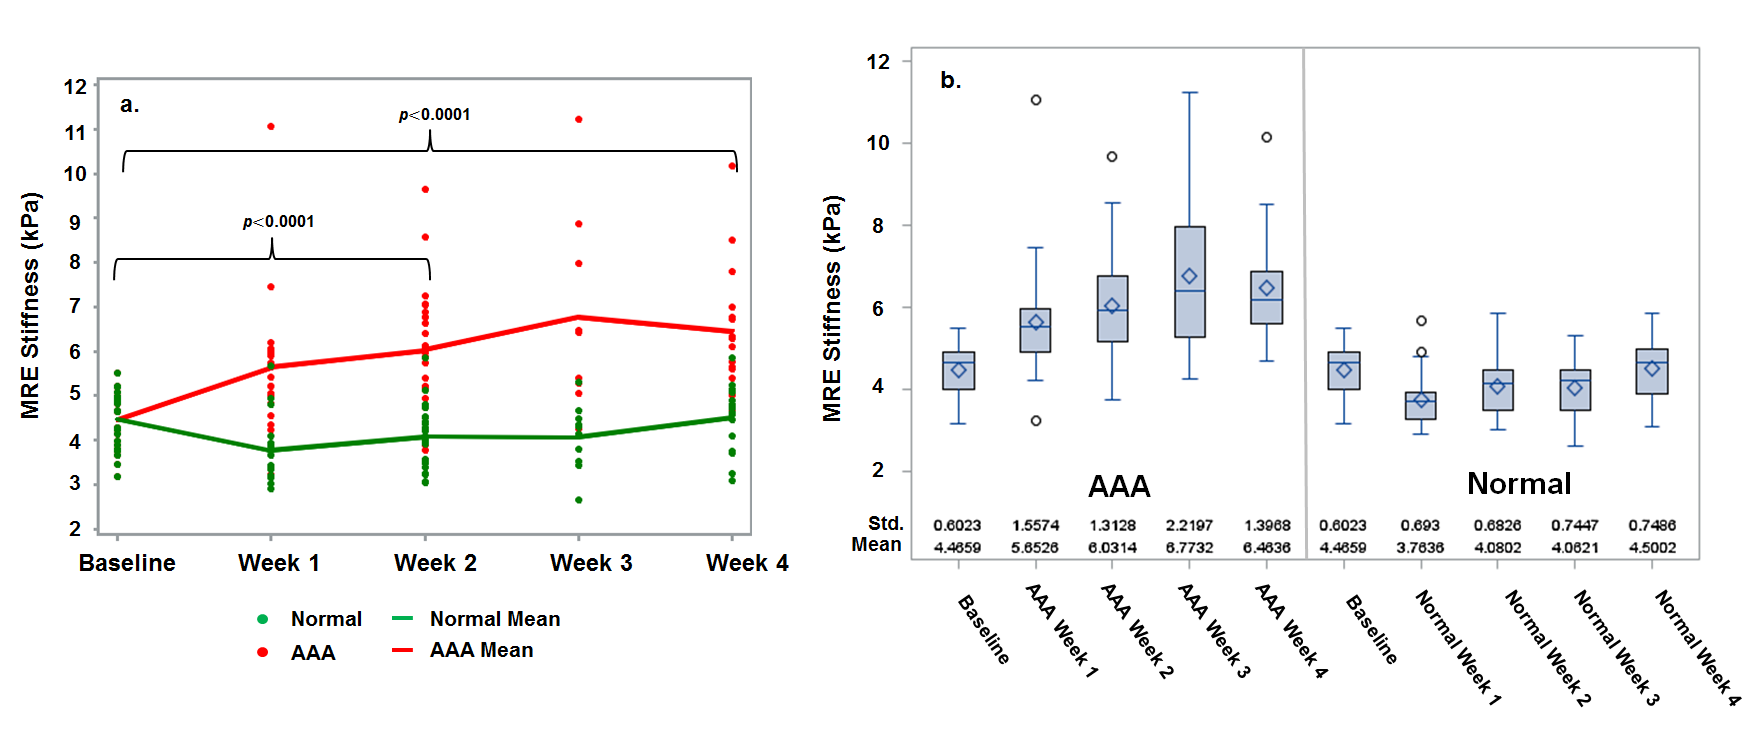
AAA stiffness was significantly higher than normal aortic stiffness (p<0.0001). Figure 3 displays the aortic stiffness across different time points in all animals. The mean aortic stiffness was 4.47±0.60, 5.65±1.56, 6.03±1.31, 6.77±2.22 and 6.46±1.40kPa for baseline to week 4, respectively.
Bursting pressure of AAA was significantly lower than that of normal aorta (p<0.0001). Figure 4 displays the comparison between MRE-derived aortic stiffness and bursting pressure. The mean bursting pressure was 3124.88±465.68 and 1522.99±424.76mmHg for normal aorta and AAA specimens, respectively. A negative correlation was observed between bursting pressure and aortic stiffness with Spearman correlation coefficient ρ=-0.78 (p=0.008).
For AAA, the calcified layer was prone to fail due to lack of structural strength despite higher stiffness (i.e., brittle), resulting in a lower bursting pressure when compared to normal aorta (See Figure 4d).
In week 4 animals, mechanical testing showed significantly lower peak stress in AAA when compared to normal aorta, demonstrating decrease in aortic wall strength in AAA. Figure 5 displays the comparison between aortic stiffness and peak stress in normal aorta and AAA. The mean peak stress by pooling all animals was 1.72MPa and 0.95MPa for normal aorta and AAA specimens, respectively. However, in week 2 animal group, there was no significant difference between the peak stress of normal aorta and AAA. This was due to the fact that AAA was under development in which the aortic wall retained its strength.
Conclusion
This study demonstrated that aortic stiffness increased in AAA-induced porcine model. Moreover, both bursting pressure and peak stress were lower in AAA, suggesting diminishing strength of the aortic wall as the disease progresses. This study validated MRE-derived AAA stiffness against gold standard methods. Therefore, aortic MRE can be a potential tool for AAA diagnosis and more accurate assessment of rupture risk.Acknowledgements
The authors acknowledge Brian Raterman, BSRT (MR), Department of Radiology at The Ohio State University Wexner Medical Center for his help.References
[1] Kuivaniemi H, Platsoucas CD, Tilson 3rd MD. Aortic aneurysms: an immune disease with a strong genetic component. Circulation 2008;117(2):242-252.
[2] Nicholls SC, Gardner JB, Meissner MH, Johansen HK. Rupture in small abdominal aortic aneurysms. J Vasc Surg 1998;28:884-8.
[3] Lederle FA, Wilson SE, Johnson GR, Reinke DB, Littooy FN, Acher CW, et al. Immediate repair compared with surveillance of small abdominal aortic aneurysms. N Engl J Med 2002;346:1437-44.
[4] Brewster DC, Cronenwett JL, Hallett JW Jr, Johnston KW, Krupski WC, Matsumura JS. Guidelines for the treatment of abdominal aortic aneurysms. Report of a subcommittee of the Joint Council of the American Association for Vascular Surgery and Society for Vascular Surgery. J Vasc Surg 2003;37:1106-17.
[5] Raghavan ML, Webster MW, Vorp DA. Ex vivo biomechanical behavior of abdominal aortic aneurysm: assessment using a new mathematical model. Ann Biomed Eng 1996;24:573-82.
[6] Vorp DA, Vande Geest JP. Biomechanical determinants of abdominal aortic aneurysm rupture. Arterioscler Thromb Vasc Biol 2005;25:1558-66.
[7] Kolipaka A, Illapani VS, Kenyhercz W, Dowell JD, Go MR, Starr JE, Vaccaro PS, White RD. Quantification of abdominal aortic aneurysm stiffness using magnetic resonance elastography and its comparison to aneurysm diameter. J Vasc Surg 2016.
[8] Kenyhercz WE, Raterman B, Illapani VS, Dowell J, Mo X, White RD, Kolipaka A. Quantification of aortic stiffness using magnetic resonance elastography: Measurement reproducibility, pulse wave velocity comparison, changes over cardiac cycle, and relationship with age. Magn Reson Med 2016;75(5):1920-1926.
[9] Zaragoza C, Gomez-Guerrero C, Martin-Ventura JL, Blanco-Colio L, Lavin B, Mallavia B, Tarin C, Mas S, Ortiz A, Egido J. Animal models of cardiovascular diseases. J Biomed Biotechnol 2011;2011:497841.
[10] Knutsson H, Westin CF, Granlund G. Local multiscale frequency and bandwidth estimation. Image Processing, 1994, IEEE International Conference 1994; Vol. 1:36-40.
Figures