1068
Imaging Visual Cortex Activity with Intrinsic Activation MRE1Department of Diagnostic Radiology, University of Sherbrooke, Sherbrooke, QC, Canada, 2Department of Mechanical Engineering, University of Sherbrooke, Sherbrooke, QC, Canada
Synopsis
Initial RD-MRE results from intrinsic activation during repeated ON-OFF visual stimulation cycles are presented. Processed probability values from independent t-tests show areas of isolated activity in the region of the visual cortex for certain mechanical parameters, including the real shear modulus and the imaginary bulk modulus. Overlays of these probability value images with co-registered BOLD images show complimentary regions of activation.
INTRODUCTION
Recent interest in functional imaging via MR Elastography (fMRE) has shown evidence of mechanical changes during cerebral activity 1,2. Given the critical role of blood flow in the gold standard functional MRI (fMRI) method, i.e. BOLD, it is natural to question the role of hemodynamics in the viscoelastic property changes observed in fMRE. One possible method for separating the structural and fluid components that underlie the effectively viscoelastic properties of brain tissue at higher frequencies 3 is low frequency Rayleigh-damped 4,5 viscoelastography (RD-MRE) 6 via intrinsic activation 7.
The main goals of this research are: i) to develop a protocol for intrinsic fMRE imaging using a visual stimulus ii) to test the ability to detect changes in the viscoelastic properties in the region of the visual cortex during visual stimulation iii) to eventually compare results from viscoelastic and poroelastic fMRE to better understand the role of hemodynamics during cerebral activity.
Here, initial RD-MRE results from intrinsic activation during repeated ON-OFF visual stimulation cycles are presented. Processing of the probability values from independent t-tests shows areas of isolated activity in the region of the visual cortex for certain mechanical parameters, including the real shear modulus (μR, or G', i.e. the storage modulus) and the imaginary bulk modulus (KI). Overlays of these probability value images with co-registered BOLD images show complimentary regions of activation.
METHODS
MR Data Acquisition: Visual stimulus for the primary visual cortex (V1) was provided during the MR imaging protocol via the Psychophysics Toolbox for Matlab. After a high-resolution T1 image, a 5 minute BOLD sequence was used with 20 second repeated ON and OFF intervals (Figure 1). Once the location of V1 was identified, intrinsic brain displacements were measured by a cardiac-gated quantitative flow sequence (QFLOW), similar to Weaver et al. 7, during 3 repeated ON and OFF visual stimulation cycles, with each ON or OFF interval lasting roughly 5 minutes (3 repeats X 2 (ON & OFF) X 5 minutes = 30 minutes imaging time). The intrinsic MRE displacement data was obtained on a 3T Philips Ingenia with 2.8 mm isotropic voxels using 8 phase offsets.
RD-MRE Processing: Rayleigh damped viscoelastic MRE reconstructions were performed on each of the 6 measured displacement fields and the sample mean and sample variance for each pixel were generated across the 3 repeats for each ON and OFF visual stimulation cycle. RD-MRE reconstruction was performed using 2.5 mm isotropic property grids and 27 noded quadratic hexahedral displacement finite elements for the subzone based non-linear inversion (NLI)8. The real density of the imaging region was assumed to be that of water (ρR = 1000 kg/m3) and the complex valued shear modulus (μ=μR+iμI), the complex valued bulk modulus (K=KR+iKI) and the imaginary density (ρI) were assumed unknown.
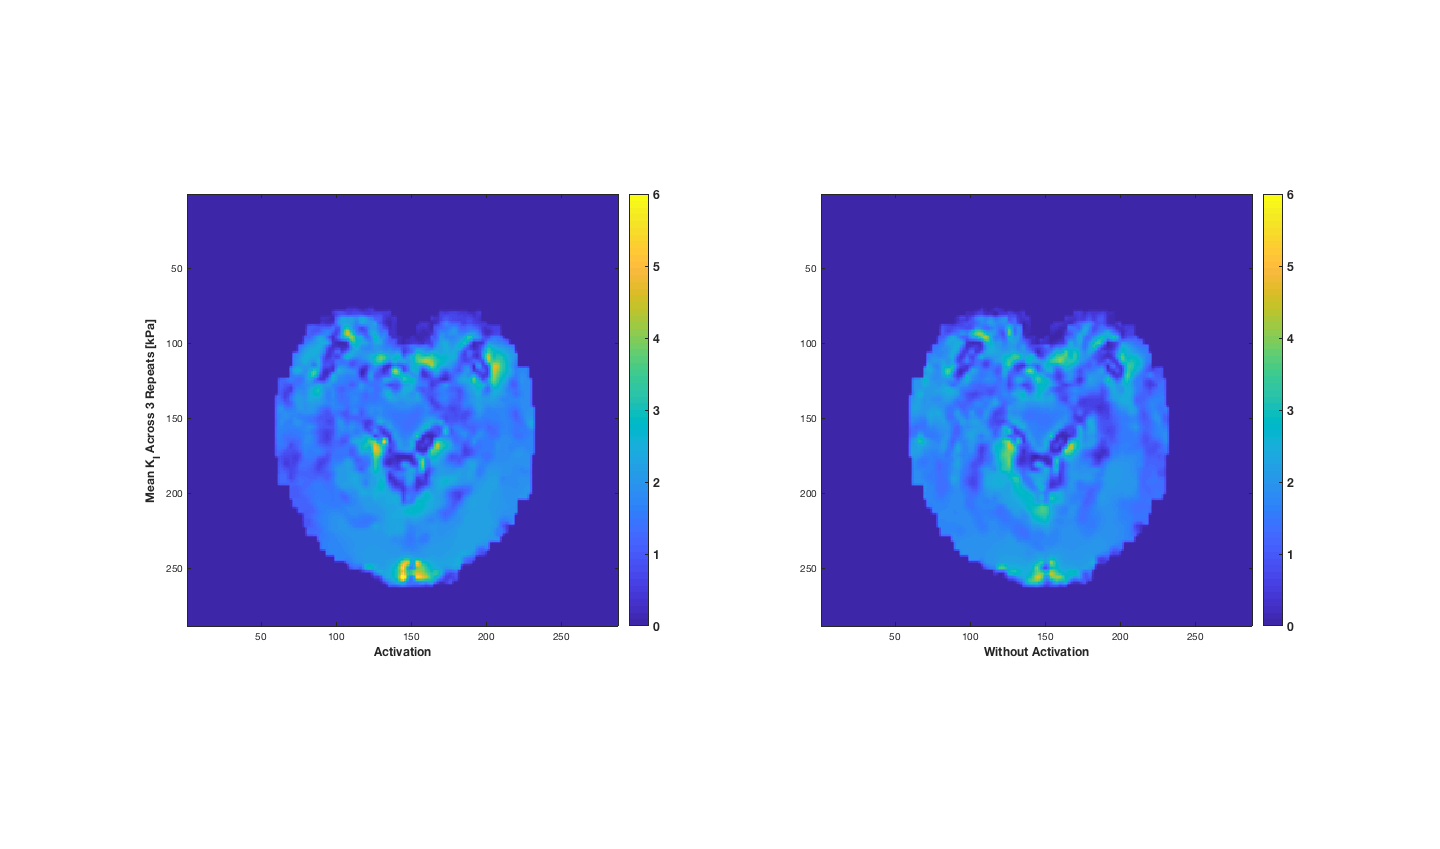
fMRE Processing: Once the material properties were reconstructed for each of the 6 displacement data sets, the two groups (visual stimulation ON and visual stimulation OFF) were processed by a Welch's t-test (two independent samples with unequal variances). For each parameter, the mean and variance distributions were collected from each group, along with the contrast-to-noise ratio and the probability value (p-value) for unequal means between the two groups. In general, these p-value distributions showed areas of activity throughout the brain, with larger, more concentric areas of elevated p-values in certain locations. To isolate these more cohesive p-value areas, an image processing step was performed to exclude smaller, eccentric areas. Examples of these processed p-value images for the μR and KI parameters are shown in Figures 2 & 3, respectively. The mean ON and OFF values for these two parameters in a representative slice are shown in Figures 4 & 5.
BOLD - RD-MRE Co-registration: The visual cortex component of the BOLD image and the processed RD-MRE p-value images were registered to the high resolution T1 image using AFNI 9 and FSL 10. Figures 1 through 5 are shown in this co-registered T1 image space.
RESULTS
In general, the processed p-value images for all of the RD-MRE parameters showed areas of activity in the region of the visual cortex, with shear and bulk modulus activity mostly isolated to this region. Co-registered BOLD and fMRE images in Figures 2 & 3 show that the areas of RD-MRE activity coincide well with the boundary of BOLD activation, suggesting complimentary contrast mechanisms sensitive to different components of visual cortex function.CONCLUSION
These preliminary results help show the pertinence of fMRE imaging as a possible adjunct to traditional BOLD imaging, helping to reveal the mechanical changes underlying brain activity.Acknowledgements
This work was supported in part by pilot study funding from the Réseau de Bio-imagerie du Québec. EEWVH is a member of the FRQS-funded Centre de recherche du Centre hospitalier universitaire de Sherbrooke (CR-CHUS).References
1. Patz S, Nazari N, Schregel K, et al. Functional neuro-imaging with magnetic resonance elastography. J Acoust Soc AM. 2017;141: 3492.
2. Fehlner A, Hirsch S, Guo J, et al. The viscoelastic response of the human brain to functional activation detected by magnetic resonance elastography. Proceedings of the 22nd Annual Meeting of the ISMRM. 2014; 0871.
3. Schwarb H, Johnson C, McGarry M, et al. Medial temporal lobe viscoelasticity and relational memory performance. Neuroimage. 2016;132: 534-541.
4. Van Houten E. Parameter identification in a generalized time-harmonic Rayleigh damping model for Elastography. PloS one. 2014;9(4), e93080.
5. McGarry M, Van Houten E. Use of a Rayleigh damping model in Elastography. Medical & biological engineering & computing. 2008;46(8), 759-766.
6. McGarry M, Johnson C, Sutton B, et al. Suitability of poroelastic and viscoelastic mechanical models for high and low frequency MR elastography. Med Phys. 2015;42(2): 947-957.
7. Weaver J, Pattison A, McGarry M, et al. Brain Mechanical Property Measurement Using MRE with Intrinsic Activation. Phys Med Biol. 2012;57(22): 7275.
8. Johnson C, Schwarb H, McGarry M, et al. Viscoelasticity of subcortical gray matter structures. Human Brain Mapping. 2016;37(12), 4221-4233.
9. Cox RW. AFNI: software for analysis and visualization of functional magnetic resonance neuroimages. Comput Biomed Res. 1996;29(3):162-73.
10. Jenkinson M, Beckmann C, Behrens T, et al. Review: FSL. Neuroimage. 2012;62(2):782-90.
Figures