1066
Water suppression in the human brain with hypergeometric RF pulses for single- and multi- voxel MR spectroscopy1Biomedical Engineering, Johns Hopkins School of Medicine, Baltimore, MD, United States, 2Russell H. Morgan Department of Radiology and Radiological Science, Johns Hopkins School of Medicine, Baltimore, MD, United States, 3F. M. Kirby Research Center for Functional Brain Imaging, Kennedy Krieger Institute, Baltimore, MD, United States, 4Biomedical and Metabolic Imaging Branch, National Institute of Diabetes and Digestive and Kidney Diseases, Bethesda, MD, United States
Synopsis
In this study, a novel water suppression sequence with hypergeometric RF pulses (HGWS) is investigated and compared to the commonly used VAPOR sequence in simulations, single and multi- voxel acquisitions. In simulations, HGWS and VAPOR are insensitive to B1 and water T1 variations, but with no B1 variation, HGWS has a lower average residual water fraction than that of VAPOR. In vivo, HGWS provides better water suppression than VAPOR in both single-voxel and multi-voxel acquisitions with a shorter sequence duration.
Purpose
In vivo MRS detection and quantification of metabolites, which have significantly lower concentrations than water, is difficult without the use of pulse sequences that reduce the water signal. The most commonly used technique is the inclusion of a water suppression module to saturate the water signal before spectral acquisition (1-3). In this study, a novel water suppression sequence with hypergeometric RF pulses (HGWS) is investigated and compared to the commonly used VAPOR sequence in simulations, single and multi- voxel acquisitions.Methods
The HGWS sequence was designed with consideration to both the tissue-dependent T1 of water and B1 inhomogeneity. Hypergeometric (HG) RF pulses were used (1, 4) and were created using Eqn. 1 in Rosenfeld et al. (5) with a = 4, b = 0.5, c = -4, d = 3.5, and W0 = 8 to create a 30 ms pulse. These pulses had a sufficiently small transition bandwidth (37 Hz) so that no metabolite spins downfield of 4.1 ppm would be affected. The pulse amplitudes and delays of the HGWS sequence were optimized using a Levenberg-Marquardt routine that searched for values that best suppressed the water signal over a range of T1 values from 500 to 3000 ms, and a B1 range from 200 to 300 Hz (2). The performance of the optimized HGWS sequence was compared to that of the widely-used VAPOR sequence (3).
In vivo experiments were performed on a Philips Achieva 3T scanner with a 32-channel head coil. HGWS and VAPOR were added as prepulses to the PRESS sequence and compared in single and multi- voxel experiments. No separate adjustment of the water suppression pulses was performed in the prescan. Single voxel experiments with TE=35 ms and TR=2s were performed in 7 healthy adults (3 female; age 27 ± 2 years) in (3 cm)3 voxels in the centrum semiovale (CSO), midline parietal region, and insula with 80 averages, and in a (4.5 cm)3 midline parietal region with 40 averages. Water un-suppressed references with 8 averages were acquired and water suppression factors were calculated. SPM was used to estimate the tissue content of each voxel from the T1-weighted MPRAGE scans. Multi voxel experiments were performed in 6 healthy adults (age 27 ± 2 years, 3 female) with TE=41 ms and TR=1.5 s. One 20 mm thick slice was recorded with a voxel size of 2 cm3 and four OVS pulses. Water-unsuppressed reference MRSI scans were also acquired.
Results
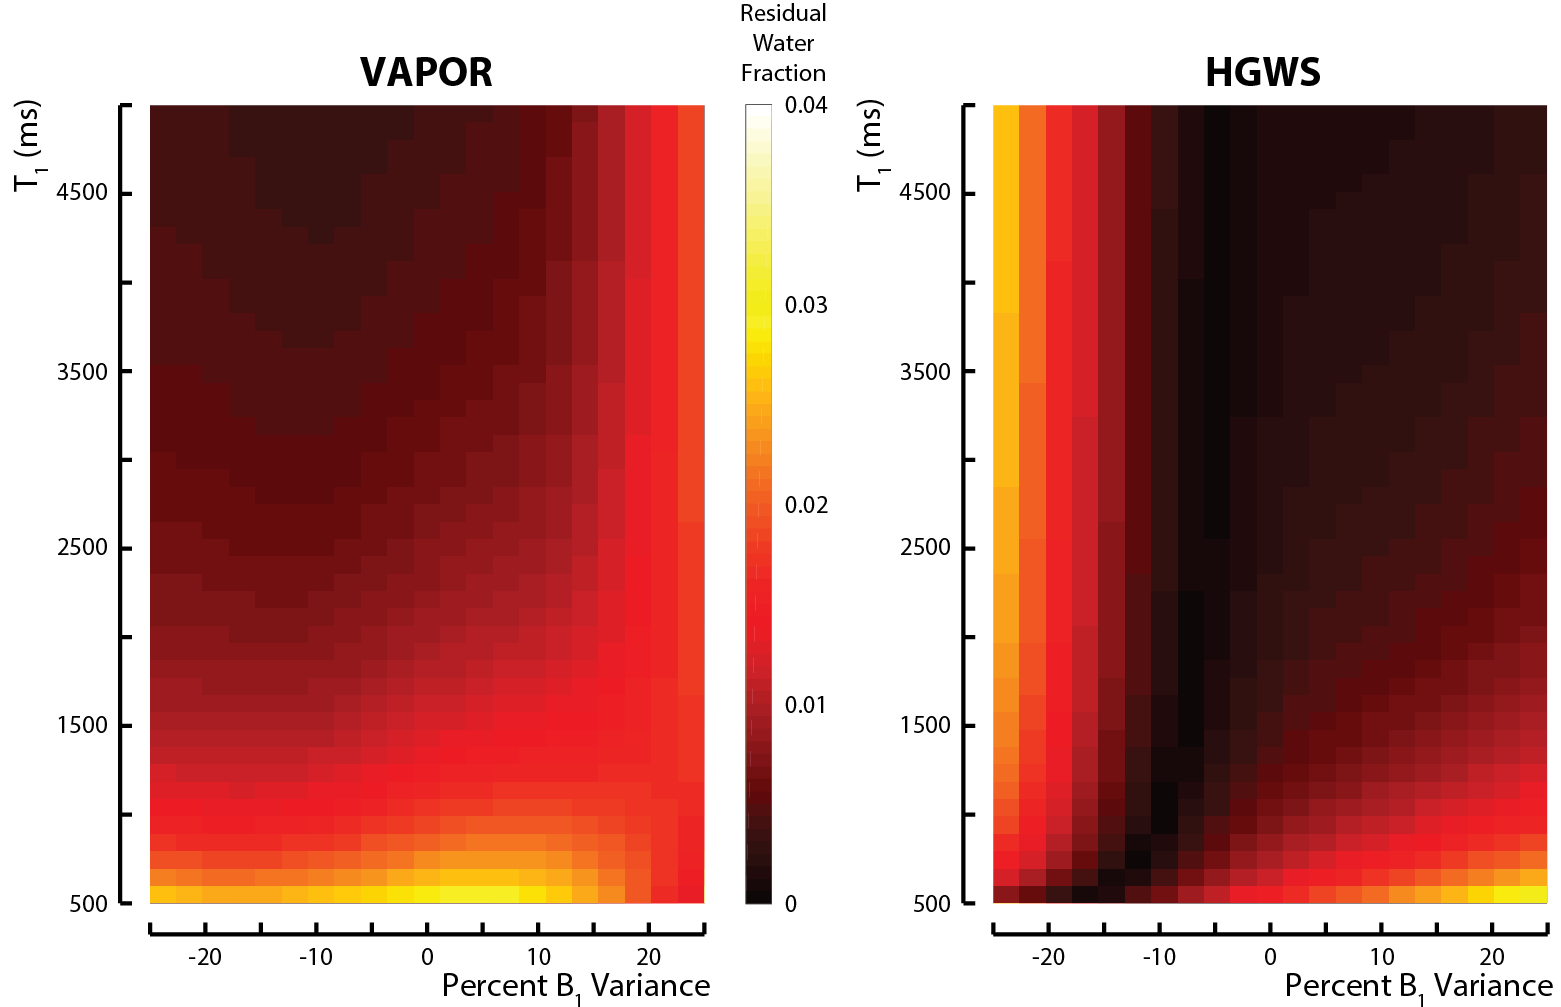
The optimized sequence has a duration of 245 ms and is shown in figure 1. Figure 2 shows simulations of the residual Z-magnetization as a function T1 and B1 for both VAPOR and water. Over the range of B1 and T1 values simulated, HGWS has better average water suppression (0.0033) than VAPOR (0.0092).
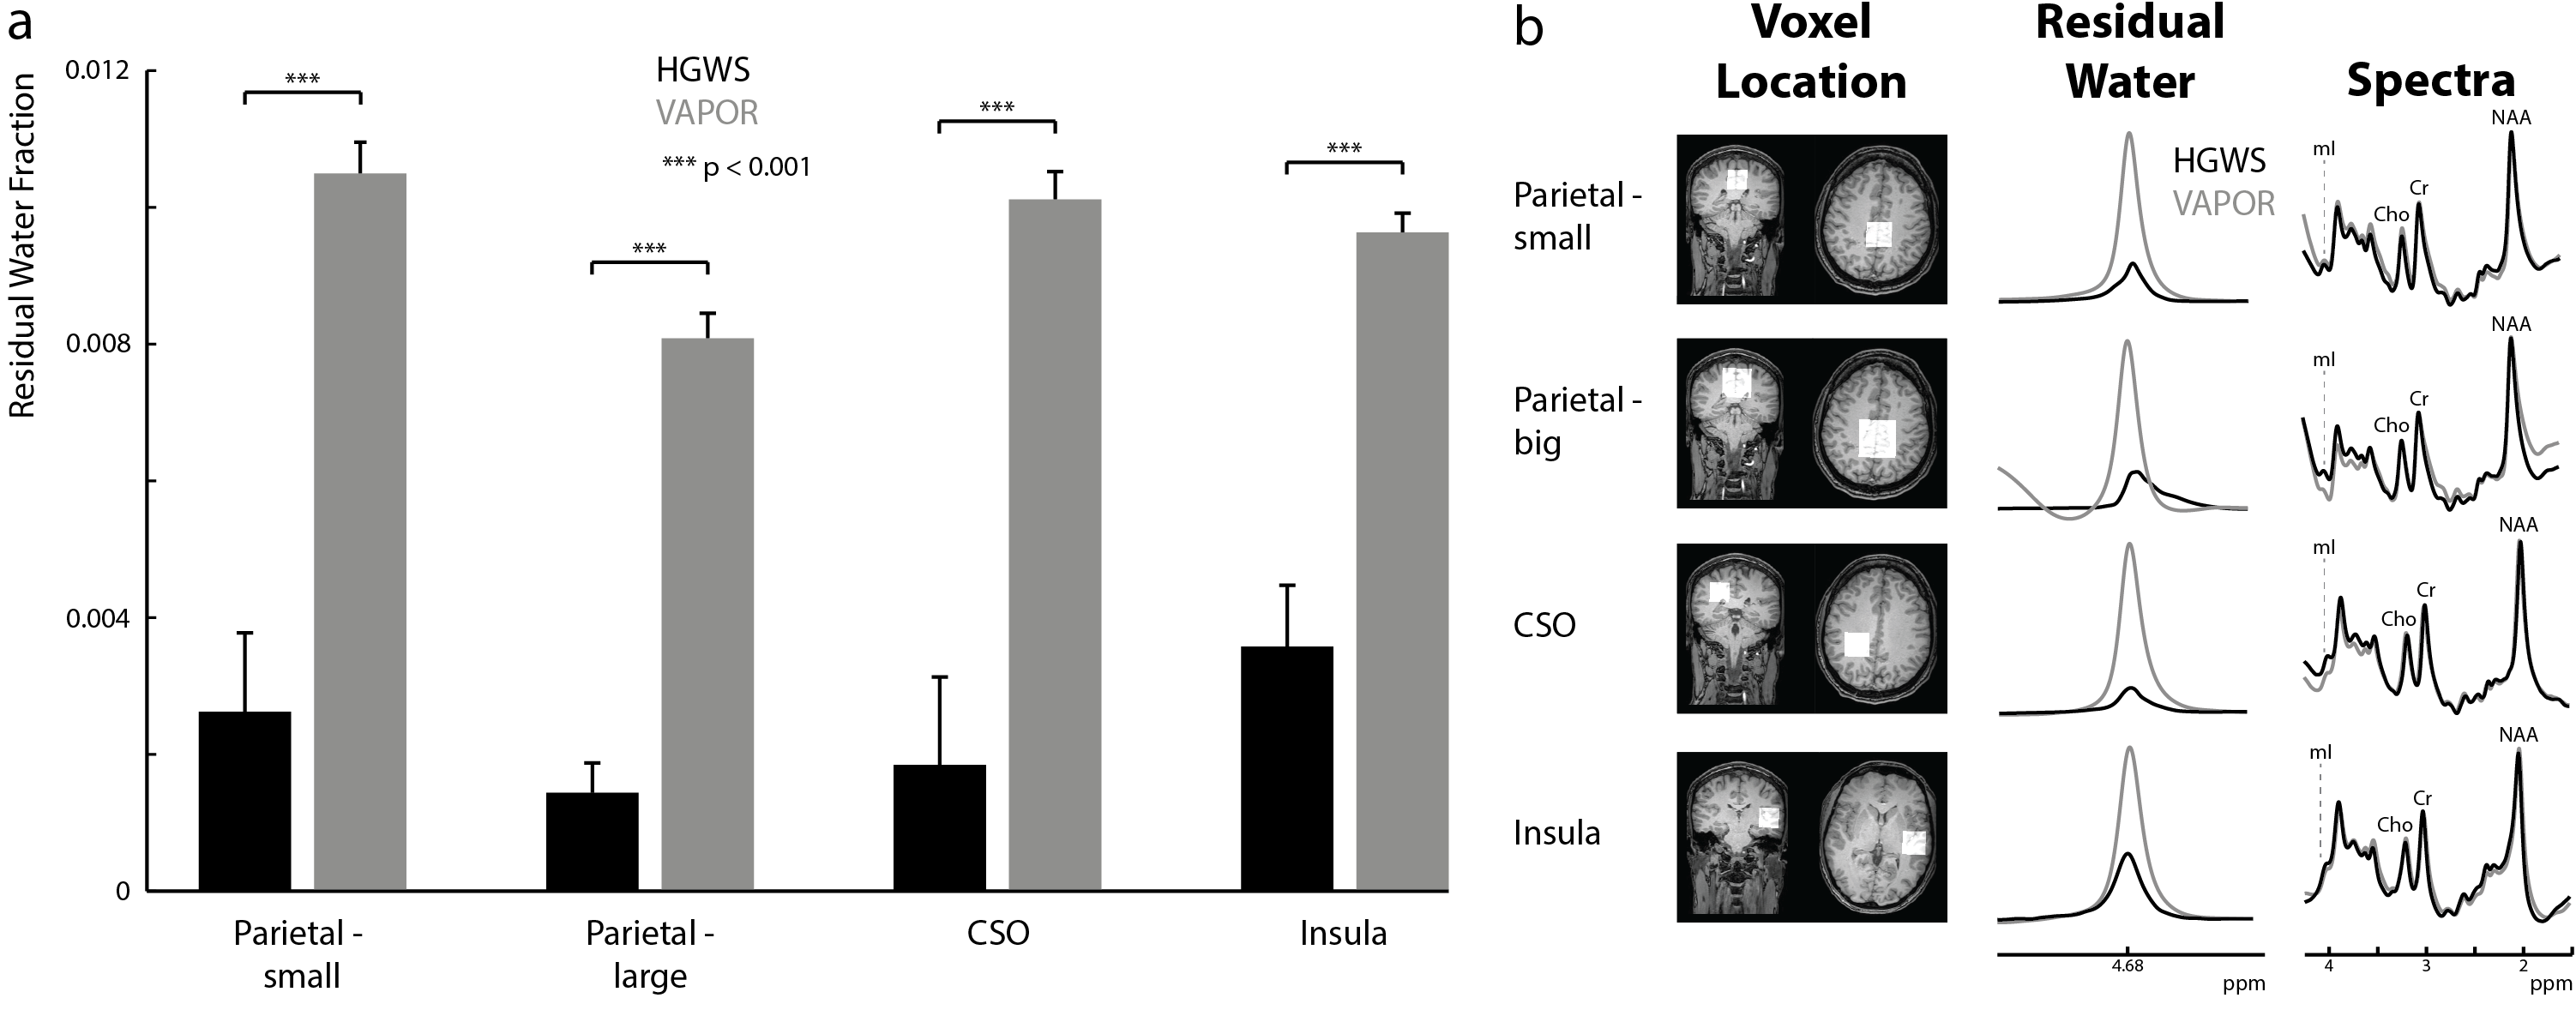
In single voxel in vivo experiments, HGWS showed 2.7-5.6 fold better water suppression factors than VAPOR in the four regions (p < 0.001) (figure 3a). These differences can be seen qualitatively in the representative water peak from each region (figure 3b), while the metabolite signal is equivalent between the two methods.
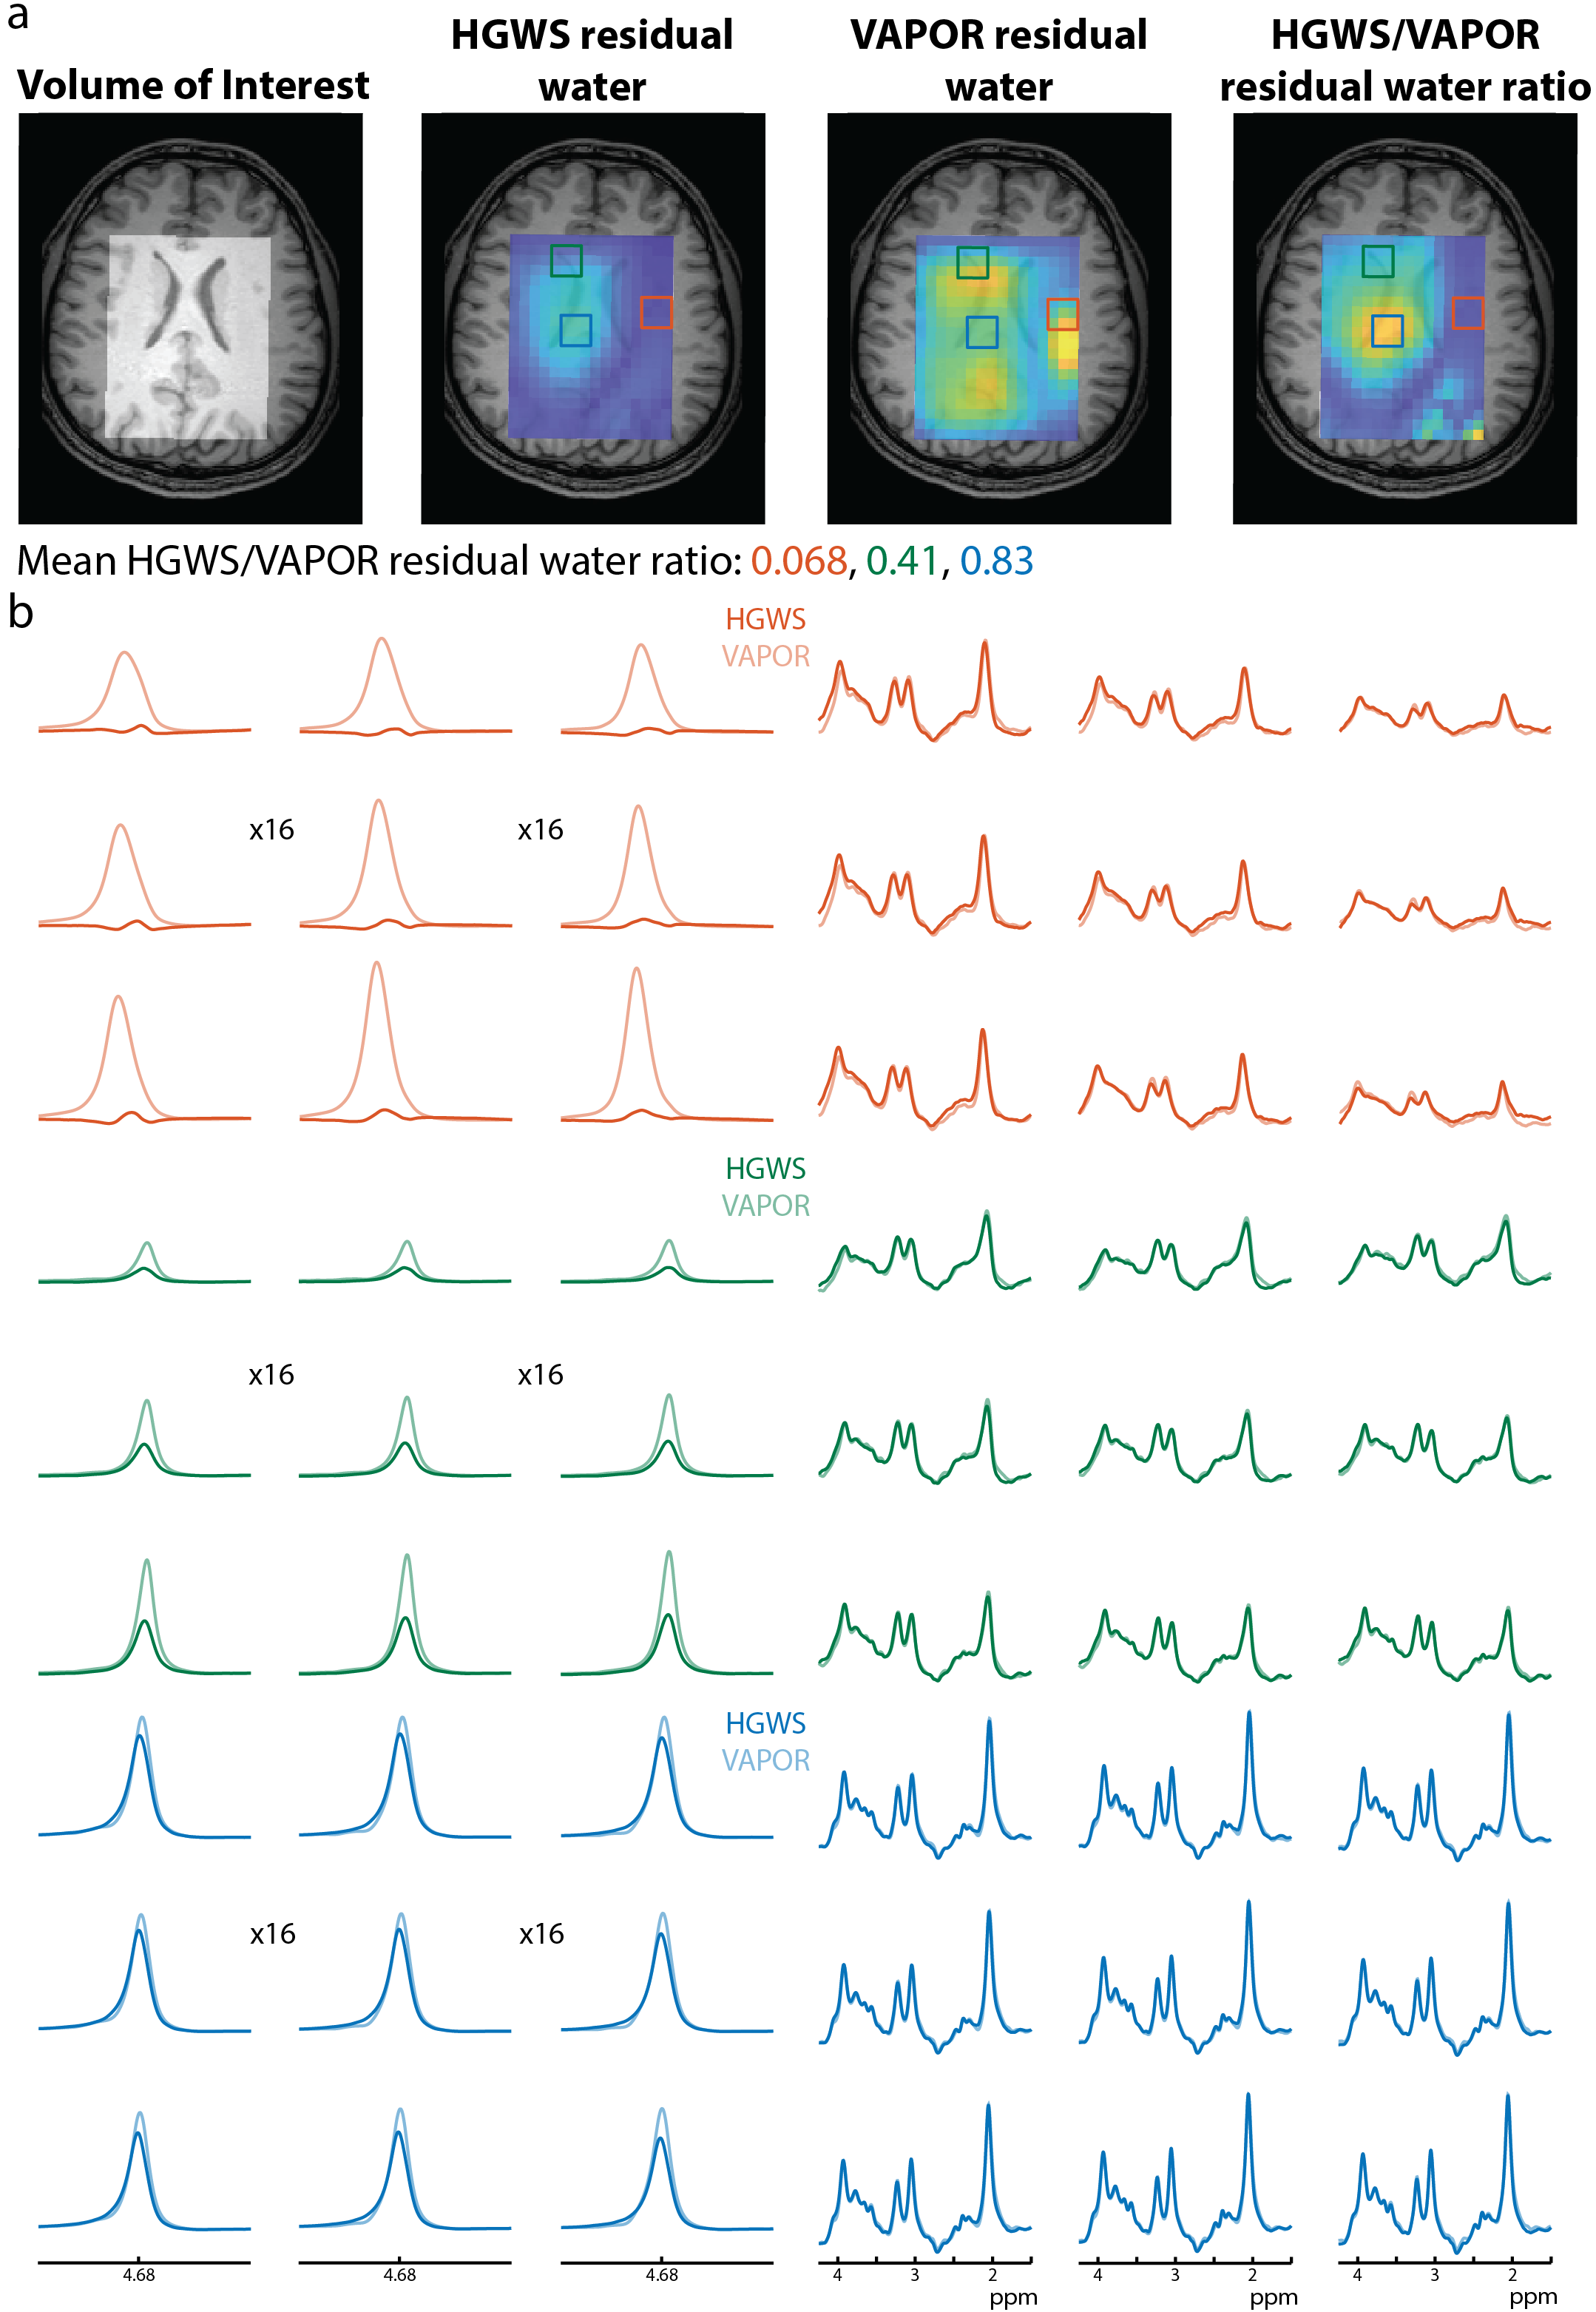
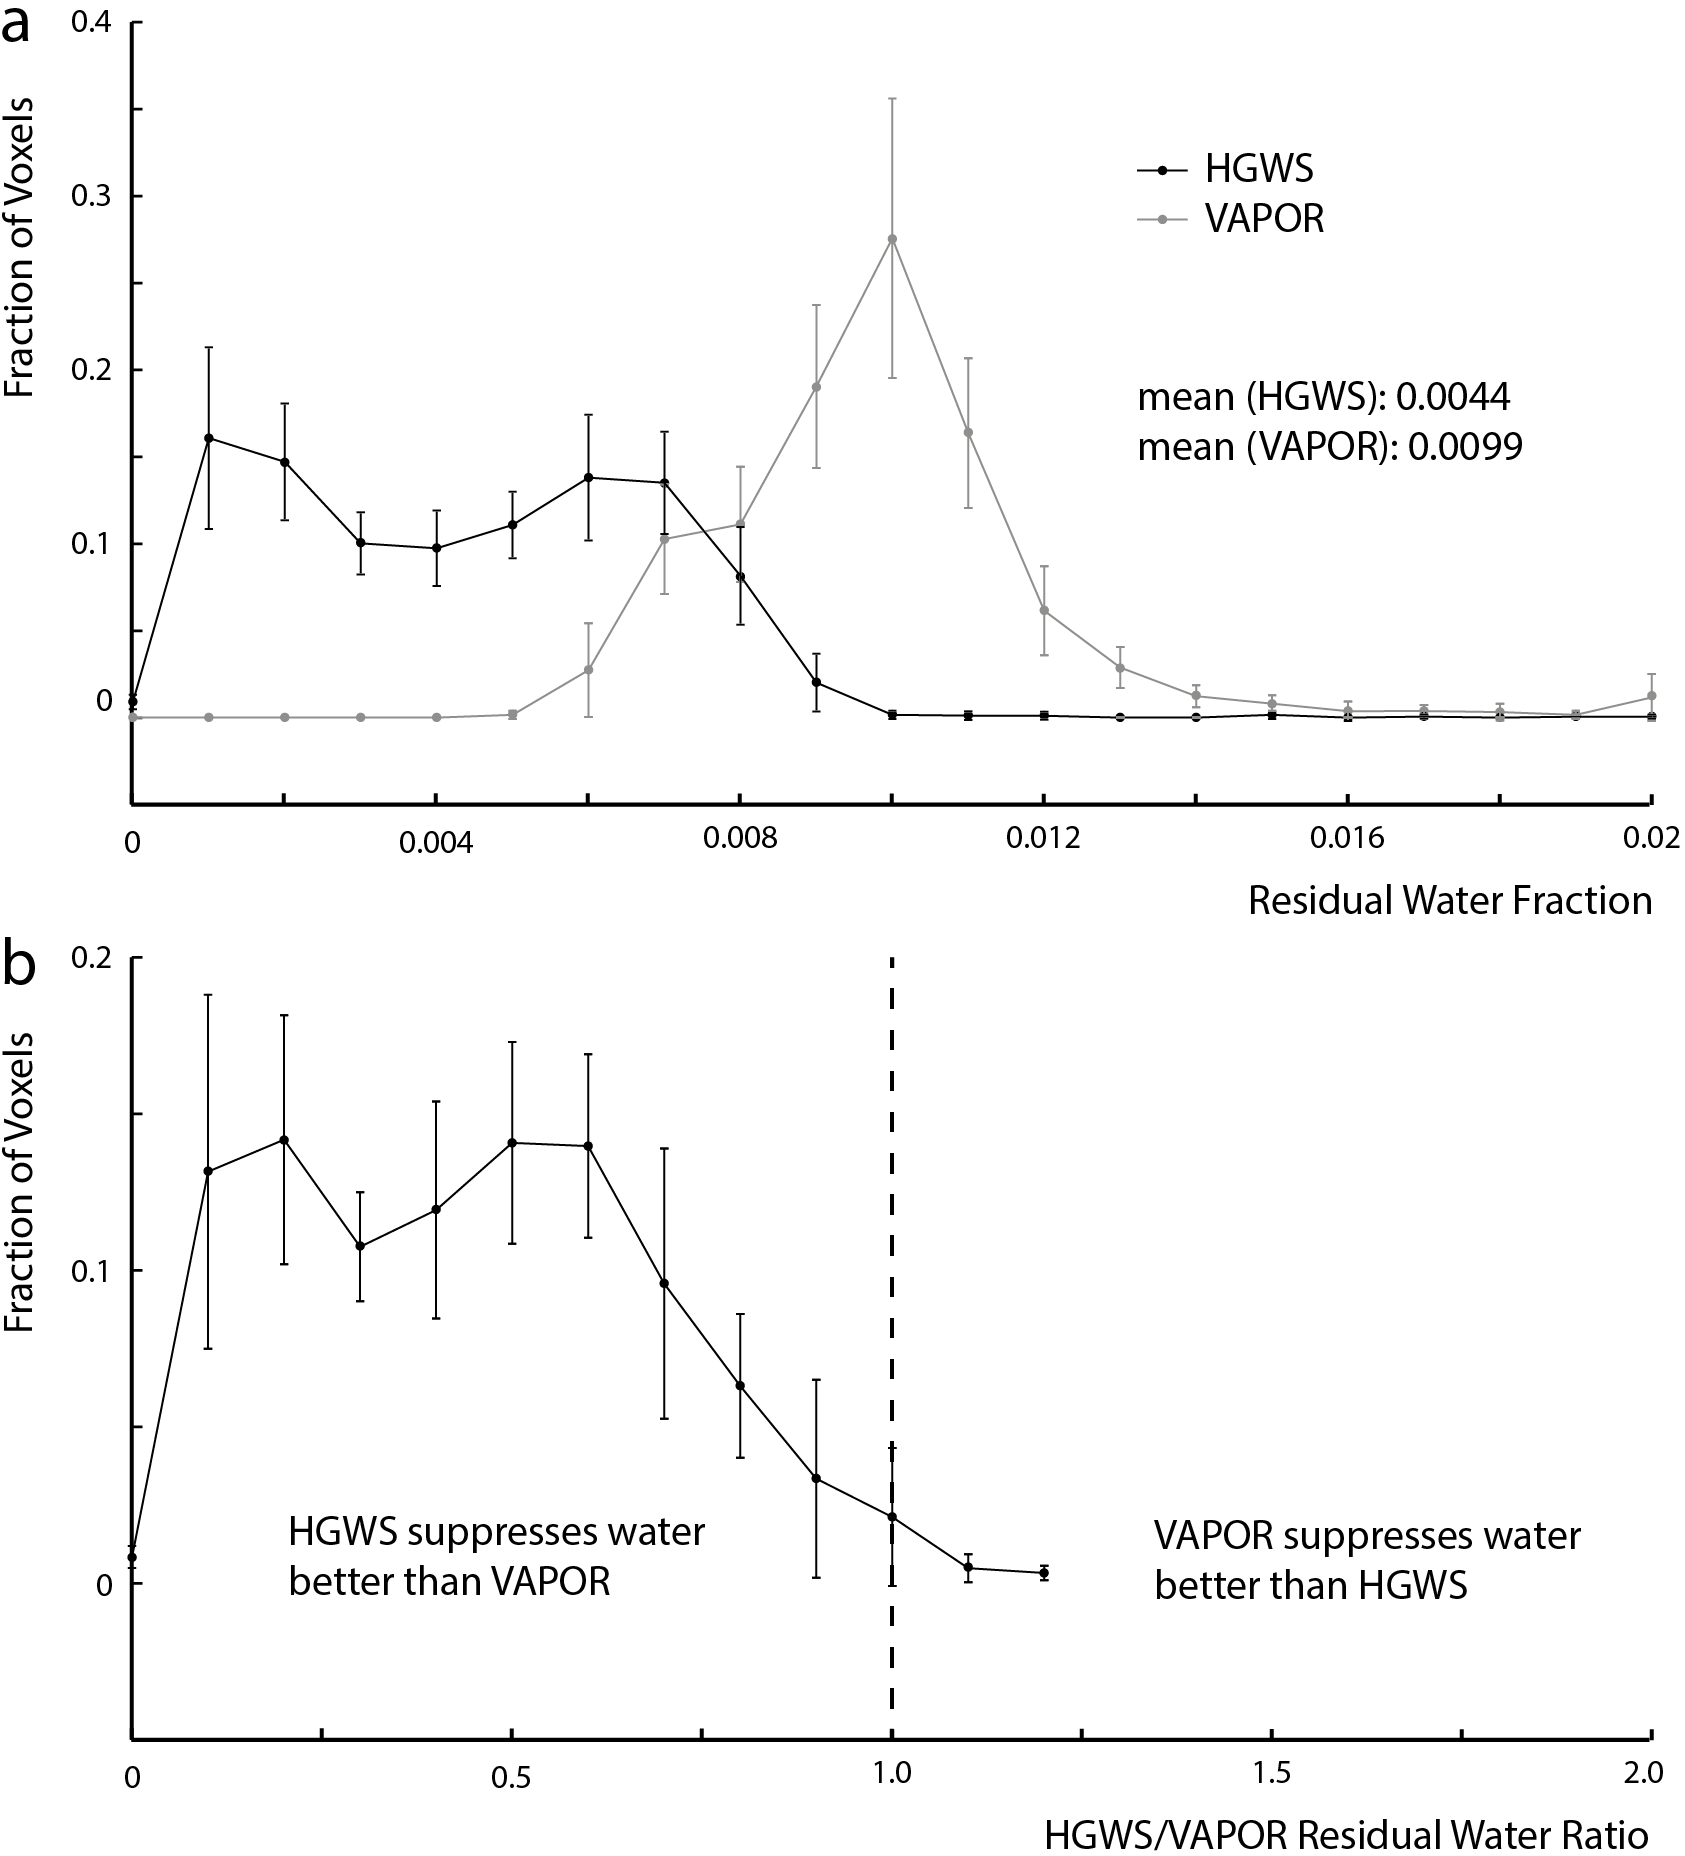
For MRSI, figure 4a shows HGWS and VAPOR residual water maps, and HGWS/VAPOR residual water ratio maps overlaid on the PRESS volume of interest (VOI). Across the VOI, the residual water peak is lower in HGWS than in VAPOR. Figure 4b shows the residual water peaks and spectra from the regions of interest in figure 4a. As in the single voxel experiments, the spectra have equivalent signal intensity relative to VAPOR. In figure 5a, the distribution of the residual water fractions across subjects shows that HGWS is skewed toward lower values with the mean residual water fraction 2.3 times lower when using HGWS versus VAPOR. HGWS performs better than VAPOR in most voxels with the HGWS/VAPOR residual water ratio less than one in 98.9% of voxels (figure 5b).
Discussion
HGWS has robust water suppression, is of relatively short duration, and performs better than VAPOR, despite having fewer RF pulses. Simulations demonstrate that the sequence is relatively insensitive across the range of T1 and B1 variations likely to be found in vivo in the human brain at 3T. This was confirmed in experiments in vivo for both single-voxel and multi-voxel measurements. This water suppression effectiveness and reduced duration relative to VAPOR makes the sequence especially suited for fast MRSI sequences (e.g. multi-slice MRSI (1)) where insensitivity to B1 inhomogeneity and minimization of the presaturation sequence duration is necessary.Acknowledgements
This work was supported by P41 EB015909.References
1. Zhu H et al. Magn. Reson. Med.
2010;63:1486–1492.
2. Ogg RJ et al. J. Magn. Reson. Ser. B
1994;104:1–10.
3. Tkác I et al. Magn. Reson. Med. 1999;41:649–56.
4. Ouwerkerk R. et al. Int. Soc. Magn. Reson. Med.
2007;15:1674.
5. Rosenfeld D et al. Magn. Reson. Med.
1997;37:793–801.
Figures
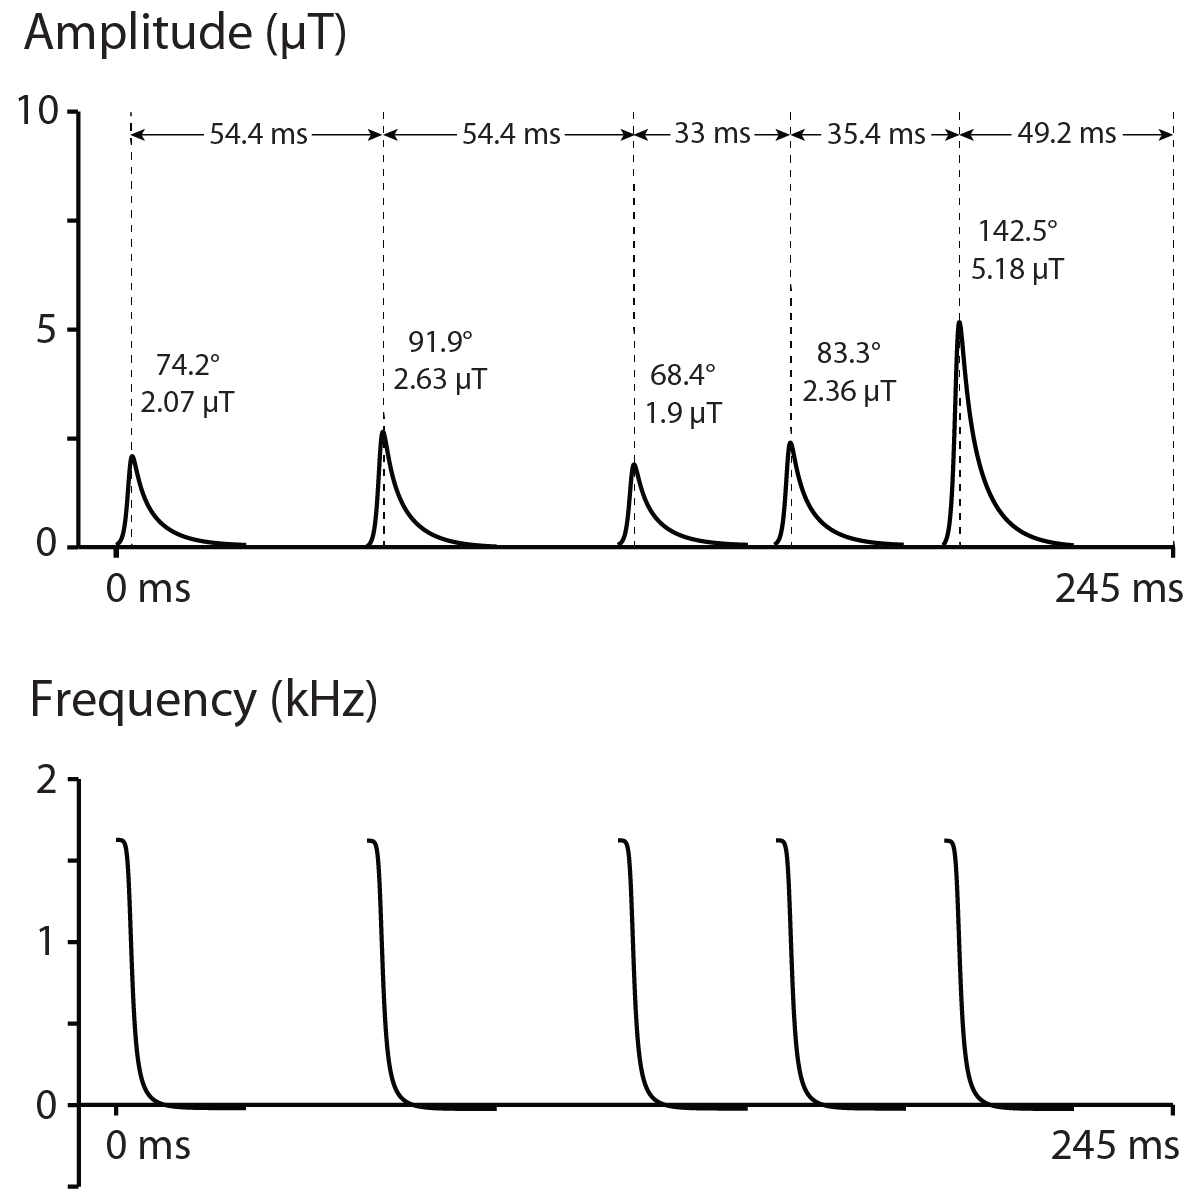
Schematic diagram of the HGWS sequence showing the delays (ms) and amplitudes (mT) of the RF pulses. The total duration of the HGWS water suppression sequence is 245 ms which is significantly shorter than the total duration of 750 ms for VAPOR.