1065
Direct signal detection of exchangeable protons of metabolites with high SNR using ultrashort-TE, short-TR 1-H MRSI without water presaturation1FB02 (Chemistry), University of Bremen, Bremen, Germany, 2Inegrative Ecophysiology, Alfred Wegener Institute Helmholtz Centre for Polar and Marine Research, Bremerhaven, Germany
Synopsis
Chemical exchange saturation transfer (CEST) is a powerful technique for inverse metabolic imaging and non-invasive pH measurements, and is most efficient in the intermediate exchange regime between protons of metabolites and water. We examined the use of ultrashort-TE, short-TR MRSI for the direct signal detection of exchangeable protons of metabolites. If water is not saturated, fresh z-magnetization is transferred to the protons of metabolites, allowing a high SNR despite short TR. This approach was evaluated by simulations and measurements on creatine phantoms using solutions with different pH, demonstrating direct signal detection for exchange rates up to ~1000 s-1.
Introduction
Chemical exchange saturation transfer (CEST)1,2 is a powerful technique for inverse metabolic imaging and non-invasive pH measurements. CEST MRI exploits the asymmetry if the water signal is measured after presaturation at positive and negative offset frequencies with respect to water. The CEST asymmetry is predominantly determined by the ratio between the exchanging spin pools and the exchange rate from protons of amide (–NH), amine (–NH2) or hydroxyl (–OH) groups of metabolites to protons of bulk water. CEST MRI has been demonstrated for numerous metabolites, e.g., glutamate3, glucose4 or creatine5,6, and is most efficient in the intermediate exchange regime. If the exchange rates are too high, the necessary saturation cannot or only partially be achieved. For low exchange rates, the decrease in the water signal is rather small making quantitative data evaluation difficult. In this study, we have examined the use of ultrashort-TE, short-TR MR spectroscopic imaging (MRSI) for the direct signal detection of exchangeable protons of metabolites. If water is not excited at all, fresh z-magnetization is transferred to the exchanging protons of metabolites prior to the subsequent RF excitation, allowing a high signal intensity despite short TR. This approach has been evaluated by numerical simulations and measurements on phantoms consisting of creatine (Cr) solutions with different pH values.Method and Experimental
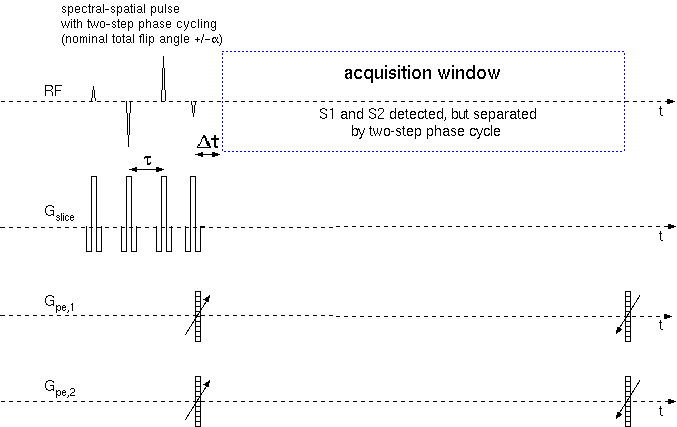
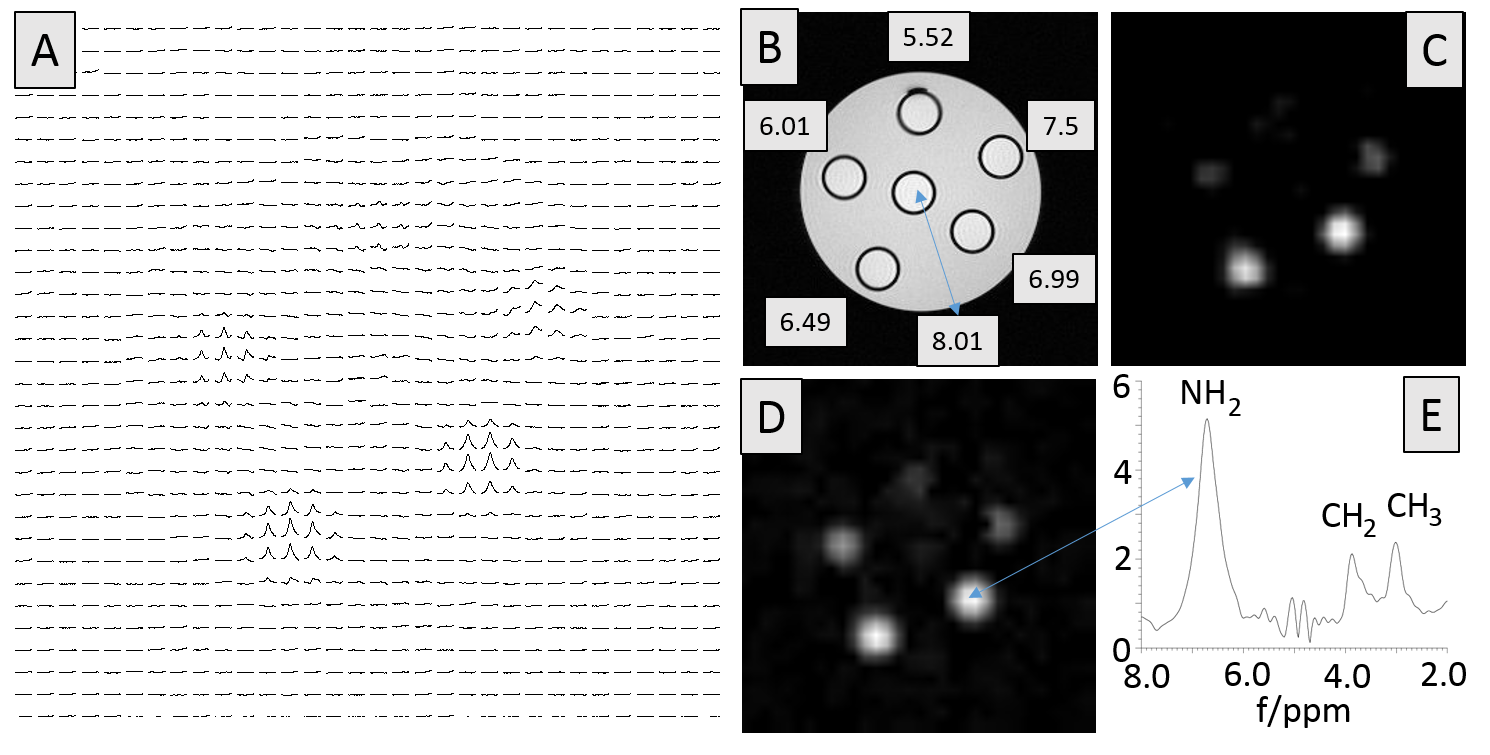
The scheme of the MRSI pulse sequence is displayed in Fig. 1. A spectral-spatial pulse derived from composite pulses excites the metabolite signals upfield and downfield from water, but leaves the water magnetization unaffected. Starting with standard 1-2-1 and 1-3-3-1 sequences, asymmetric composite pulses (e.g., 5.643°-28.416°-39.549°-17.040°) were calculated by numerical optimization as a compromise between the spectral profile and losses by chemical exchange. Ultrashort-TE, short-TR single-slice MRSI was achieved by spatial phase encoding (260 μs) followed by data acquisition. Prolonging the delay Δt between the last RF pulse and data acquisition allows for suppressing signals of rapidly exchanging protons for improved specificity. A two-step phase cycle was used to separate the FID-like signal S1 from the FID-like signal S2 of the SSFP MRSI sequence7. Typical sequence parameters were: TR=25-50 ms, FOV: 40mmx40mm, 5mm slice thickness, 204.8 μs sech-pulses, interpulse delay τ=833.3 μs, Δt=365-1000 μs, SW=14 kHz, 256 or 512 complex data points. Simulations of the pulse sequence were carried out in Scilab 6.00 (scilab.org) based on the Bloch-McConnell equations8. All measurements were performed on a 7T animal scanner (Bruker 70/20) equipped with BGA12S2 gradients (440 mT/m/ms, 130 μs) and a birdcage resonator (72mm i.d.). Data processing was performed by programs written in IDL (Exilis, USA). Beside standard processing steps, the matrix pencil method (MPM) was used for extracting water signals9 prior to FFT in the time domain. The phantom (T=18.5 °C) consisted of six 5mm NMR tubes embedded in agarose and filled with 10 mM Cr aqueous solutions with different pH values (5.52,6.01,6.49,6.99,7.50,8.01).Results and Discussion
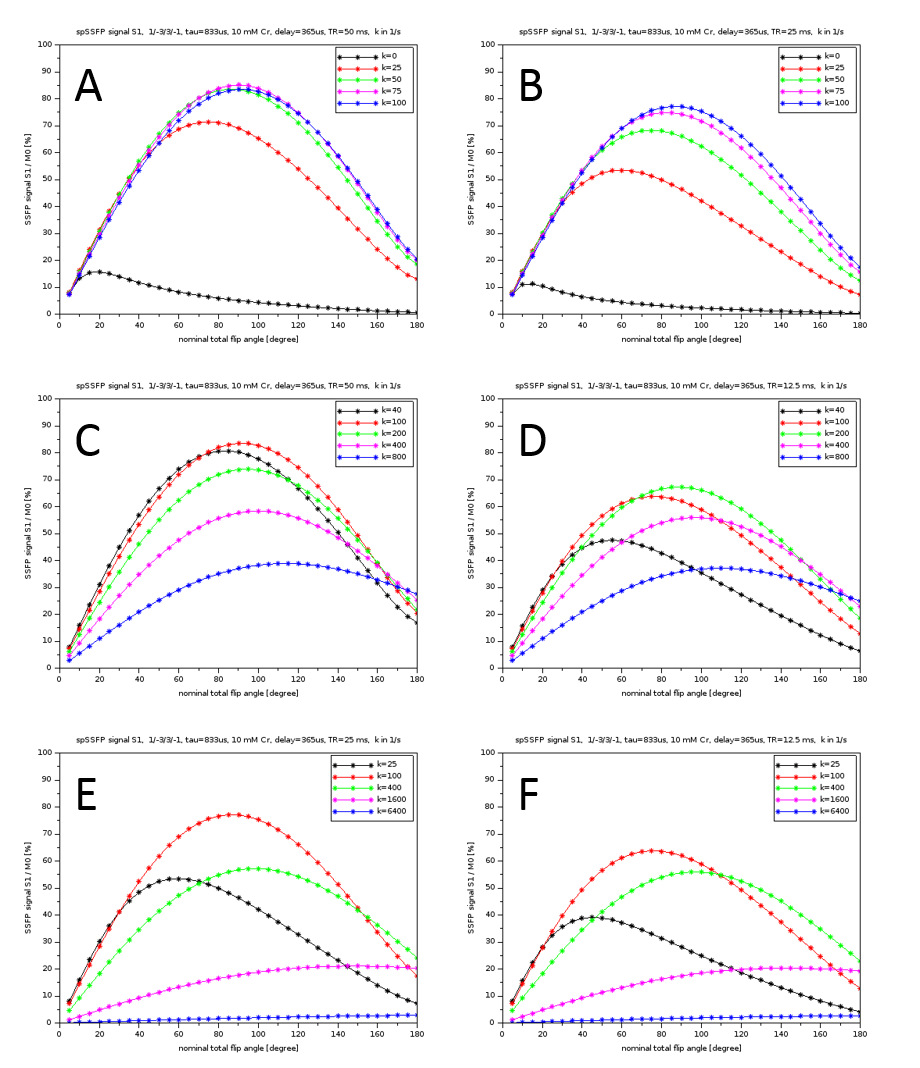
Figure 2 shows simulations of the MRSI sequence for different exchange rates k and a nominal total excitation angle of 5°-180° for short TR values (50-12.5 ms). High signal intensities are obtained for exchange rate up to ~1000 s-1. Considering averaging effects, high SNR values per unit measurement time can be achieved, although the linewidth increases with increasing k, thus reducing the SNR in the frequency range. The signal dependence on k and the nominal flip angle indicates that varying the sequence parameters will, in addition to the measured linewidth, allow estimating the exchange rate and thus pH. For a reliable spectrum evaluation, including downfield signals of exchangeable protons, the quality of water suppression is of central importance. This was achieved by combining the minimal excitation of water signals by optimized spectral-spatial pulses with the extraction of water signals during postprocessing using MPM. In the phantom measurements (cf., Fig.3), downfield signals of Cr were detected for 5.5-7.5 pH, with highest signal intensities for 6.5-7.0 pH. For 8.0 pH, the k value was too high. These findings are in good agreement with the simulation results, considering published exchange rates for Cr6, i.e. k-values of 4.3, 14, 35, 135, 430, 1360 s-1 obtained by interpolation for T=18.5 °C and pH 5.5, 6.0, 6.5, 7.0, 7.5, 8.0, respectively.Conclusion
Ultrashort-TE, short-TR MRSI with optimized spectral-spatial RF pulses and adjusted data processing allows the direct detection of downfield signals of exchangeable protons, particularly for exchange rates up to 1000 s-1. Thus, this approach is a potential alternative to CEST MRI in case of slow or even intermediate exchange rates. This will be of particular interest for CEST applications at lower temperatures10, e.g. for in vivo measurements on marine organisms such as polar fishes.Acknowledgements
No acknowledgement found.References
1. Ward KM, Aletras AH, Balaban RS. A new class of contrast agents for MRI based on proton chemical exchange dependent saturation transfer (CEST). J. Magn. Reson. 2000;143:79-87.
2. Zhou J, van Zijl PCM. Chemical exchange saturation transfer imaging and spectroscopy. Prog. Nucl. Magn. Reson. Spectrosc. 2006;48:109-136.
3. Cai K, Haris M, Singh A et al. Magnetic resonance imaging of glutamate. Nat. Med. 2012; 18: 302-306.
4. McMahon MT, Kato Y, Liu G et al.. Natural D-glucose as a biodegradable MRI contrast agent for detecting cancer. Magn. Reson. Med. 2012;68:1764-1773.
5. Haris M, Nanga RP, Singh A et al.. Exchange rates of creatine kinase metabolites: feasibility of imaging creatine by chemical exchange saturation transfer MRI. NMR Biomed. 2012;25:1305-1309.
6. Goerke S, Zaiss, M, Bachert P. Characterization of creatine guanidinium proton exchange by water-exchange (WEX) spectroscopy for absolute-pH CEST imaging in vitro. NMR Biomed. 2014;28:507-518.
7. Dreher W, Geppert C, Althaus M, Leibfritz D. Fast proton spectroscopic imaging using steady-state free precession methods. Magn. Reson. Med. 2003;50:453-460.
8. Woessner DE, Zhang S, Merritt ME, Sherry AD. Numerical solution of the Bloch equations provides insights into the optimum design of PARACEST agents for MRI. Magn. Reson. Med. 2005;53:790-799.
9. Lin YY, Hodgkinson P, Ernst M, Pines A. A novel detection-estimation scheme for noisy NMR signals: applications to delayed acquisition data. J. Reson. Magn. 1997;128:30-41.
10. Wermter FC, Bock C, Dreher W. Investigating GluCEST and its specificity for pH mapping at low temperatures. NMR Biomed. 2015;28:1507-1517.
Figures