1064
Reproducibility and clinical feasibility of diffusion-weighted MRS using sLASER and STEAM in the human brain in vivo at 3T1Brain and Spine Institute (ICM), Center for Neuroimaging Research (CENIR), Paris, France, 2Sorbonne Universités, UPMC Univ Paris 06 UMR S 1127, Inserm U 1127, CNRS UMR 7225, Paris, France, 3Center for Magnetic Resonance Research and Department of Radiology, University of Minnesota, Minneapolis, MN, United States, 4C. J. Gorter Center for High Field MRI, Department of Radiology, Leiden University Medical Center, Leiden, Netherlands
Synopsis
Diffusion-weighted MR spectroscopy (DW-MRS) allows disentanglement of different pathological mechanisms of brain tissue by exploiting the specific compartmentation of metabolites in different cell types. In this study, we estimated the reproducibility of metabolite diffusion measures obtained using DW-sLASER and DW-STEAM sequences at 3T. The inter- and intra-subject variability of the apparent diffusion coefficients (ADC) of the three major metabolites, as well as the effect of the acquisition time on the variance of these measures were calculated for both sequences in two brain regions. Power calculations were performed to facilitate the choice of the optimal protocol for specific clinical needs.
Purpose
Diffusion-weighted MR Spectroscopy (DW-MRS) allows investigation of metabolic and microstructural properties of healthy and pathological brain tissue by probing the diffusion of several intra-cellular metabolites in vivo1,2. The choice of the proper sequence to be employed in a DW-MRS study depends on several factors, including an optimal compromise between signal-to-noise ratio (SNR), precision of metabolite quantification, and need for specific diffusion-weighting parameters. While spin-echo sequences provide higher SNR for a given echo time (TE), DW-STEAM allows for long diffusion times keeping short TE, and it has been shown to better quantify diffusion of J-coupled metabolites3. In this study, we calculated the reproducibility of the apparent diffusion coefficients (ADC) of total N-acetyl aspartate (tNAA), total creatine (tCr) and choline compounds (tCho), measured at 3T with both DW-sLASER and DW-STEAM sequences from two brain regions containing mostly white or grey matter. Moreover, we investigated the variance of metabolite diffusion measures as a function of different acquisition times, and provided power calculations useful for planning clinical studies.Methods
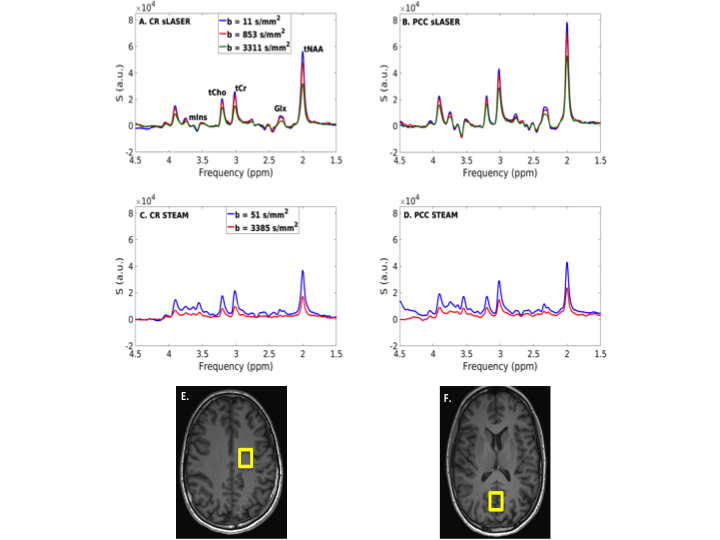
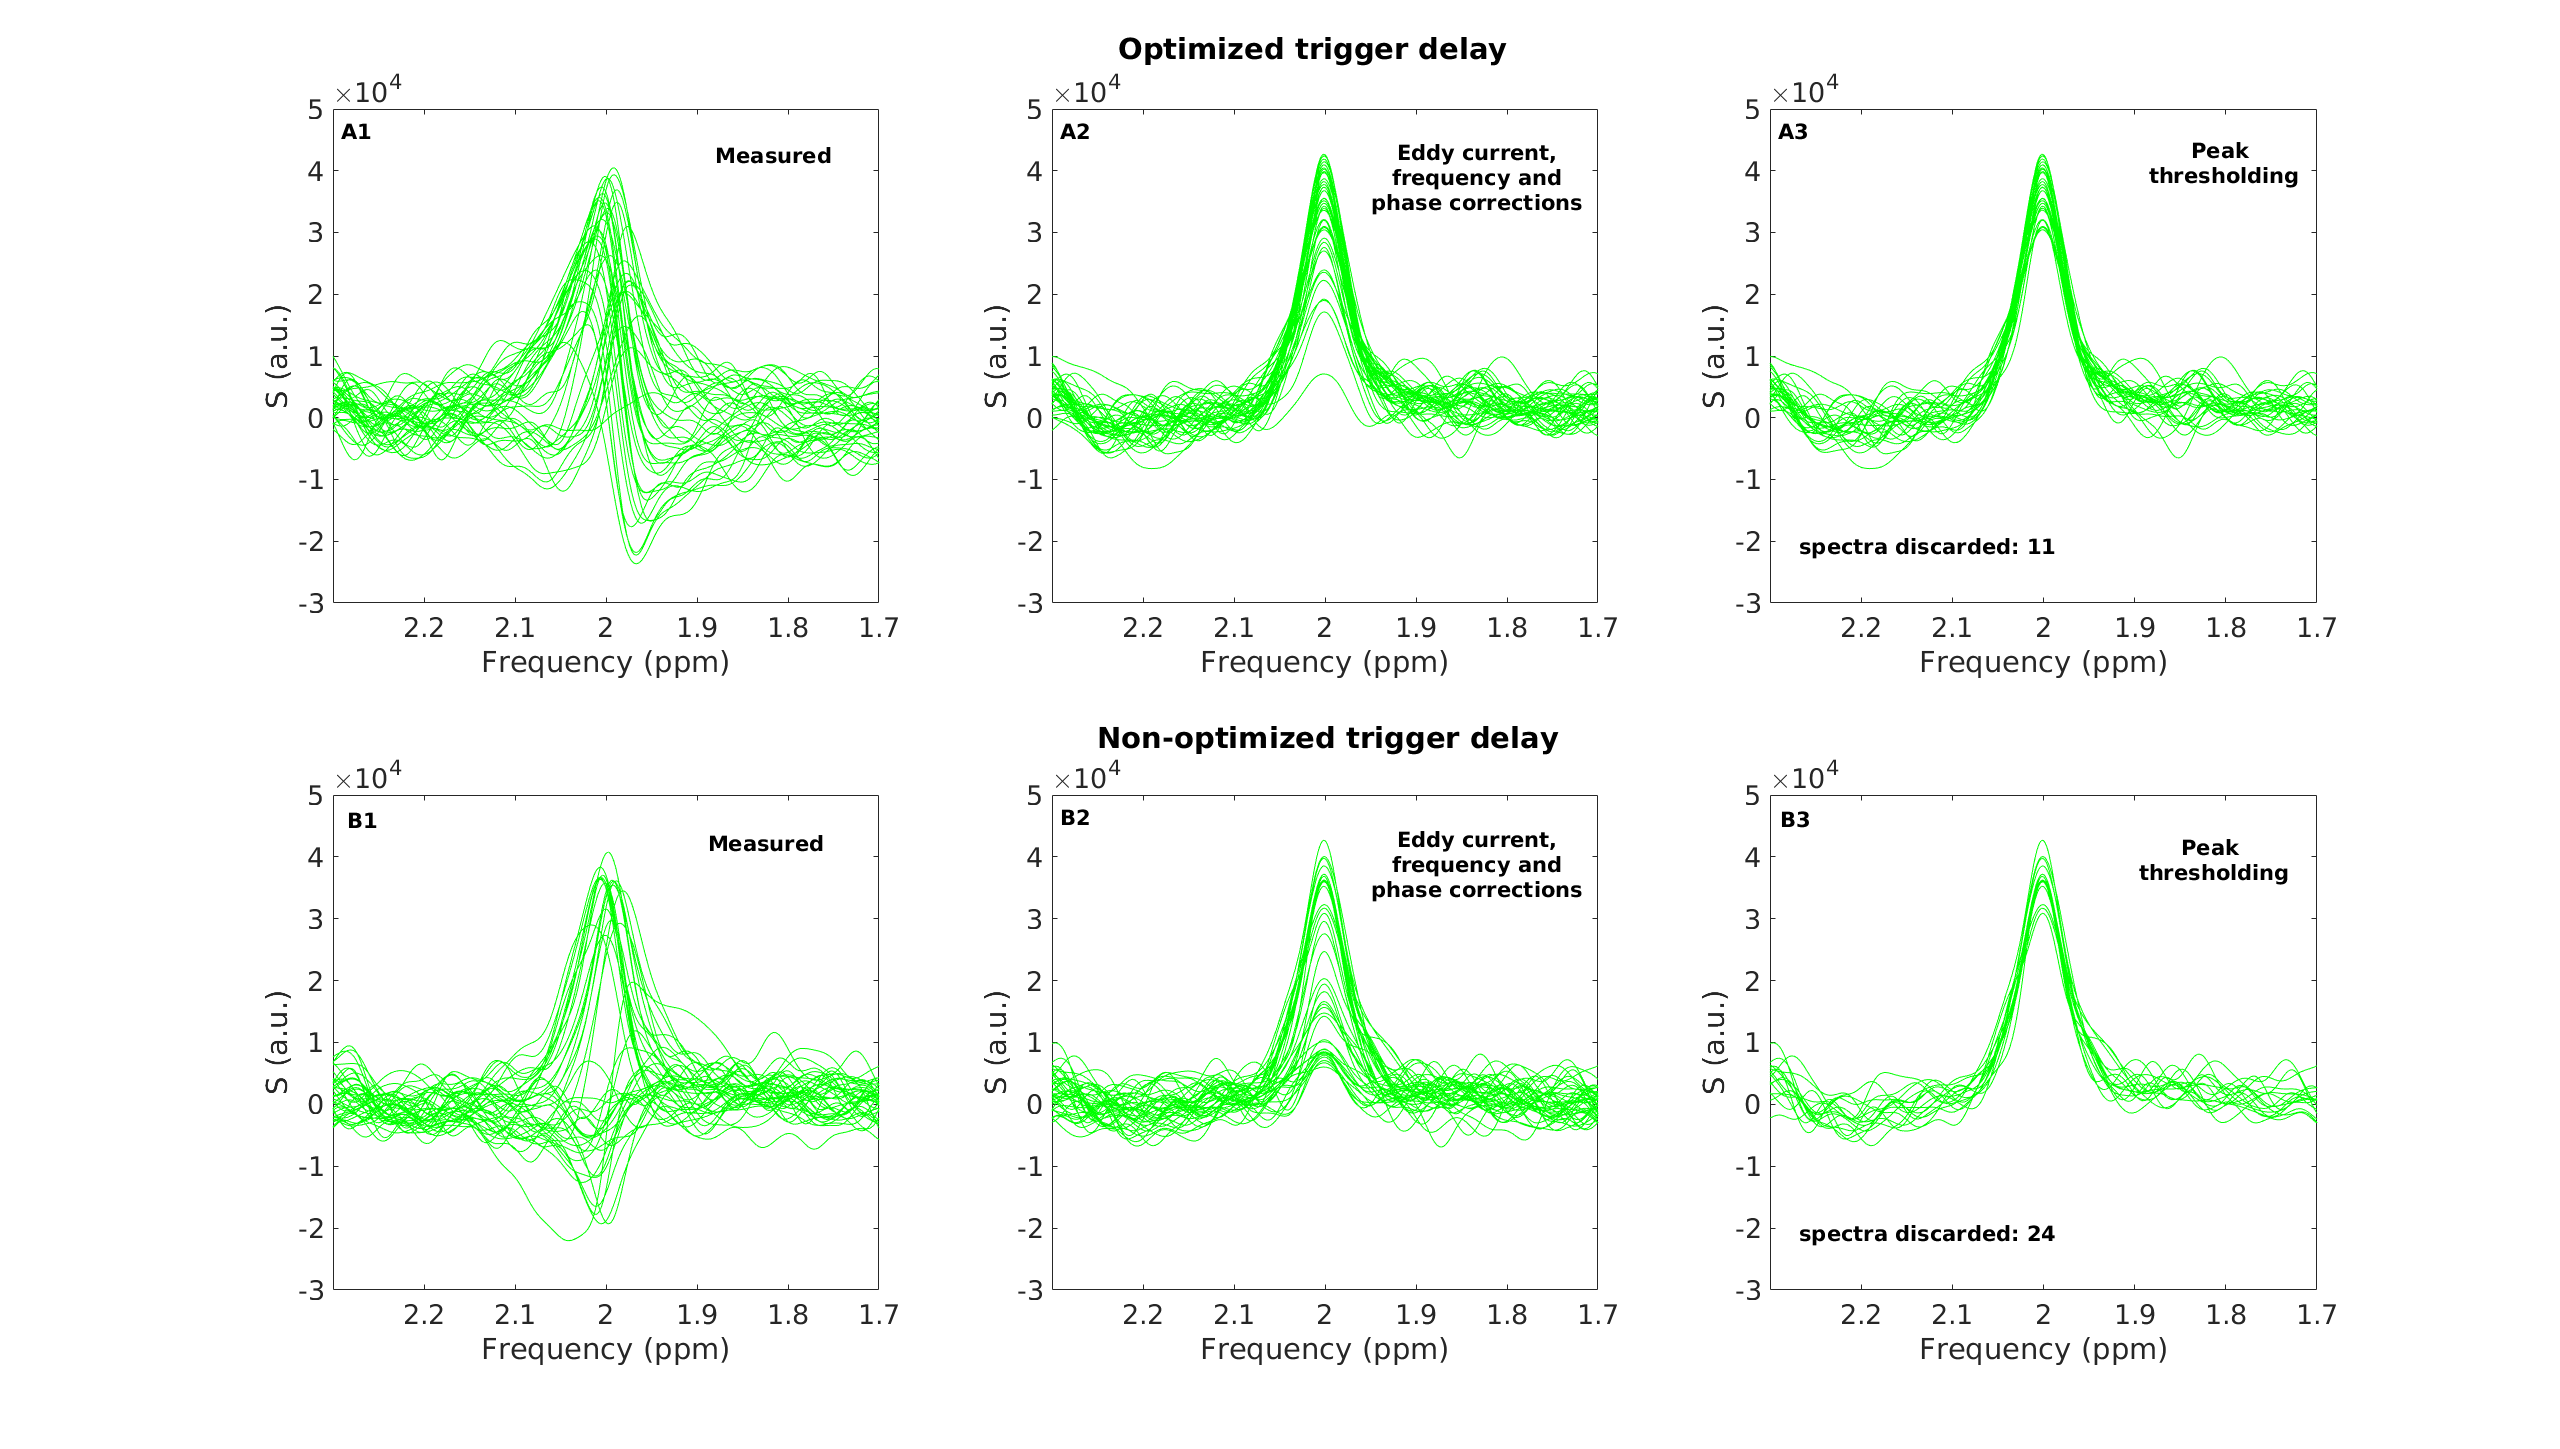
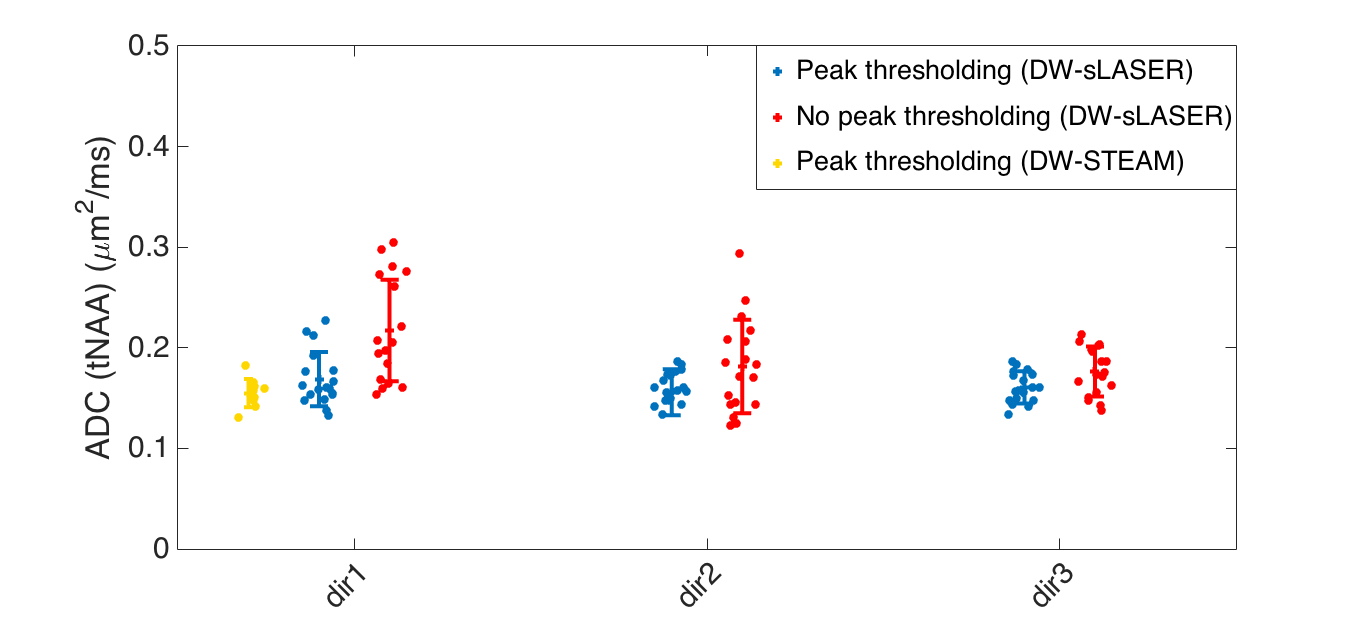
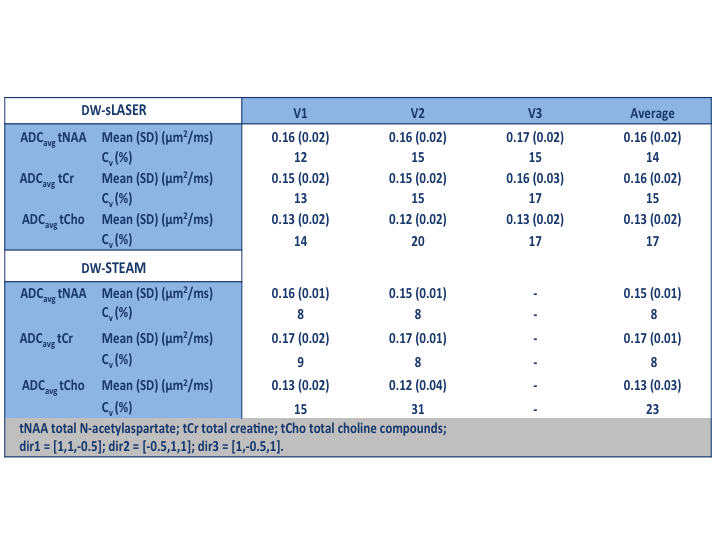
Single-voxel DW-sLASER and DW-STEAM sequences were implemented for a 3T whole-body Siemens Prisma scanner equipped with a 64 channel receive head coil. DW-MRS data were acquired in the corona radiata (CR) and in the posterior cingulate cortex (PCC) of 11 healthy volunteers using a VOI of 8 mL. Each subject was scanned 3 times, using either DW-sLASER or DW-STEAM. For DW-sLASER, diffusion weighting was applied in 3 orthogonal directions with diffusion time ∆ = 60 ms, gradient pulse duration δ = 18 ms, and 3 b-values of 11, 850, 3300 s/mm2 (40 averages per condition). For DW-STEAM, diffusion weighting was applied in one direction with ∆ = 85 and 316 ms, δ = 9 ms, and gradients applied with both positive and negative polarities to minimize cross-terms effects related to background gradients, resulting in a b-value of 3300 s/mm2 (64 averages per condition). TE was 120ms and 30ms for DW-sLASER and DW-STEAM, respectively. The TR was synchronized with cardiac cycles using a pulse-oximeter device and optimized trigger delay. For 2 subjects, partial data were acquired using different trigger delays for optimization. Unsuppressed water data were acquired for eddy current corrections. Phase and frequency corrections on individual spectra were performed before summation. A threshold on tNAA signal intensity was applied to eliminate spectra with low SNR. Metabolite ADCs were estimated from mono-exponential fits of the signal decay induced by the diffusion weighting. LCModel4 was used for metabolite quantification. Metabolite ADCs and their variability as a function of the acquisition time were investigated varying the number of b-values and spectra utilized for analysis (315, 270, 225, 180 and 135). Re-sampling was performed using bootstrapping (150 iterations). Power and coefficients of repeatability (CR) and variation (CV) were calculated for all measures using standard procedures5.Results
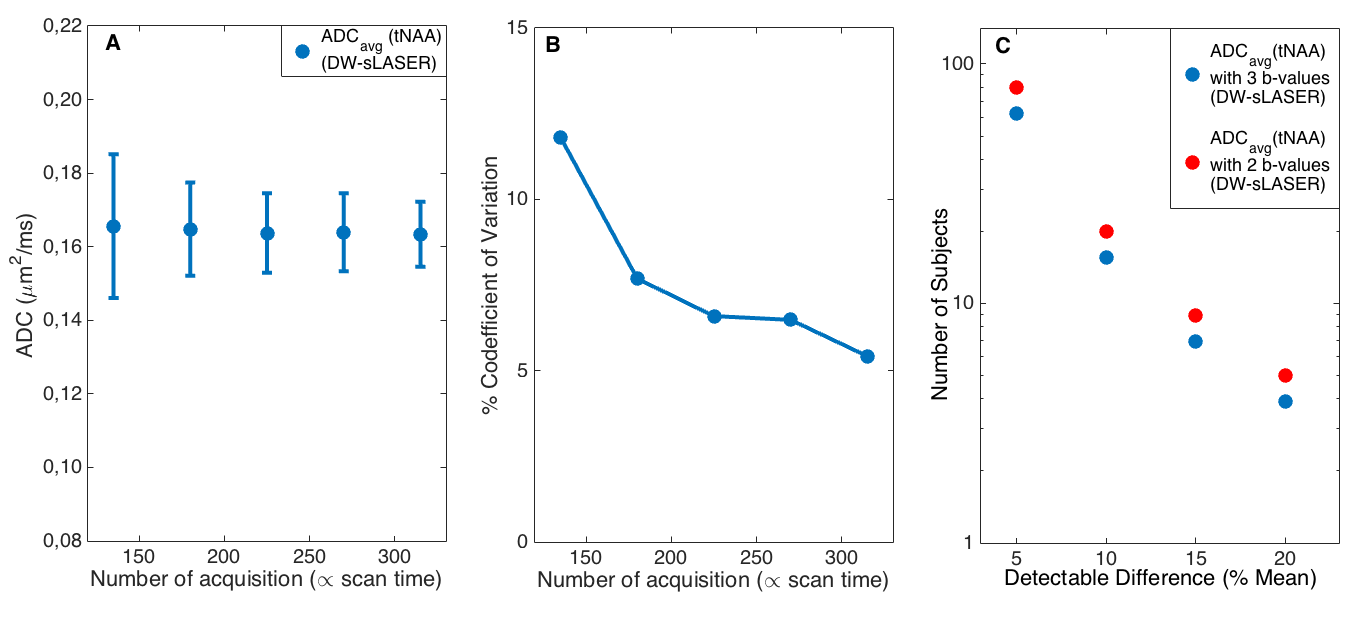
Good quality spectra were obtained in the 2 VOIs using both sequences (Fig. 1). The effect of spectral processing and trigger delay at high b value is shown in Fig. 2: the number of discarded spectra after peak thresholding increased drastically for a non-optimized trigger delay. ADC(tNAA) calculated with and without peak thresholding from all subjects, all sessions, and 3 directions are reported in Fig 3. The variability of the measures was significantly smaller when a threshold on signal intensity was applied and depended on the diffusion direction. Table1 reports, for each session, tNAA, tCr and tCho ADCs, averaged over diffusion directions and subjects. The CR for ADC(tNAA) measured with DW-sLASER was 0.04 mm2/ms (27%) for the full acquisition (14 min) and 0.05 (31%) for the 2-b values acquisition (9 min). Preliminary DW-STEAM data acquired at the shortest ∆ suggested comparable variance of the measures. Power calculations performed for DW-sLASER full and partial data sets suggested that a difference between groups of 10% for ADC(tNAA) in the CR can be detected with groups of 16 or 20 subjects each, respectively (Fig. 4C). Mean ADC(tNAA) and CV estimated for different number of scans in the CR are reported in Figs. 4A and 4B. Similar results were obtained in the PCC (data not shown).Discussion and conclusion
We reported an evaluation of the performance of DW-sLASER sequence, showing acceptable reproducibility for ADC(tNAA) measures in the CR and PCC, in line with a previous study6, and demonstrating the feasibility of DW-MRS in clinical settings. The full study will incorporate an exhaustive comparison between DW-sLASER and DW-STEAM in terms of reproducibility of the 3 major metabolite diffusion measures, sample size calculation, as well as reproducibility of DW-STEAM measures acquired at a long diffusion time of 316 ms.Acknowledgements
The research leading to these results received funding from the programs 'Institut des neurosciences translationnelle' ANR-10-IAIHU-06 and 'Infrastructure d’avenir en Biologie Santé' ANR-11-INBS-0006. MM acknowledges support of following NIH grants: BTRC P41 EB015894, and P30 NS076408.References
[1] K Nicolay et al, Diffusion NMR spectroscopy. NMR Biomed, 14, 94-111 (2001).
[2] Ronen I and Valette J, Diffusion-weighted magnetic resonance spectroscopy. eMagRes. Volume 4. John Wiley & Sons, Ltd, Chichester, United Kingdom, p 733-750 (2015).
[3] Deelchand et al, Apparent diffusion coefficients of the five major metabolites measured in the human brain in vivo at 3T, MRM, in press (2017).
[4] Provencher SW. Estimation of metabolite concentrations from localized in vivo proton NMR spectra. MRM, 30(6): 672–679 (1993).
[5] Bartlett JW and Frost C, Reliability, repeatability and reproducibility analysis of measurement errors in continuous variables. Ultrasound Obstet. Gynecol. 31(4): 466–475 (2008).
[6] Wood ET, Ercan E et al, Reproducibility and optimization of in vivo human diffusion-weighted MRS of the corpus callosum at 3T and 7T, NMR Biomed, 28, 976-987 (2015).
Figures