1060
MEGA-SPICE: A subspace-based approach to high-resolution spectral edited MRSI1Gordon Center for Medical Imaging, Radiology, Massachusetts General Hospital, Harvard Medical School, Boston, MA, United States, 2Nuclear Medicine, West China Hospital, Sichuan University, Sichuan, China
Synopsis
Spectral edited MRS/MRSI is a powerful tool to detect metabolites with J-coupled spins (e.g., GABA and 2-HG) that are otherwise overlapped with other high concentration metabolites (e.g., Cho and Cr). Compared to conventional MRSI, it is even more challenging to achieve high-resolution spectral edited MRSI because of lower metabolite concentration and less time-efficient spatial-spectral encoding. A subspace-based approach, called SPICE (SPectroscopic Imaging by exploiting spatiospectral CorrElation), has been proposed for high-resolution MRSI, producing 3D MRSI images at 3 mm isotropic resolution within 10 mins. We present here a method, termed MEGA-SPICE, for accelerated high-resolution spectral edited MRSI, which is enabled by spectral editing using MEGA pulses and subspace-based data acquisition and processing strategies.
Introduction
Spectral edited MRS/MRSI is a powerful tool to detect metabolites with J-coupled spins (e.g., GABA and 2-HG) that are otherwise overlapped with other high concentration metabolites (e.g., Cho and Cr)$$$^{1-3}$$$. Compared to conventional MRSI, it is even more challenging to achieve high-resolution spectral edited MRSI because of lower metabolite concentration and less time-efficient spatial-spectral encoding$$$^{4-6}$$$. A subspace-based approach, called SPICE (SPectroscopic Imaging by exploiting spatiospectral CorrElation), has been recently proposed for high-resolution MRSI, producing promising 3D MRSI images at 3mm isotropic resolution$$$^{7-11}$$$. We present here a method, termed MEGA-SPICE, for accelerated high-resolution spectral edited MRSI, which is enabled by spectral editing using MEGA pulses and subspace-based data acquisition and processing strategies.Theory
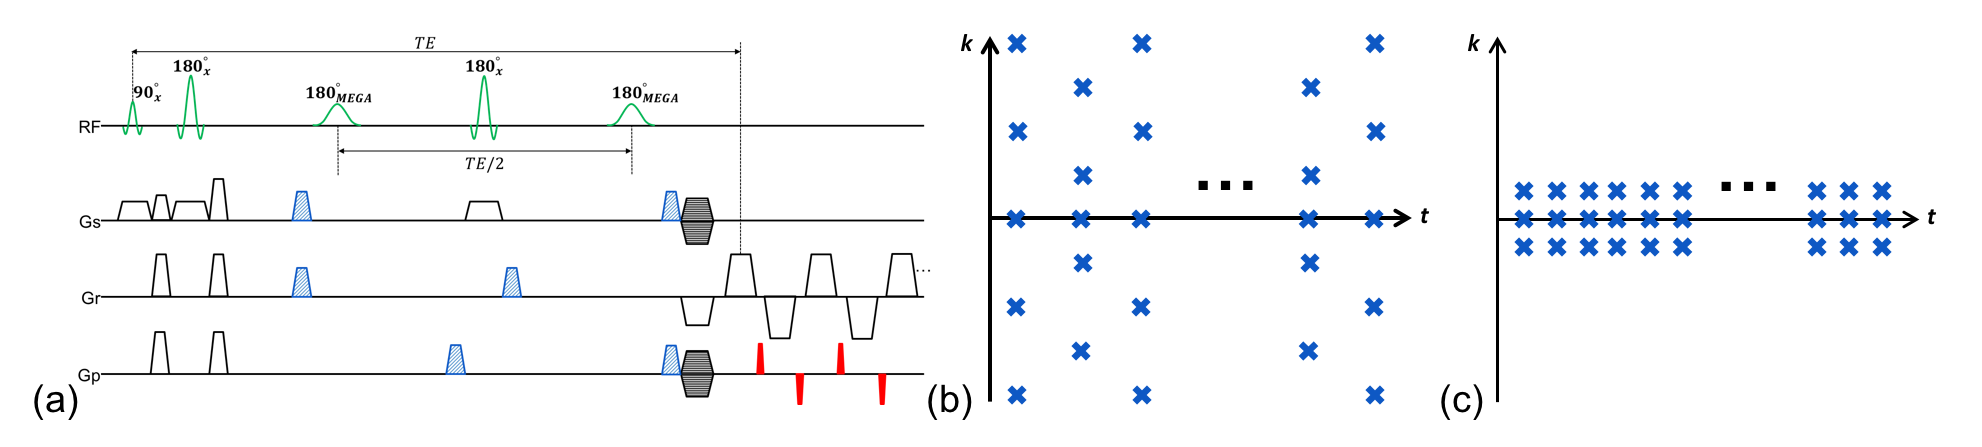
Data acquisition: Two datasets with complementary $$$(k,t)$$$-space coverage are acquired. A MEGA spectral editing sequence (Fig. 1a) with EPSI readouts is used to acquire a high-resolution but sparsely sampled “imaging” dataset. Blipped phase encodings are used to enable simultaneous spectral encoding and spatial encoding in two directions to further accelerate imaging speed. The resultant sampling pattern is shown in Fig. 1b. Note that (k,t)-space is sparsely sampled along both k- and t- axes. The same sequence with either EPSI or CSI acquisitions is also used to obtain a fully sampled (and often high-SNR) “training” dataset which covers only limited k-space (Fig. 1c).
Data processing: We represent the spatial-spectral distribution of an imaging object using partially separable functions$$$^{12}$$$: $$\rho_{OFF}(x,t)=\sum_{m=1}^{M} u_{OFF,m}(x) v_{OFF,m}(t), (1)$$ $$\rho_{DIFF}(x,t)=\sum_{n=1}^{N} u_{DIFF,n}(x) v_{DIFF,n}(t), (2)$$ where "OFF" and “DIFF” denotes the spectrum when the MEGA pulses are "off-resonance" and the edited difference spectrum, respectively, and $$$u_{*}(x)$$$ and $$$v_{*}(t)$$$ are the corresponding spatial and spectral basis functions. This model significantly reduces the number of unknowns, making high-resolution and high-SNR reconstruction from sparsely sampled data possible.
We remove the nuisance water and lipid signals from the acquired data using a union-of-subspaces based method$$$^{13}$$$ and estimate the spectral basis functions $$$v_{*}(t)$$$ from the "training" dataset. We then jointly estimate the spatial basis functions $$$\{u_{OFF,m}(x)\}_m$$$ and $$$\{u_{DIFF,n}(x)\}_{n}$$$ by fitting the model in Eqs. (1,2) to the "imaging" dataset: $$\underset{\{u_{OFF,m}(x)\}_m, \{u_{DIFF,n}(x)\}_{n}}{\arg\max} \parallel (d_{OFF}, d_{DIFF}) - F \{ \rho_{OFF}, \rho_{DIFF} \} \parallel_2^2 + R( \{u_{OFF,m}(x)\}_m, \{u_{DIFF,n}(x)\}_{n} ), (3)$$ where the first term penalizes data consistency in $$$(k,t)$$$-space and the second term is used to incorporate the prior knowledge of the spatial distribution of the metabolites (e.g., joint sparsity or edge information from anatomical images)$$$^{7-11}$$$.
Methods
The proposed method was validated using phantom studies and in vivo studies on healthy subjects (approved by our local IRB) on a 3T Siemens scanner.
In the phantom study, a metabolite phantom was built with five vials mounted in a cylinder jar (in Fig. 2a). The “on” and “off” frequency of the MEGA pulse were set to be 1.9ppm and 7.5ppm, respectively, with a 1.55ppm bandwidth for spectral editing of GABA. For the proposed method, a low-resolution 2D MEGA-CSI sequence was used to acquire a “training” dataset with 16x16x512 spatial-spectral encodings (elliptical sampling), 2000Hz sampling bandwidth, 220x220mm$$$^{2}$$$ FOV, 25mm slice thickness, TE/TR = 68/800 ms and WET water suppression. A high-resolution 3D MEGA-EPSI sequence was used to acquire an “imaging” dataset with 64x64x16 spatial encodings, 128 echoes, 1.82ms echo-spacing, 220X220X64mm$$$^{3}$$$ FOV, and the same TE/TR. This “imaging” dataset was retrospectively undersampled by a factor of 1.5 using the sampling pattern in Fig. 1b before data processing. The imaging parameters of the in vivo experiment were the same except that TR=1000ms, in-plane FOV = 240mm, and saturation bands were used for lipid suppression. The total acquisition time of the proposed method (after retrospectively sampling) was 22 min and 27 min for the phantom and in vivo experiment, respectively.
Results
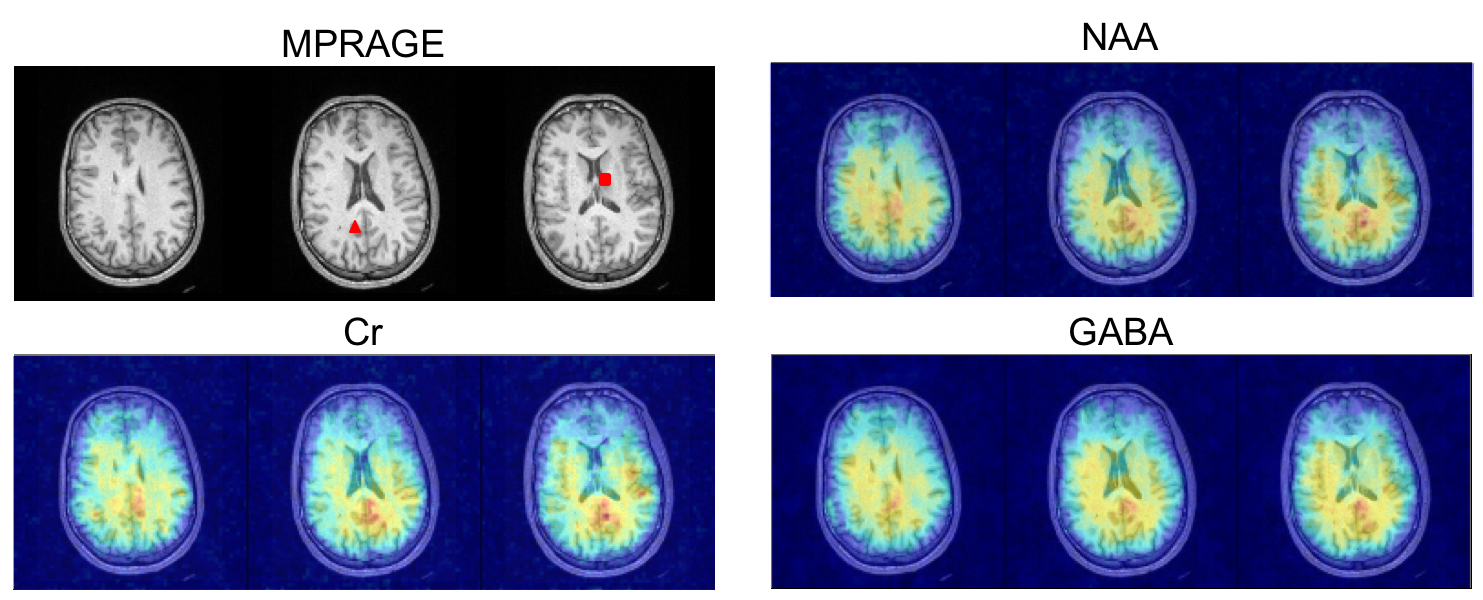
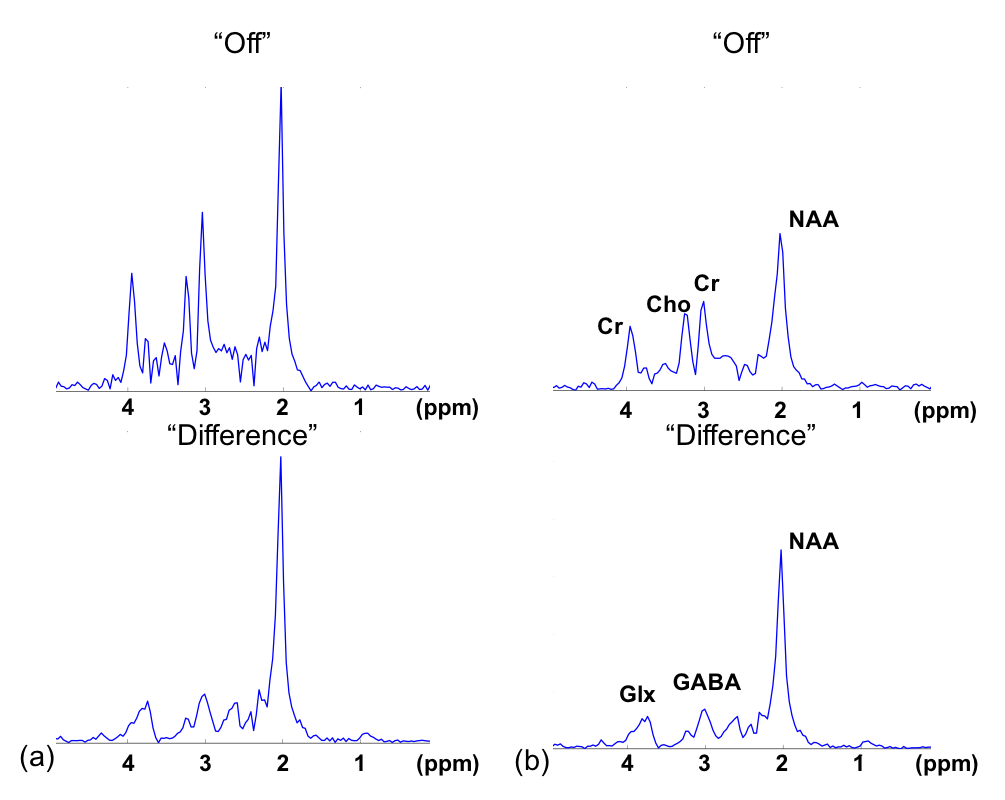
Figure 2 shows the maps of NAA, Cho and GABA from three representative slices obtained by the proposed method (3.4x3.4x4 mm$$$^{3}$$$ nominal resolution) and an equivalent-acquisition-time 3D CSI method (15.7x15.7x8 mm$$$^{3}$$$ nominal resolution). The proposed method clearly resolved the five vials with different combination of metabolite concentrations. Figure 3 shows the corresponding representative spectra, where the proposed method produced high-quality spectra with SNRs even compatible to the CSI results. Figures 4 and 5 shows the results from the in vivo experiment. The NAA, Cr and GABA maps from three representative slices showed expected contrast between the gray matter, white matter and CSF. The GABA and Glx peaks were clearly seen in the representative difference spectra.Conclusions
We present a novel method for high-resolution spectral edited MRSI by extending subspace-based data acquisition and processing strategies to spectral edited MRSI. It could enable new applications of spectral edited MRSI, e.g., in neuroscience studies and in brain tumor imaging applications.Acknowledgements
This work was partially supported by the National Institutes of Health (T32EB013180, R01CA165221, R21EB021710, and P41EB022544), the Federal Share of Program Income earned by MGH on C06 CA059267, and National Natural Science Foundation of China (81471692).References
1. Puts NAJ and Edden RAE. In vivo magnetic resonance spectroscopy of GABA: A methodological review. Progress in Nuclear Magnetic Resonance Spectroscopy, 2012;60:29-41.
2. Mullins PG, et al. Current practice in the use of MEGA-PRESS spectroscopy for the detection of GABA. Neuroimage 2014;86:43-52.
3. Andronesi OC, et al. Detection of 2-Hydroxyglutarate in IDH-Mutated Glioma Patients by In Vivo Spectral-Editing and 2D Correlation Magnetic Resonance Spectroscopy. Science Translational Medicine, 2012;4:116ra4.
4. Bogner W, et al. 3D GABA imaging with real-time motion correction, shim update and reacquisition of adiabatic spiral MRSI. Neuroimage 2014;103:290-302.
5. Zhu H, et al. High Resolution Spectroscopic Imaging of GABA at 3 Tesla. Magnetic Resonance in Medicine 2011;65:603-609.
6. Dydak U, et al., High-Speed GABA Mapping in Human Brain with MEGA-PEPSI at 3 Tesla. In Proceedings of ISMRM 2010, p. 916.
7. Lam F and Liang ZP. A subspace approach to high-resolution spectroscopic imaging. Magnetic Resonance in Medicine 2014;71:1349-1357.
8. Lam F, et al. High-resolution 1H-MRSI of the brain using SPICE: Data acquisition and image reconstruction. Magnetic Resonance in Medicine 2016;76:1059-1070.
9. Ma C, et al. High-resolution 1H-MRSI of the brain using short-TE SPICE. Magnetic Resonance in Medicine 2017;77:467-479.
10. Ma C, et al. High-Resolution Dynamic 31P-MRSI Using a Low-Rank Tensor Model. Magnetic Resonance in Medicine 2017;78:419-428.
11. Peng X, et al. Simultaneous QSM and metabolic imaging of the brain using SPICE. Magnetic Resonance in Medicine 2017. DOI: 10.1002/mrm.26972.
12. Liang ZP. Spatiotemporal imaging with partially separable functions. In Proc. IEEE ISBI, USA, 2007;988-991.
13. Ma C, et al., Removal of Nuisance Signals from Limited and Sparse 1H MRSI Data Using a Union-of-Subspaces Model. Magnetic Resonance in Medicine 2016;75:488-497.
Figures