1059
Combining multi-band slice selection with COKE (COherent K-t-space EPSI) for accelerated spectral imagingRita Schmidt1,2, Amir Seginer3, and Assaf Tal3
1Radiology, Leiden University Medical Center (LUMC), Leiden, Netherlands, 2Neurobiology, Weizmann Institute of Science, Rehovot, Israel, 3Chemical physics, Weizmann Institute of Science, Rehovot, Israel
Synopsis
One of the powerful techniques for faster spectroscopic imaging acquisition is so called proton echo planar spectroscopic imaging (EPSI). An alternative method, which we here term COKE (COherent K-t space EPSI), relies on interleaving “blipped” PE gradients in between readouts to produce coherent phase between the k-t space lines. COKE enables to double the SW in comparison to EPSI or to halve the acquisition duration. We designed a sequence that integrates a multi-band CAIPIRINHA with COKE acquisition for faster spectroscopic imaging. This was demonstrated in both phantoms and in-vivo.
Introduction
Magnetic resonance spectroscopic imaging (MRSI) is a value added modality, augmenting structural scans with metabolic spatial information. However, it usually requires long scan durations. One of the powerful techniques for faster acquisition is so called proton echo planar spectroscopic imaging (EPSI), which delivers spectroscopic and 1D spatial information in a single excitation (Fig. 1a), with additional spatial dimensions undergoing phase encoding1-3. EPSI trajectories suffer from undesired inconsistencies between readout lines acquired with alternating positive and negative gradients4. To overcome this, the positive and negative readouts are conventionally processed individually5 and then combined, at the cost of halving the spectral width (SW); or a flyback readout is used6, foregoing the negative readouts. An alternative method7, which we here term COKE (COherent K-t space EPSI), relies on interleaving “blipped” PE gradients in between readout lines in order to produce coherent phase between the k-t space readout lines (for a given PE). COKE introduces phase inconsistencies along the PE dimension, but these are straightforward to correct as shown in many EPI reconstruction schemes8. The full COKE readout (Fig. 1b) doubles SW in comparison to EPSI. In an alternative realization, denoted here as “diet” COKE (Fig. 1c), the SW is halved, yielding the equivalent EPSI dataset at half the acquisition time. In this work, we integrated multi-band CAIPIRINHA slice selection9 with the COKE interleaved PE gradients. By introducing dual-band CAIPI COKE (Fig. 1d) and dual-band CAIPI “diet” COKE (Fig. 1e) sequences, one can further accelerate the measurement two-fold.Methods
We implemented and compared EPSI, COKE, diet COKE, and dual-band CAIPI variants (Figs. 1a-e) in phantoms and in human volunteers at 3T (Tim Trio, Siemens, Erlangen). Note that, in order to integrate the multi-band CAIPIRINHA into COKE, one must switch the slice-selection gradient’s polarity between the even and odd PE lines, respectively, since COKE interleaves the PE lines during each excitation. The reconstruction of the data includes reordering and phase corrections due to PE and CAIPI phase shifts. We compared EPSI, diet-COKE and dual-band diet-COKE in phantoms mimicking brain metabolites and in a fat/water phantom (based on white cheese and oil). The single-band excitation pulse used was an SLR-90° with bandwidth-time product of 18 and duration of 3.8 ms, whereas the dual-band excitation pulse in Fig. 1d,e was based on SLR-90° with a bandwidth-time product of 12 and duration of 5 ms. The metabolite phantom included 10mM L-Glutamic acid, 10mM Creatine 8mM myo-Inositol, 2mM GABA, 2mM Choline chloride, 5mM Choline chloride, 5mM Sodium lactate 12.5mM NAA and 0.5mL Gd for short T1 (T1 of water was 625 ms). The relevant scan parameters are summarized in the relevant figure captions.Results
Fig. 2 shows phantom results comparing “diet” COKE and EPSI. EPSI data was reconstructed using odd readouts only for spectrum quality comparison of COKE reconstruction and equivalent SNR evaluation (having the same as “diet” COKE SNR∕√2). The measured SNR ratio was 1.06, which is close to the expected factor of unity. Fig. 3 demonstrates dual-band “diet” COKE phantom results for spectroscopic imaging, with the brain mimicking phantom and the fat/water phantom. A 5 cm gap between the slices was introduced to ensure their contents differ sufficiently and for clarity of presentation; however, the sequence works also well for adjacent slices (not shown), as was shown before with CAIPIRINHA implementation8. Fig. 4 shows in-vivo brain MRSI acquisition using dual-band COKE implementation, showing it is capable of producing multi-slice spectroscopic images (with an acceleration factor of two due to dual-band and using the double SW versus EPSI).Conclusions
In this study, we designed a sequence that integrates a multi-band CAIPIRINHA with COKE acquisition for faster MRSI. This was demonstrated in both phantoms and in-vivo. Alternatively, dual-band COKE can be used to double the SW of EPSI, which is a limiting factor in-vivo, particularly at ultrahigh (≥7T) fields where SW requirements can become prohibitive.Acknowledgements
We are grateful to Osnat Volovyk for preparation of the phantom mimicking brain metabolites. We acknowledge the Monroy-Marks Career Development Fund and the historic generosity of the Harold Perlman Family.References
[1] Mansfield, P. (1984) Magn. Reson. Med., 1(3), 370-386, [2] Posse, S., et.al (1997) Magn. Reson. Med., 37(6), 858-865, [3] Lin F. H., et.al. (2007) Magn. Reson. Med., 57(2), 249-257, [4] Posse, et.al. (2013) J. Magn. Reson. Imag., 37(6), 1301-1325, [5] Posse S., et al. (1994) Radiology, 192, 733-738, [6] Cunningham C.H. et. al. (2005) Magn. Reson. Med.,54,1286–1289, [7] Webb P., et.al. (1989) Magn. Reson. Med., 12(3), 306-315,[8] Chen N., et. al. (2004) Magn. Reson. Med., 51,1247–1253, [9] Setsompop K., et.al. (2012) Magn. Reson. Med., 67(5), 1210-1224.Figures
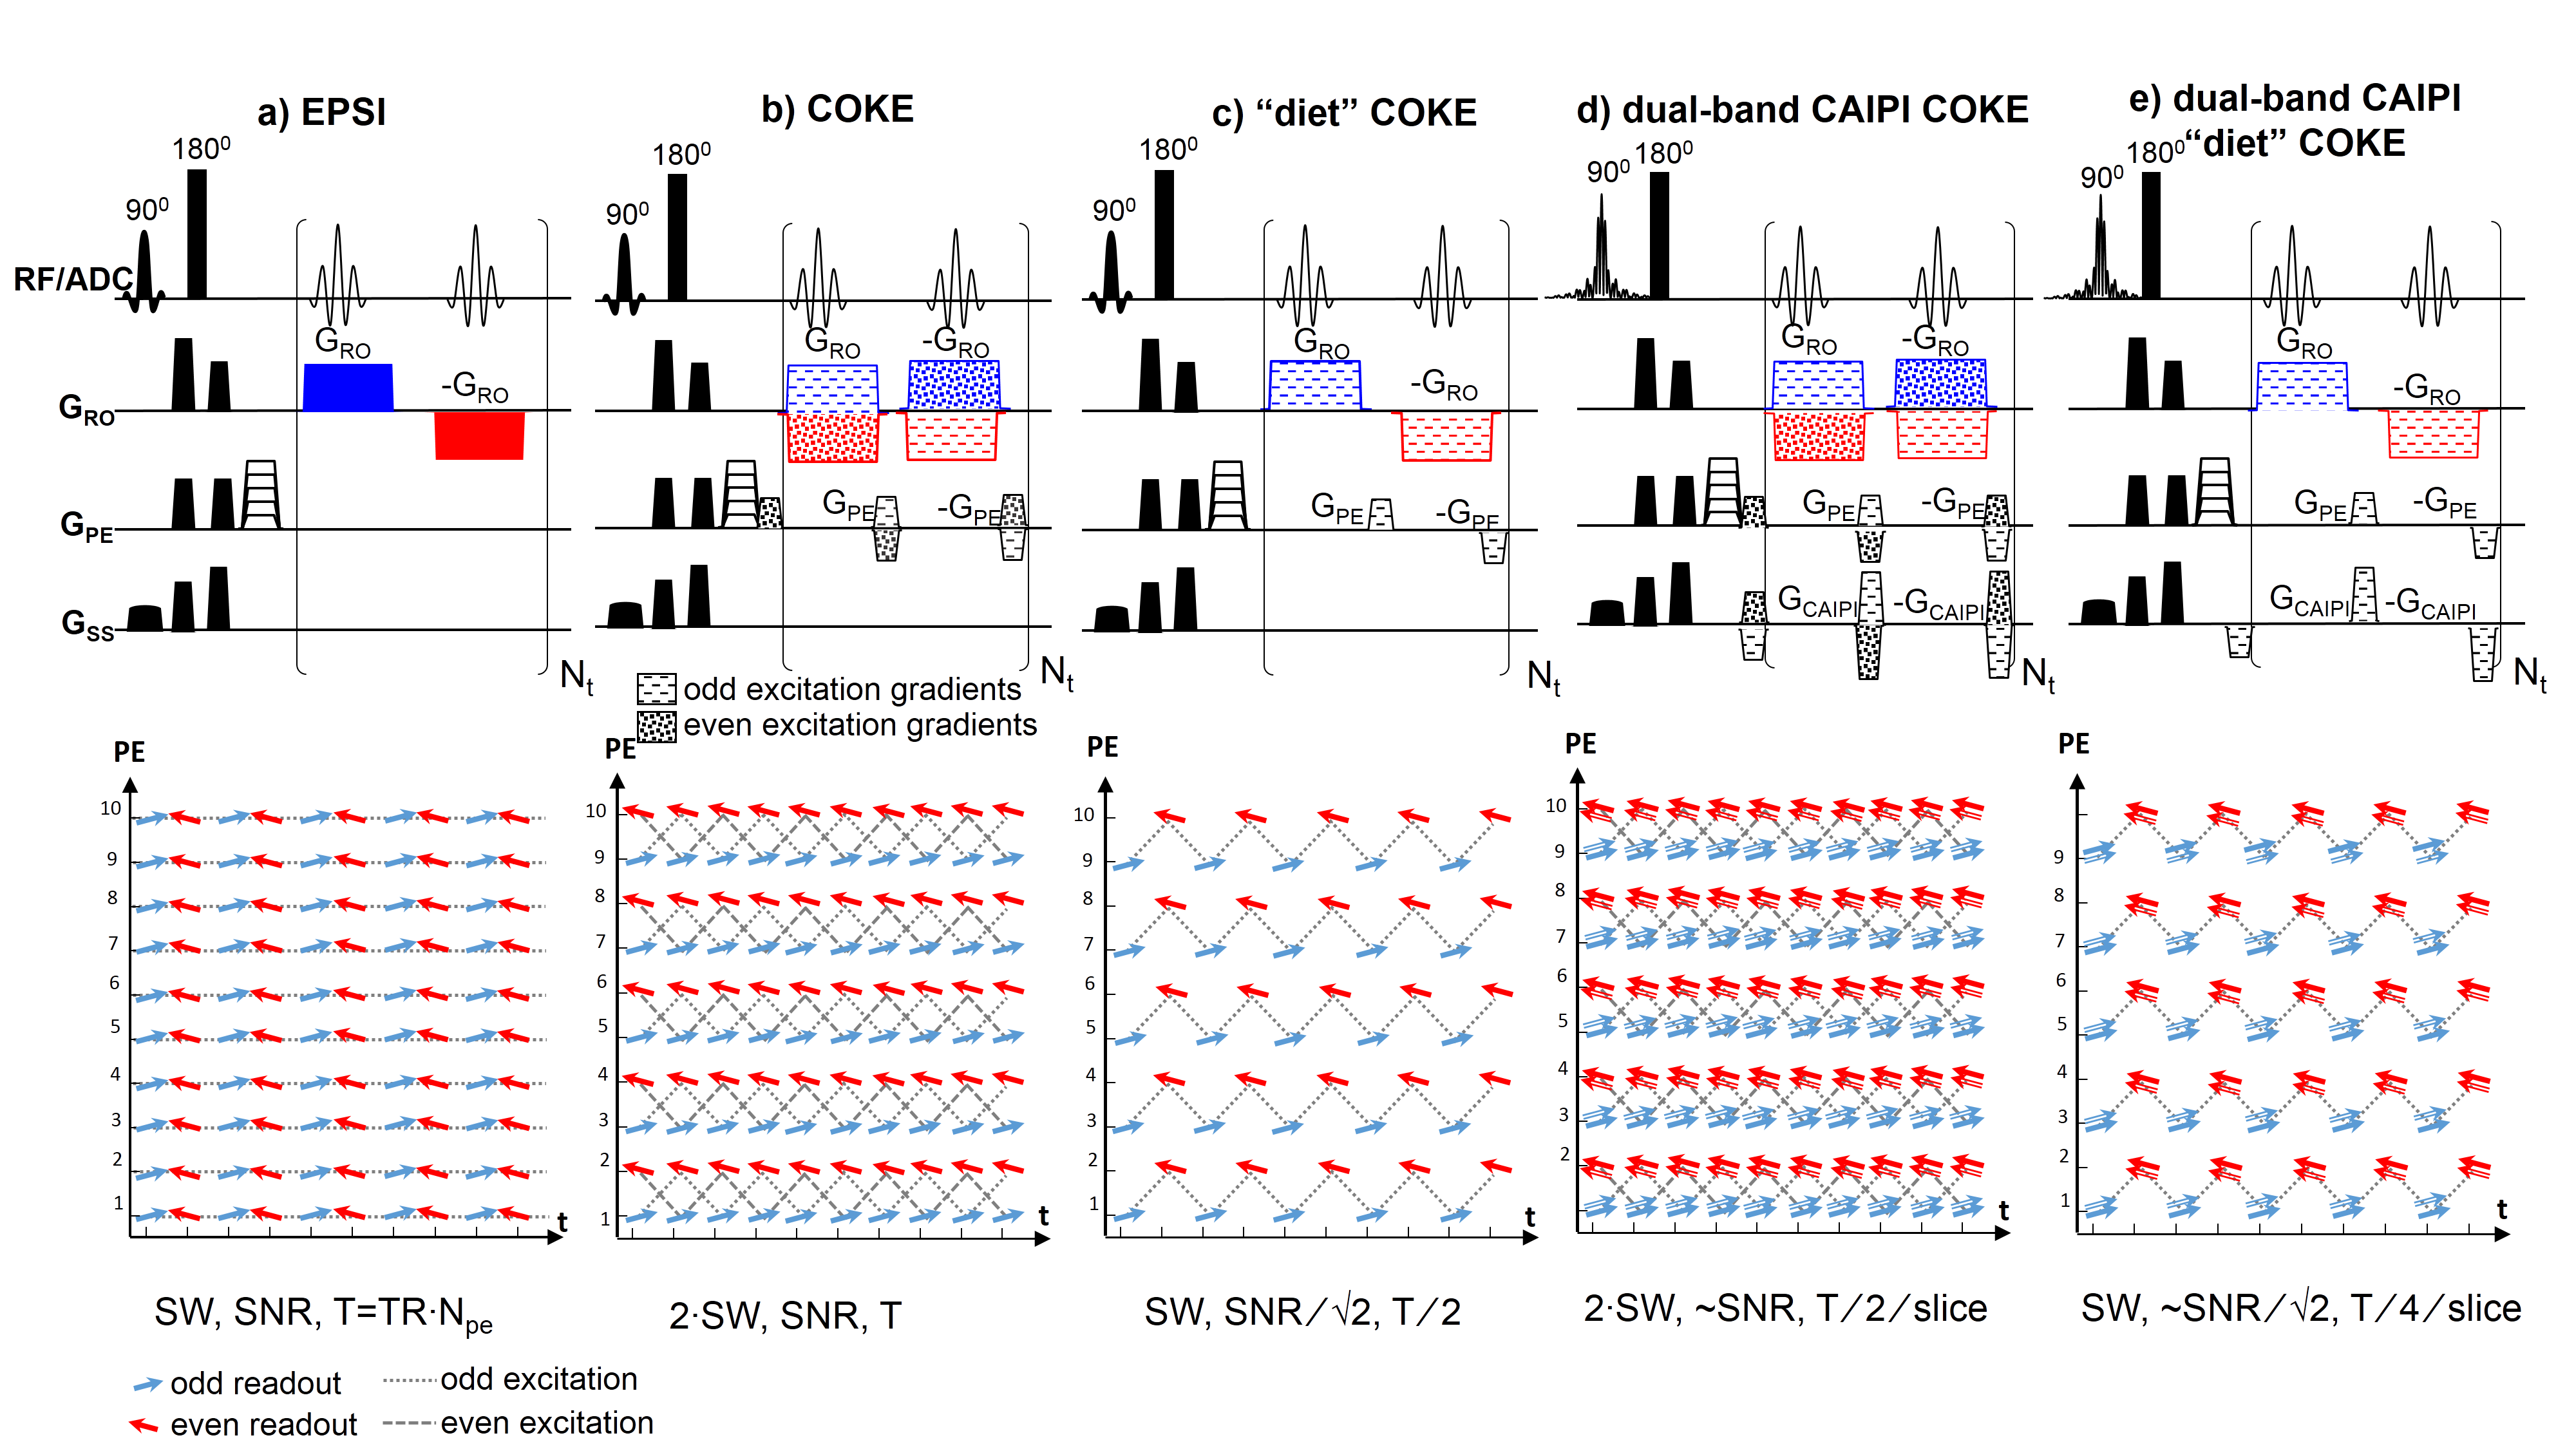
Figure 1: Sequences (top) and PE/t
trajectories (bottom) : a) EPSI, b) COKE, c) “diet” COKE, d) dual-band CAIPI
COKE and e) dual-band CAIPI “diet” COKE. The relative SW, SNR and total
acquisition time for each sequence (a-e) are noted relative to EPSI (a)
(assuming EPSI reconstruction of odd/even readouts separately and combining the
signals). The dual-band slice-selection has dual-arrows representing two
slices. The odd/even excitations are marked differently as shown in the
legends. “Diet” COKE (d) and ( e) use only the odd excitations of the full COKE
scheme (b) and (d) , respectively.
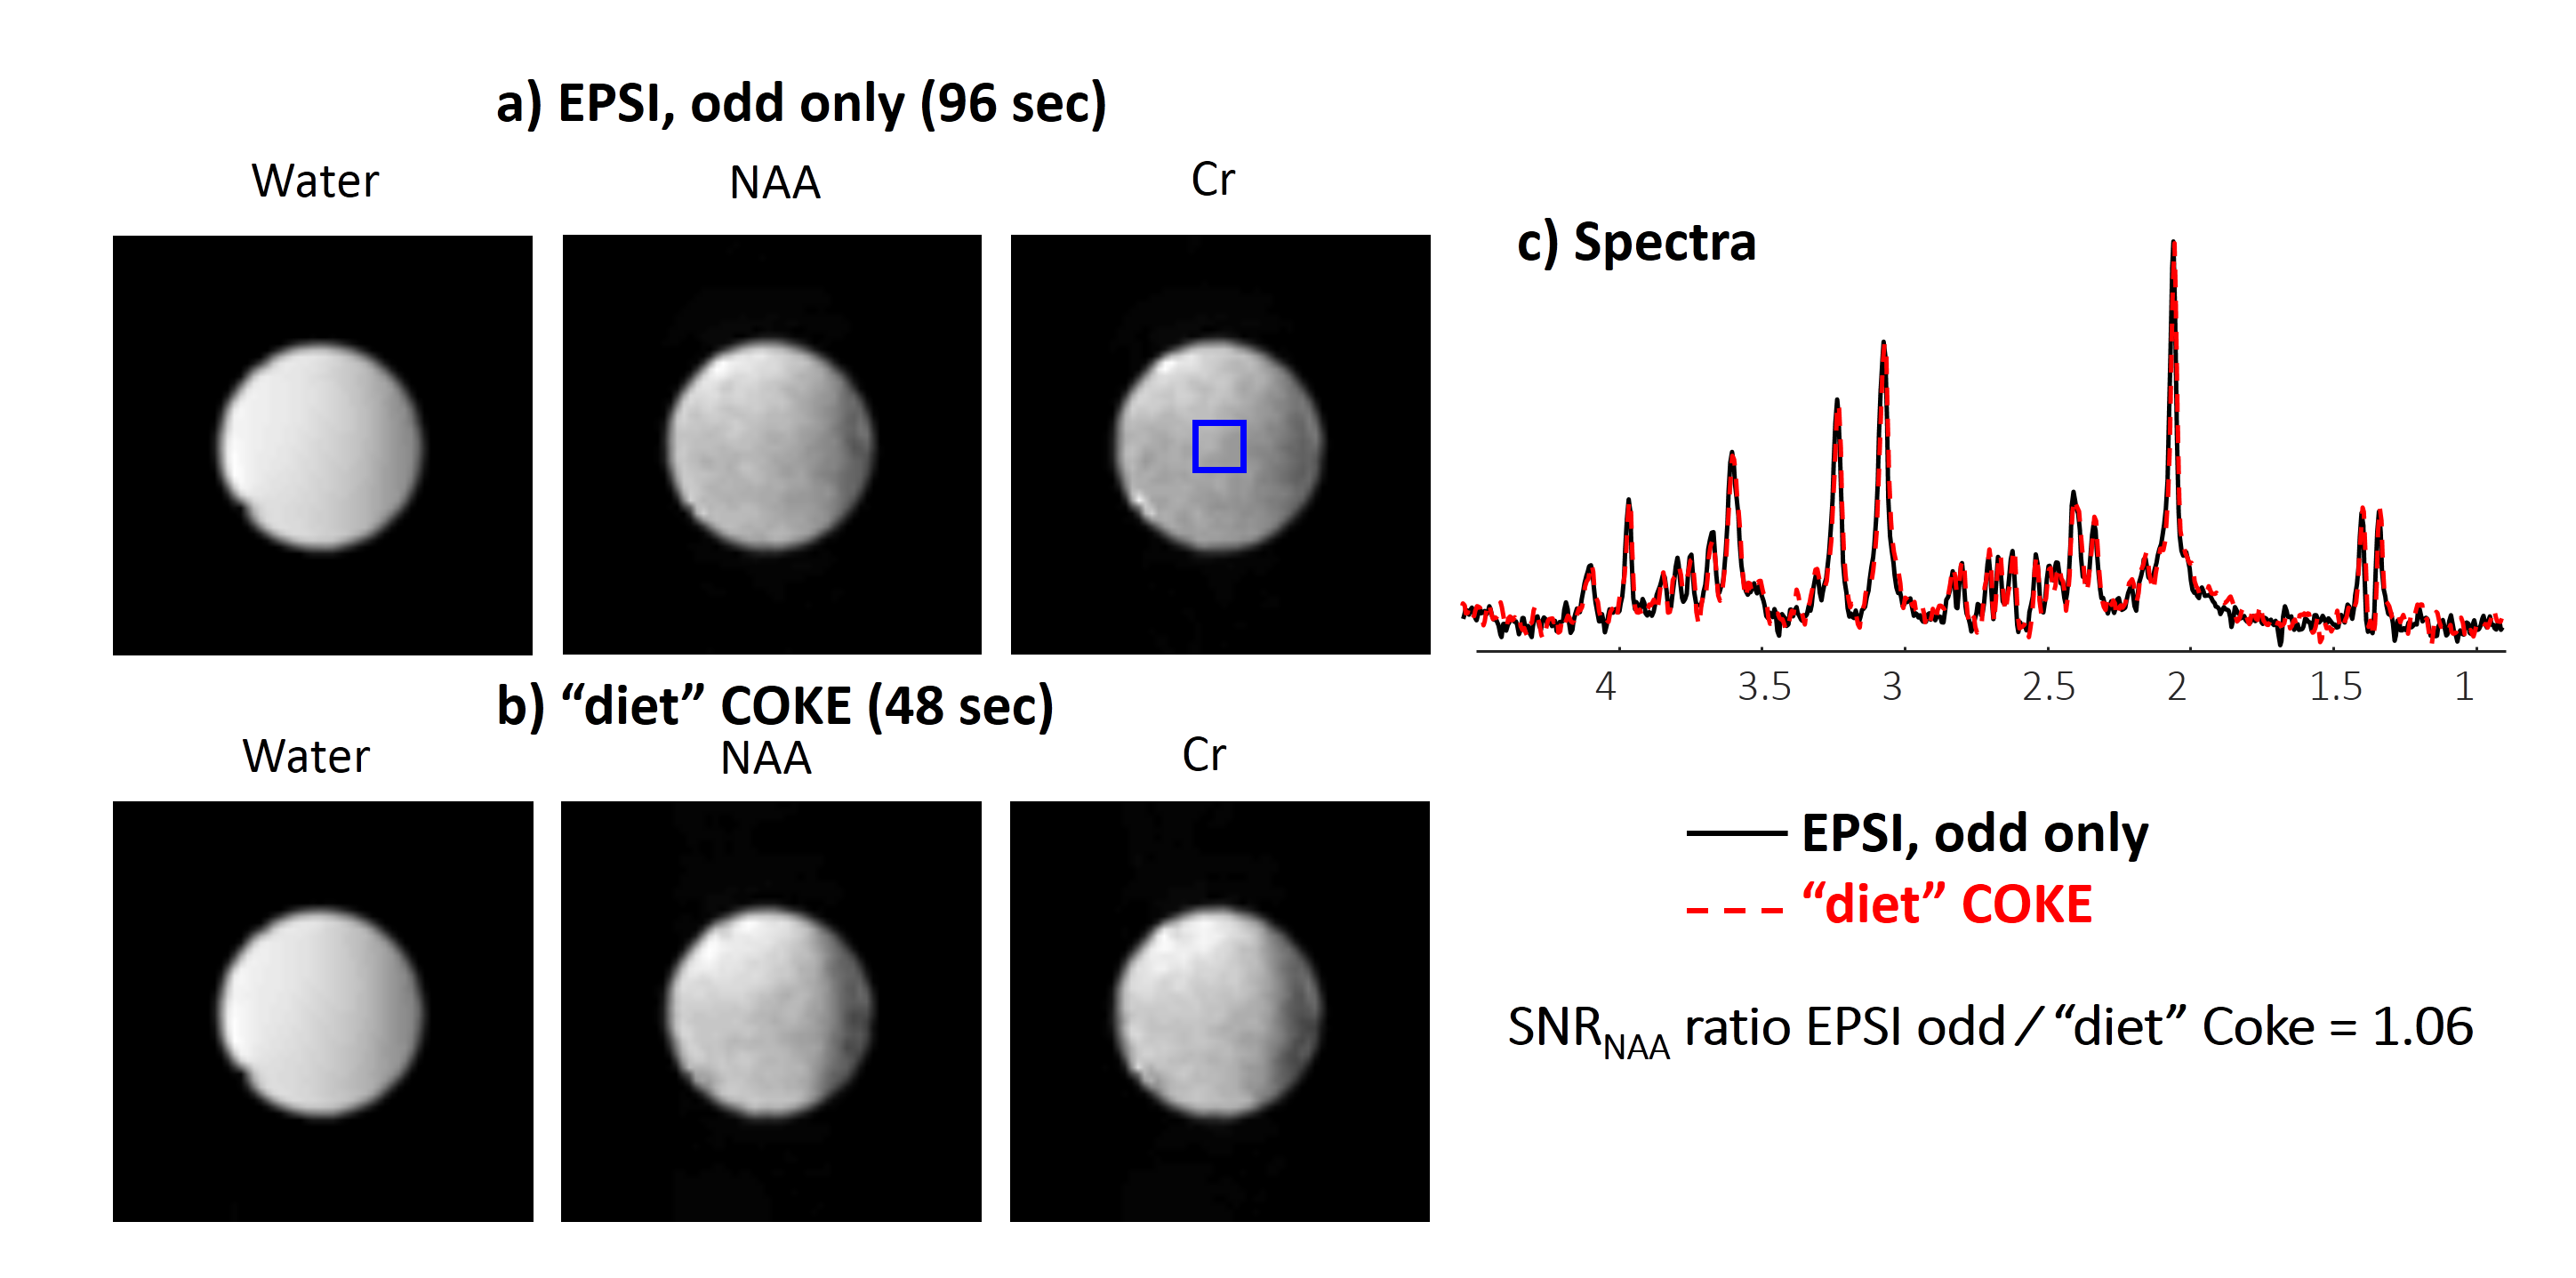
Figure 2: Phantom
results comparing EPSI (TA=96 sec) and two-fold accelerated “diet” COKE (TA=48
sec). The images from left to right show water image (from a scan without water
suppression), NAA and Cr images (separate scan with water-suppression) for EPSI
(a) and “diet” COKE (b). c) Spectra of EPSI (black) and “diet” COKE (red
dashed) for a central region shown by blue overlay. The scan parameters were TR/TE 1500/15 ms, FOV and thickness 310x310x15 mm3, spatial
resolution 64x64 points, frequency resolution 0.7 Hz, echo spacing 0.7 ms, SW
=700 Hz, single average.
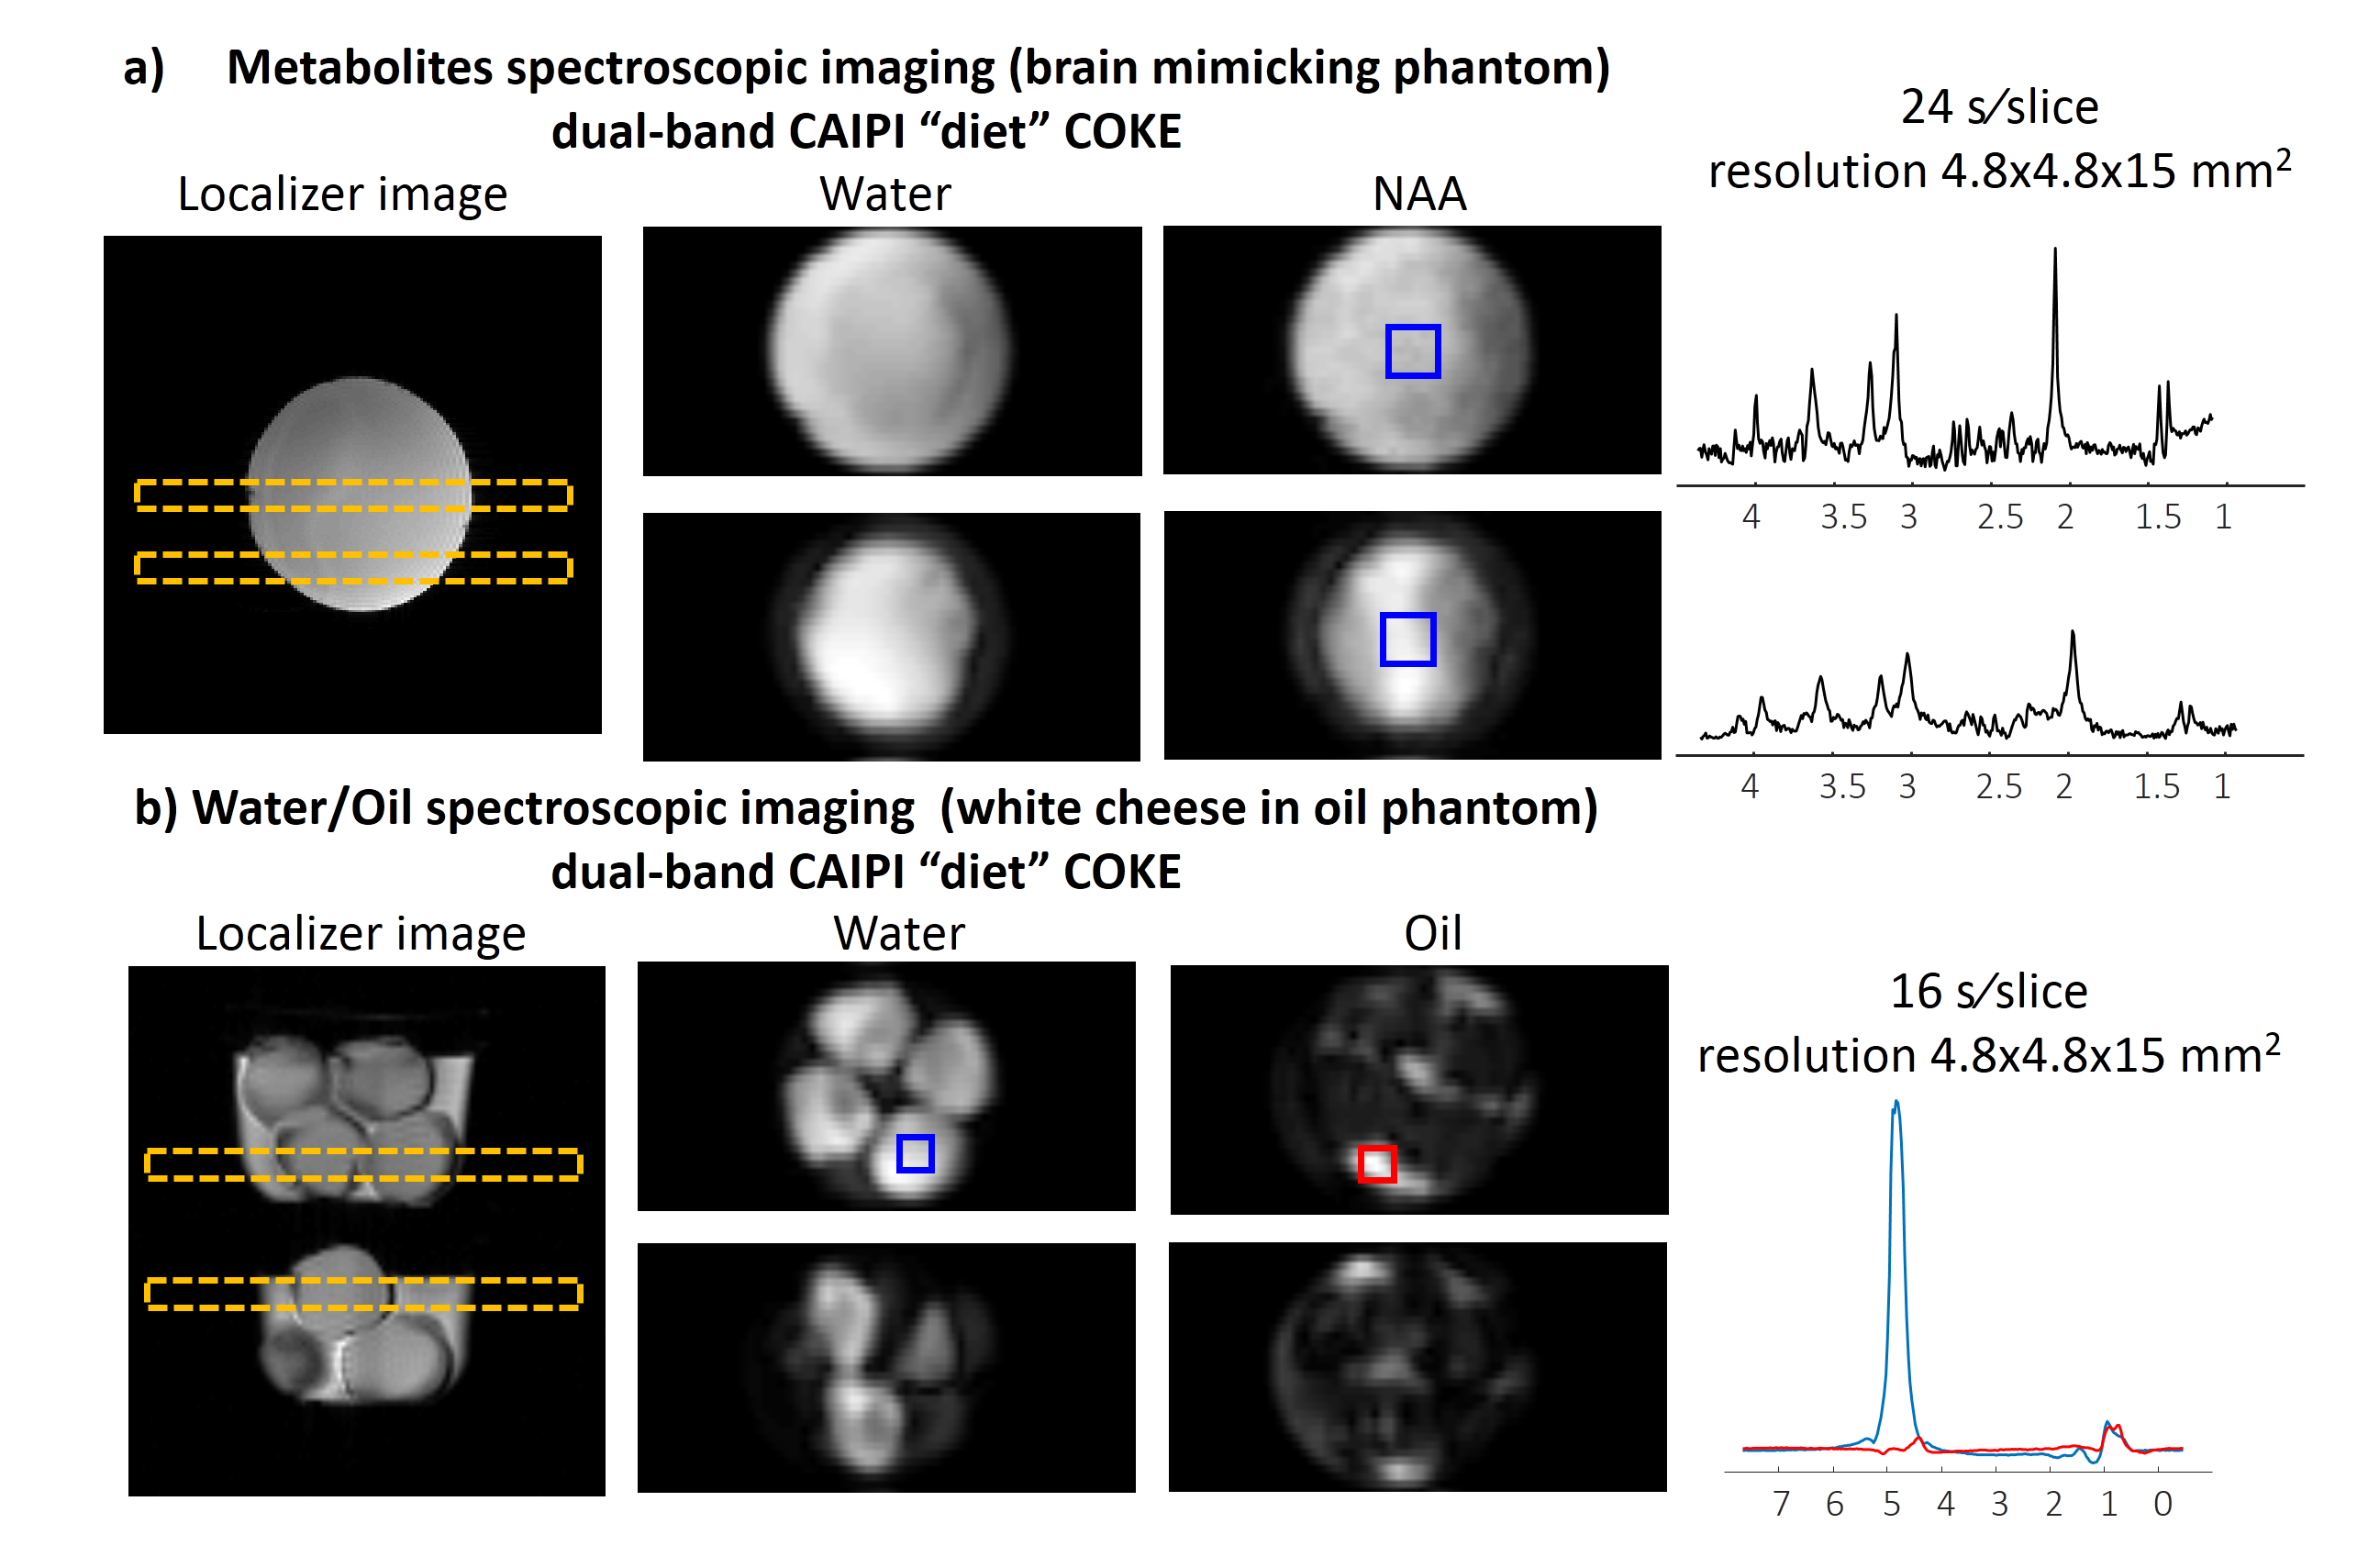
Figure 3: Dual-band CAIPI “diet” COKE – a) Metabolites and b)
Water/Oil spectroscopic. The figure includes, from left to right: localizer
image with the planned slices, images of the slices for representing peaks and
spectrum for the selected region shown by overlays. The
scan parameters in a) : TR/TE 1500/15 ms, FOV and thickness 310x310x15 mm3,
5cm gap between slices, spatial resolution 64x64 points, 0.35 mL voxel,
frequency resolution 0.5 Hz, echo spacing 1 ms, SW =500 Hz, single average (scan repeated with and
without water suppression); in b) different from a) TR/TE 500/12 ms, FOV 20x20
mm2, frequency resolution 2 Hz.
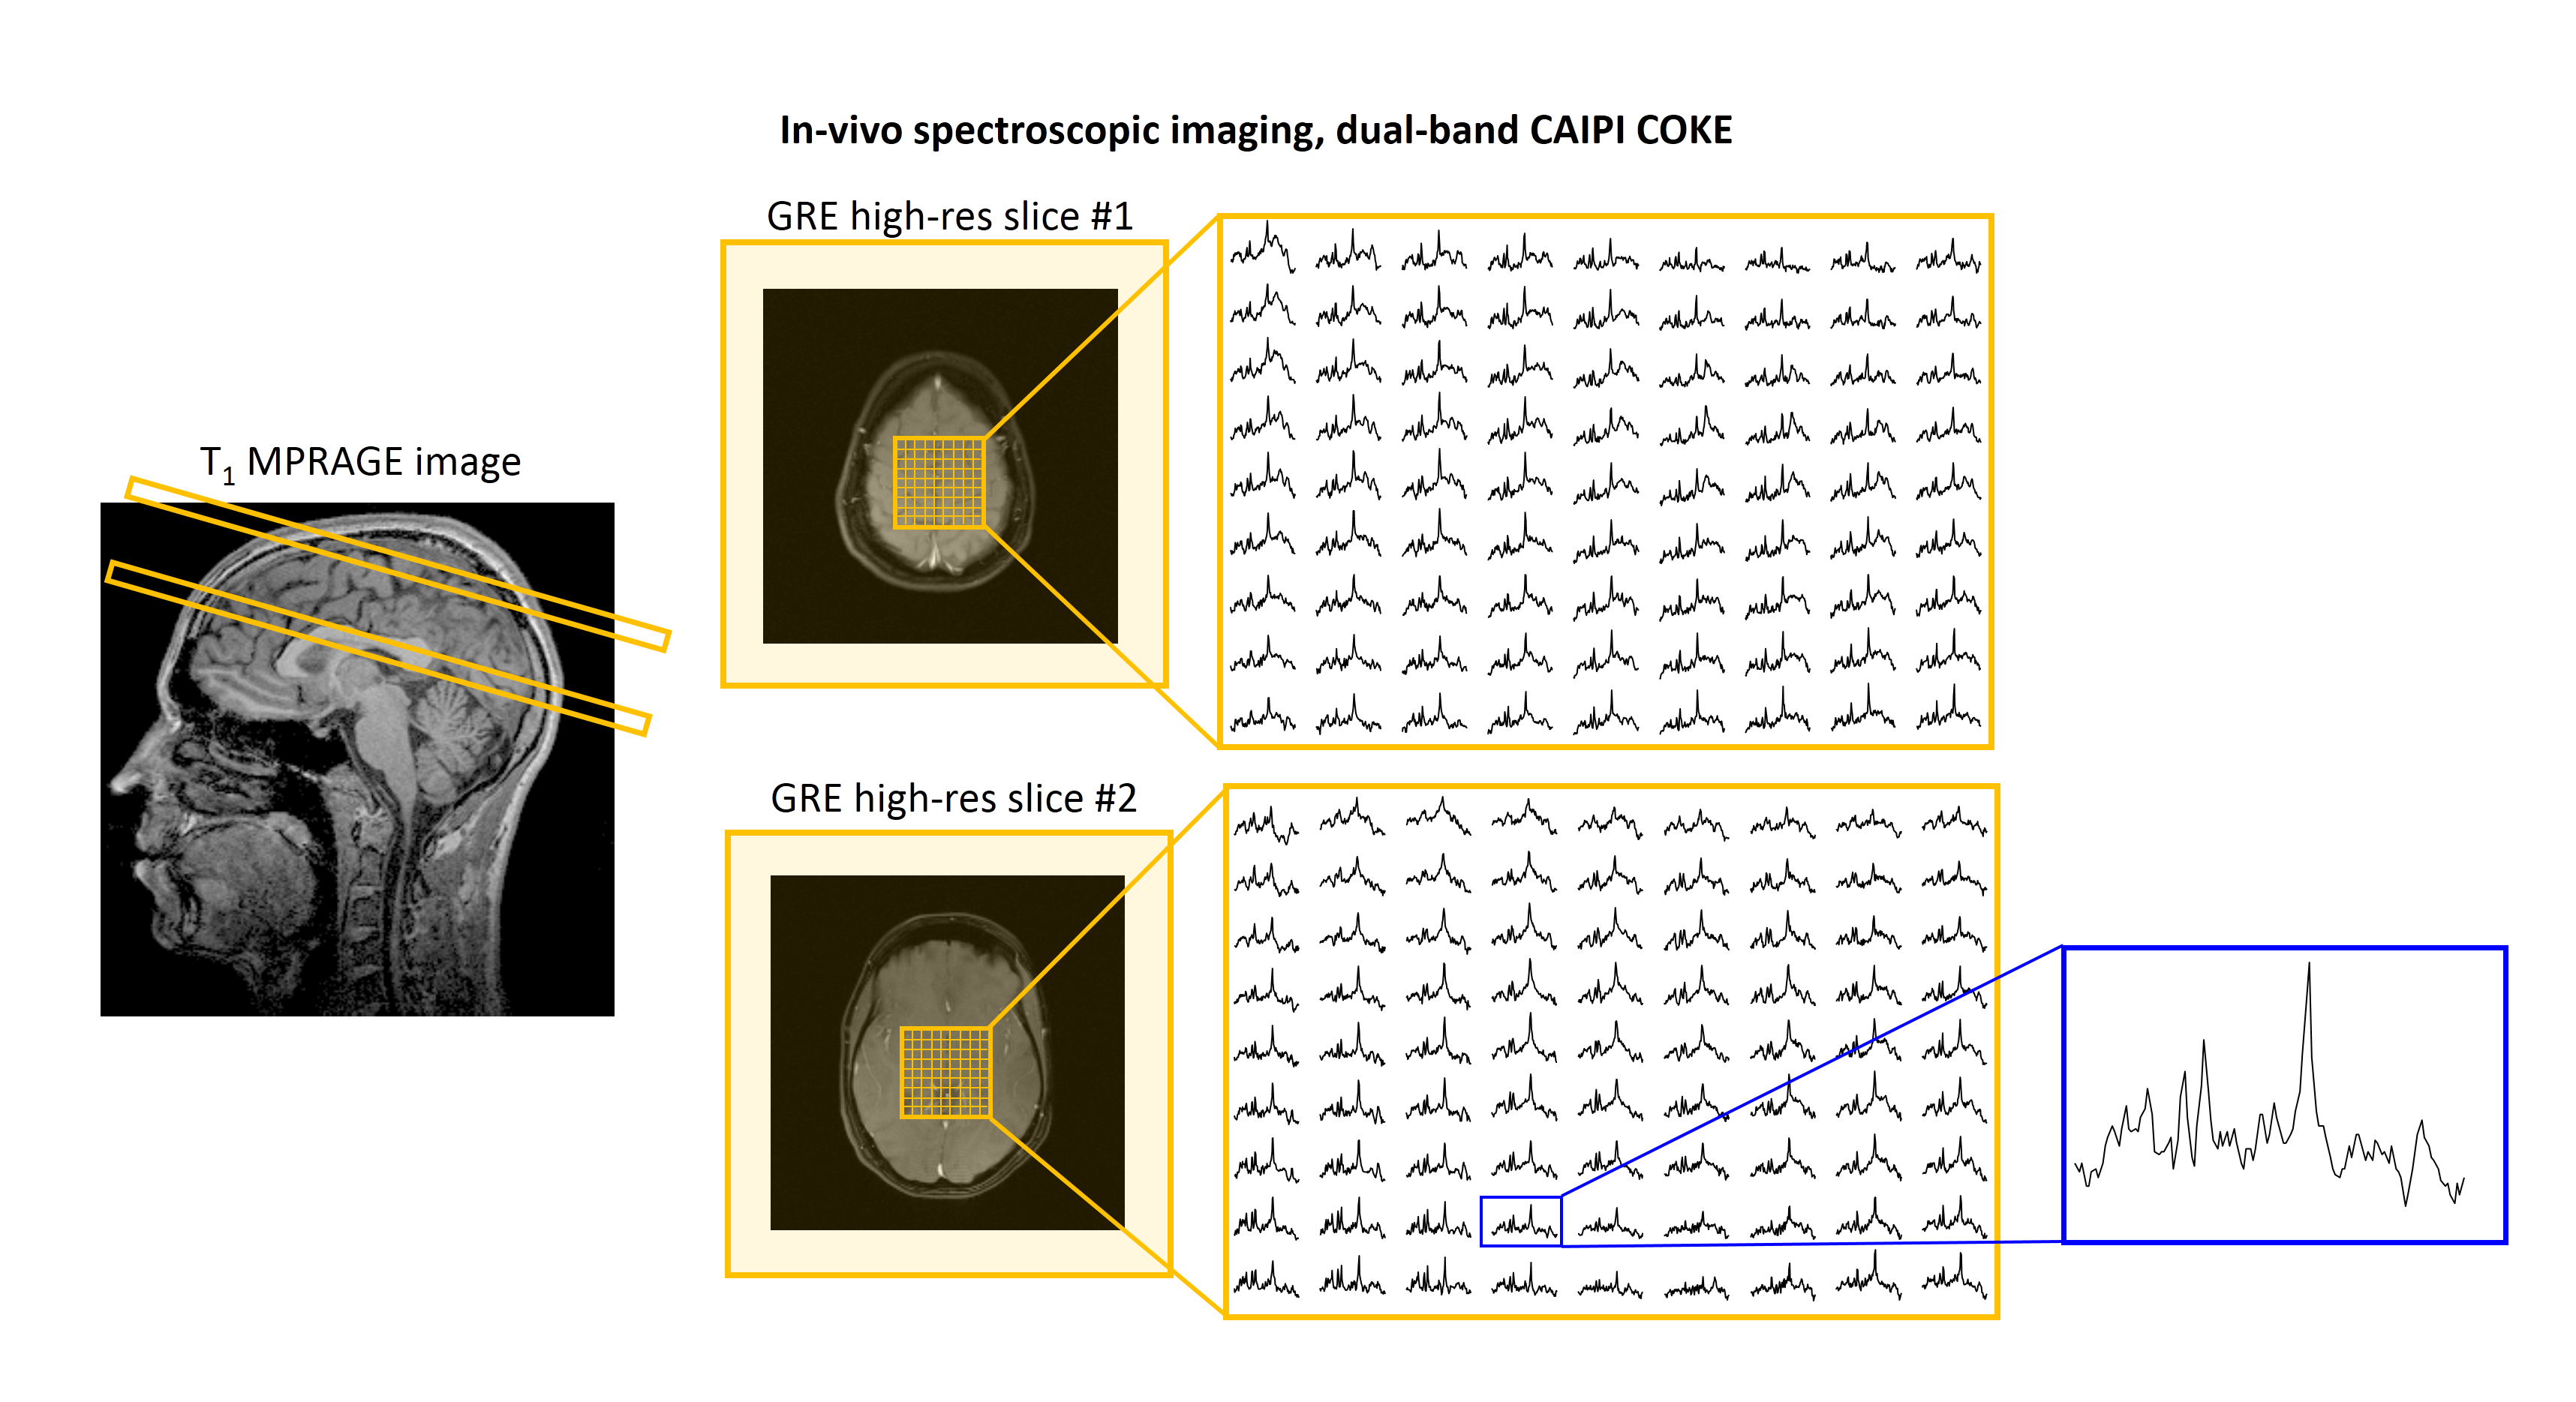
Figure 4: In-vivo dual-band CAIPI COKE. From left to right: T1
MPRAGE image showing slice locations, GRE images of the slices, spectra matrix
in a zoom-in example (peripheral voxels
contained lipid contamination and were omitted for visualization purposes).
Scans parameters were TR/TE 1500/13 ms, FOV and thickness 310x310x15 mm3,
5cm gap between slices, spatial resolution 64x64 points, 0.35 mL voxel,
frequency resolution 4Hz, echo spacing 1ms and SW=1000 Hz, 5 averages, 8 min
scan. Scan parameters of GRE were TR/TE 50/3.8 ms, FOV and thickness 240x240x5
mm3, 192x192 points and T1 MPRAGE TR/TE 2300/3 ms, FOV
256x256x176 mm3, resolution 1 mm3.