1058
Further Accelerating SPICE for Ultrafast MRSI Using Learned Spectral Features1Beckman Institute for Advanced Science and Technology, University of Illinois at Urbana-Champaign, Urbana, IL, United States, 2Electrical and Computer Engineering, University of Illinois at Urbana-Champaign, Urbana, IL, United States
Synopsis
This work presents a new method to incorporate machine learning into SPICE (SPectroscopic Imaging by exploiting spatiospectral CorrElation) to further enhance its data acquisition speeds. The proposed method exploits the significant amount of prior knowledge about the spectral variations of biological tissues, e.g., molecular composition and resonance structures, by devising a novel strategy to learn the molecule-specific spectral features from training data, and incorporating the learned features into a subspace representation of the desired spatiospectral distribution for a general MRSI study. Impressive results have been produced by the proposed method from 1H-MRSI of the brain without any suppression pulses.
INTRODUCTION
SPICE (SPectroscopic Imaging by exploiting spatiospectral CorrElation) has emerged as a potentially powerful tool to achieve fast, high-resolution MRSI1-3. Key steps within the SPICE framework include the determination of low-dimensional subspaces where high-dimensional spectroscopic signals reside and the use of these subspaces for spatiospectral processing. The current approach is to acquire high-SNR navigators during each experiment, and extract a data-dependent subspace1,2. Recognizing that a significant amount of prior information is available to capture the spectral variations of biological tissues, we propose a new approach to improve SPICE. Specifically, we design a novel strategy to learn the molecular-dependent spectral features from training data. Using these learned features, the spectral signatures of individual molecules can be pre-determined and integrated into a subspace representation of a general spatiospectral function. The proposed method has been evaluated using 1H-MRSI of the brain without water suppression. High-quality spatiospectral reconstructions have been produced without acquiring experiment-dependent navigator data.THEORY&METHODS
Background
SPICE is characterized by the use of a low-dimensional subspace model to represent the high-dimensional spectroscopic data and special acquisition/processing strategies for subspace estimation and subspace-based spatiospectral reconstruction. To determine the metabolite signal subspace, a key step in the SPICE framework, high-SNR, water/lipid-suppressed navigators are typically acquired for each experiment, and used to estimate a data-dependent subspace (e.g., through SVD analysis) for subsequent processing1,2.
Improved SPICE with Learned Spectral Features
We propose here a new strategy to improve SPICE-based MRSI by exploiting the significant amount of prior knowledge about the spectral variations of individual molecules. Specifically, we represent the spectroscopic signal at each voxel with $$$M$$$ molecules as4-7
$$s(t)=\sum_{m=1}^Mc_m\phi_m(t;\boldsymbol{\alpha_m})e(t),\qquad\qquad\qquad\qquad [1]$$
where $$$c_m$$$ denotes the concentration of the $$$m$$$th molecule, $$$\phi_m(t)$$$ the corresponding spectral structure, and $$$e(t)$$$ the experiment-dependent signal distortion (e.g., due to B0 inhomogeneity or eddy current). We recognize that 1) the functional form of $$$\phi_m(t;\boldsymbol{\alpha_m})$$$ is determined by quantum mechanics and a few molecular-specific parameters in $$$\boldsymbol{\alpha_m}$$$ (e.g., relaxation and frequency shifts); 2) the distributions of $$$\boldsymbol{\alpha_m}$$$ are typically in a narrow range for biological tissues and can be learned from specifically acquired training data7; 3) once such "empirical" distributions are learned, the resulting spectral variations can be represented by a low-dimensional subspace model, which can then be used to represent a general spatiospectral function of interest.
To learn the empirical distribution of $$$\boldsymbol{\alpha_m}$$$, we acquired training datasets from multiple subjects using low-resolution EPSI. Note that other alternatives can be considered to capture pathology-specific spectral features. These data were fitted using the following model (after water/lipids removal and B0 correction):
$$s(r,t)=\sum_{m=1}^Mc_m(r)\psi_m(t)e^{-t/T_{2,m}^*(r)+i2\pi\delta f_m(r)t}e_1(r,t),\quad [2]$$
where $$$\psi_m(t)$$$ denotes the molecular basis, the values in $$$\boldsymbol{\alpha_m}=\{T_{2,m}^*, \delta f_m\}$$$ sample the empirical distribution and $$$e_1(r,t)$$$ is obtained from nonwater-suppressed data. All the fitted spectra were arranged into a Casorati matrix from which a metabolite basis was estimated. In this work, we considered NAA, creatine, choline, glutamate, glutamine, and myo-inositol to demonstrate the feasibility of our approach, while more molecules can be considered.
Given the subspace, spatiospectral reconstruction for a general MRSI study can be obtained using a union-of-subspaces model1-3. The water/lipid subspace was determined by performing a Lorentzian fitting to a reconstruction from the original MRSI data (dominated by water/lipid signals). A macromolecule subspace was determined using metabolite-nulled data8. The reconstruction was done by a spatially regularized least-squares fitting3.
RESULTS AND DISCUSSION
In vivo data were acquired using an ultrashort-TE SPICE sequence, without water suppression3, on a Siemens Prisma 3T scanner with TR/TE=210/4ms, matrix size=96x96x24, and FOV=240x240x72mm3 (2.5x2.5x3mm3 nominal resolution). Data were acquired in 5min with x2 undersampling along the phase encoding directions. MPRAGE images were acquired to obtain tissue segmentations for spatiospectral processing1,2. All training data were acquired with matrix size=16x16x12.
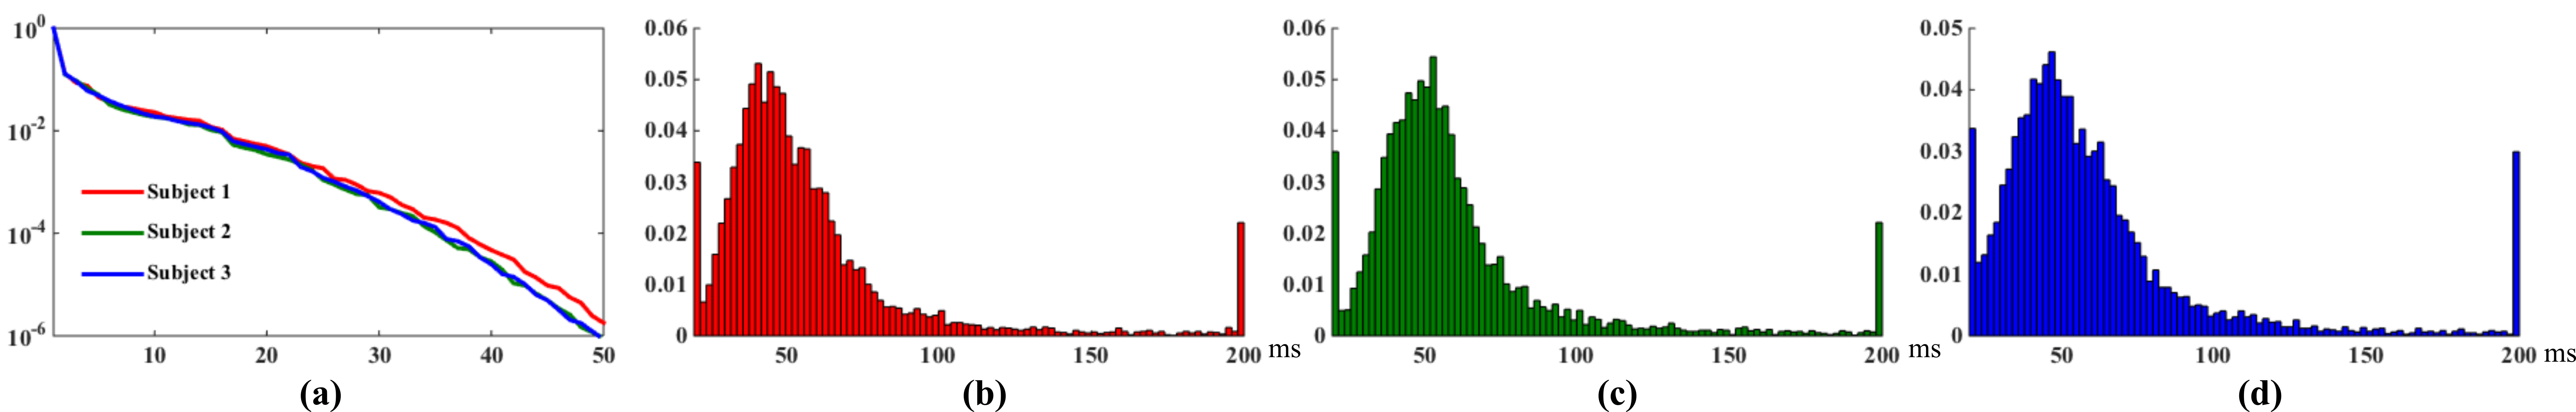
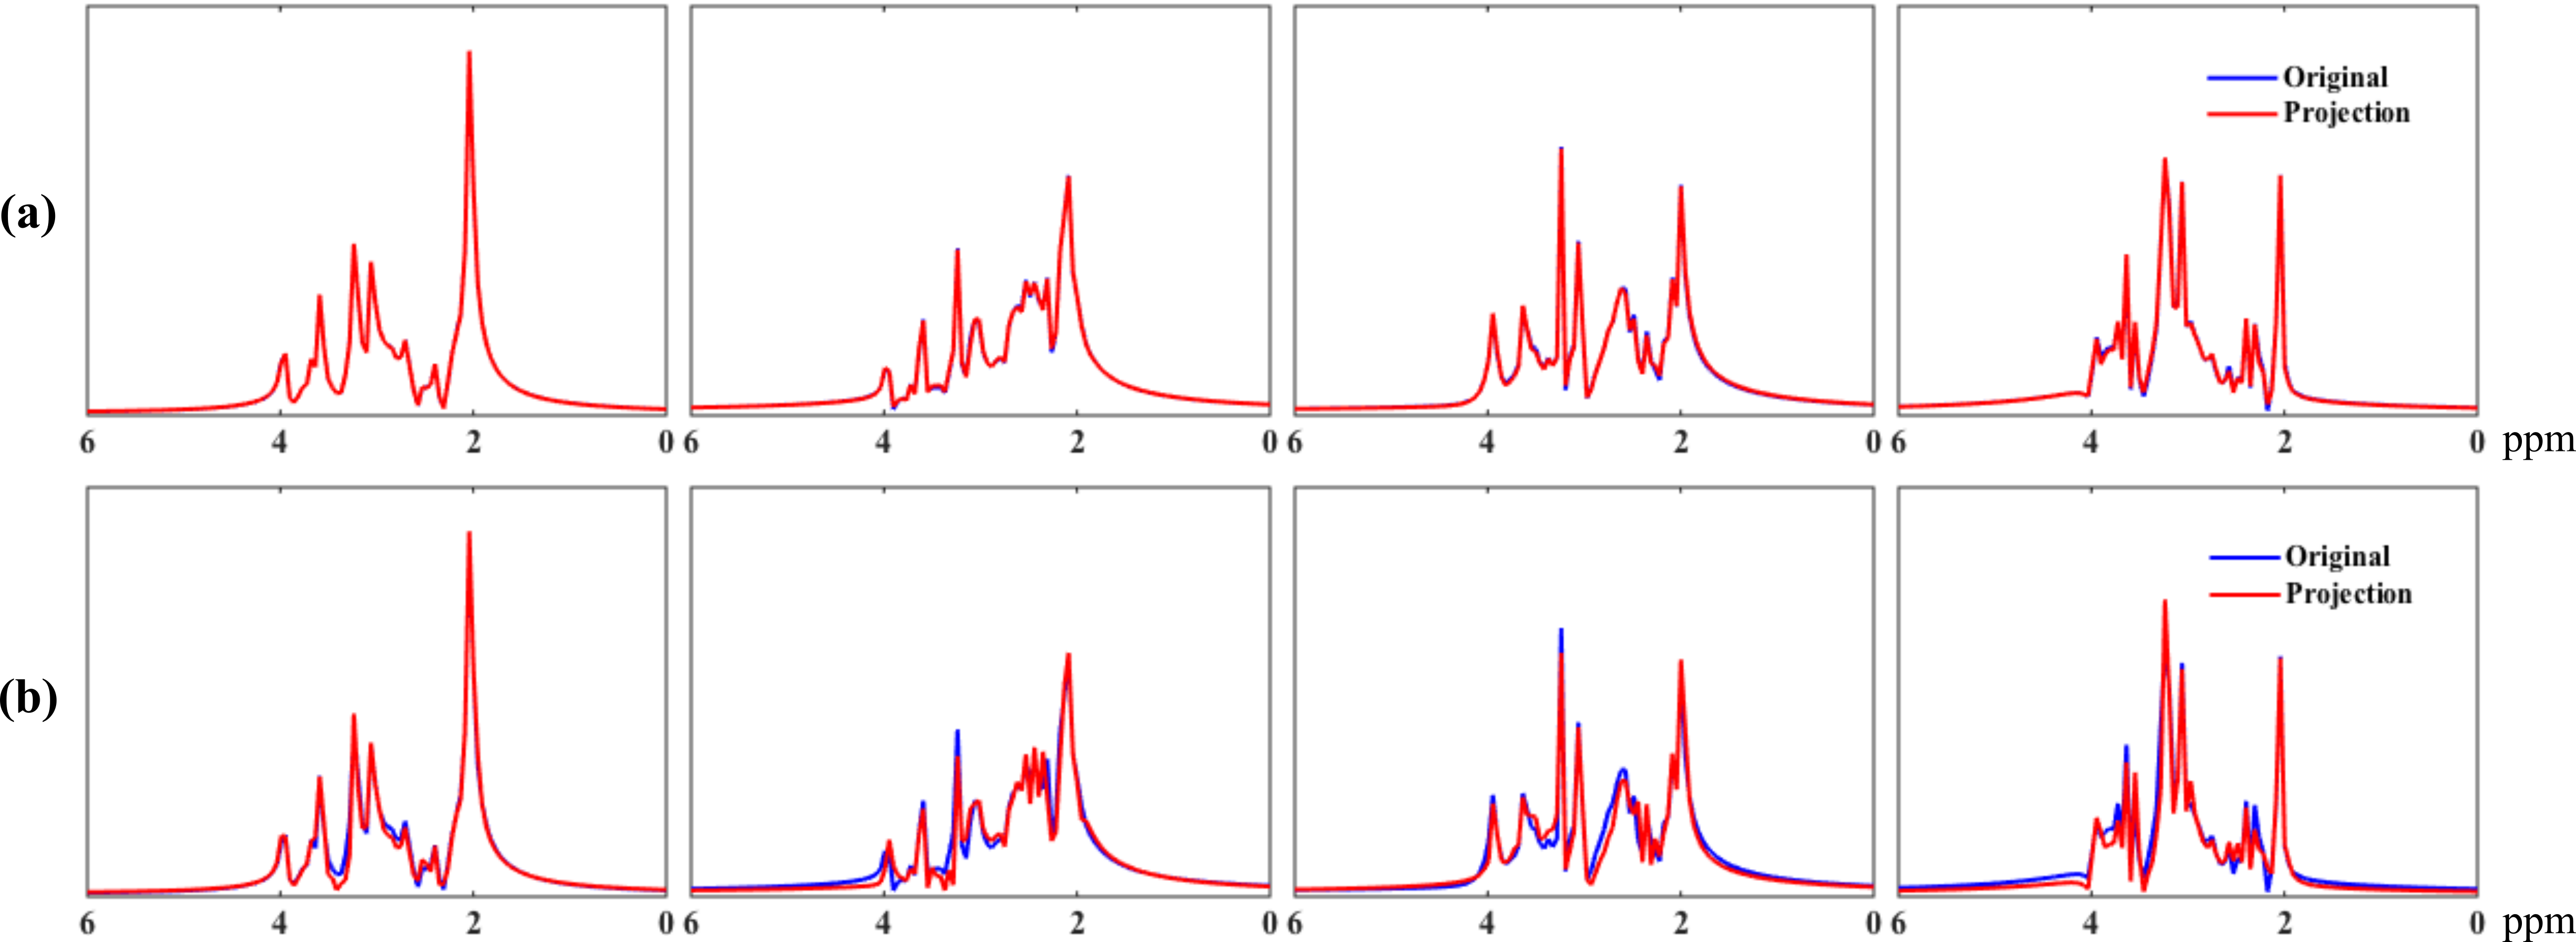
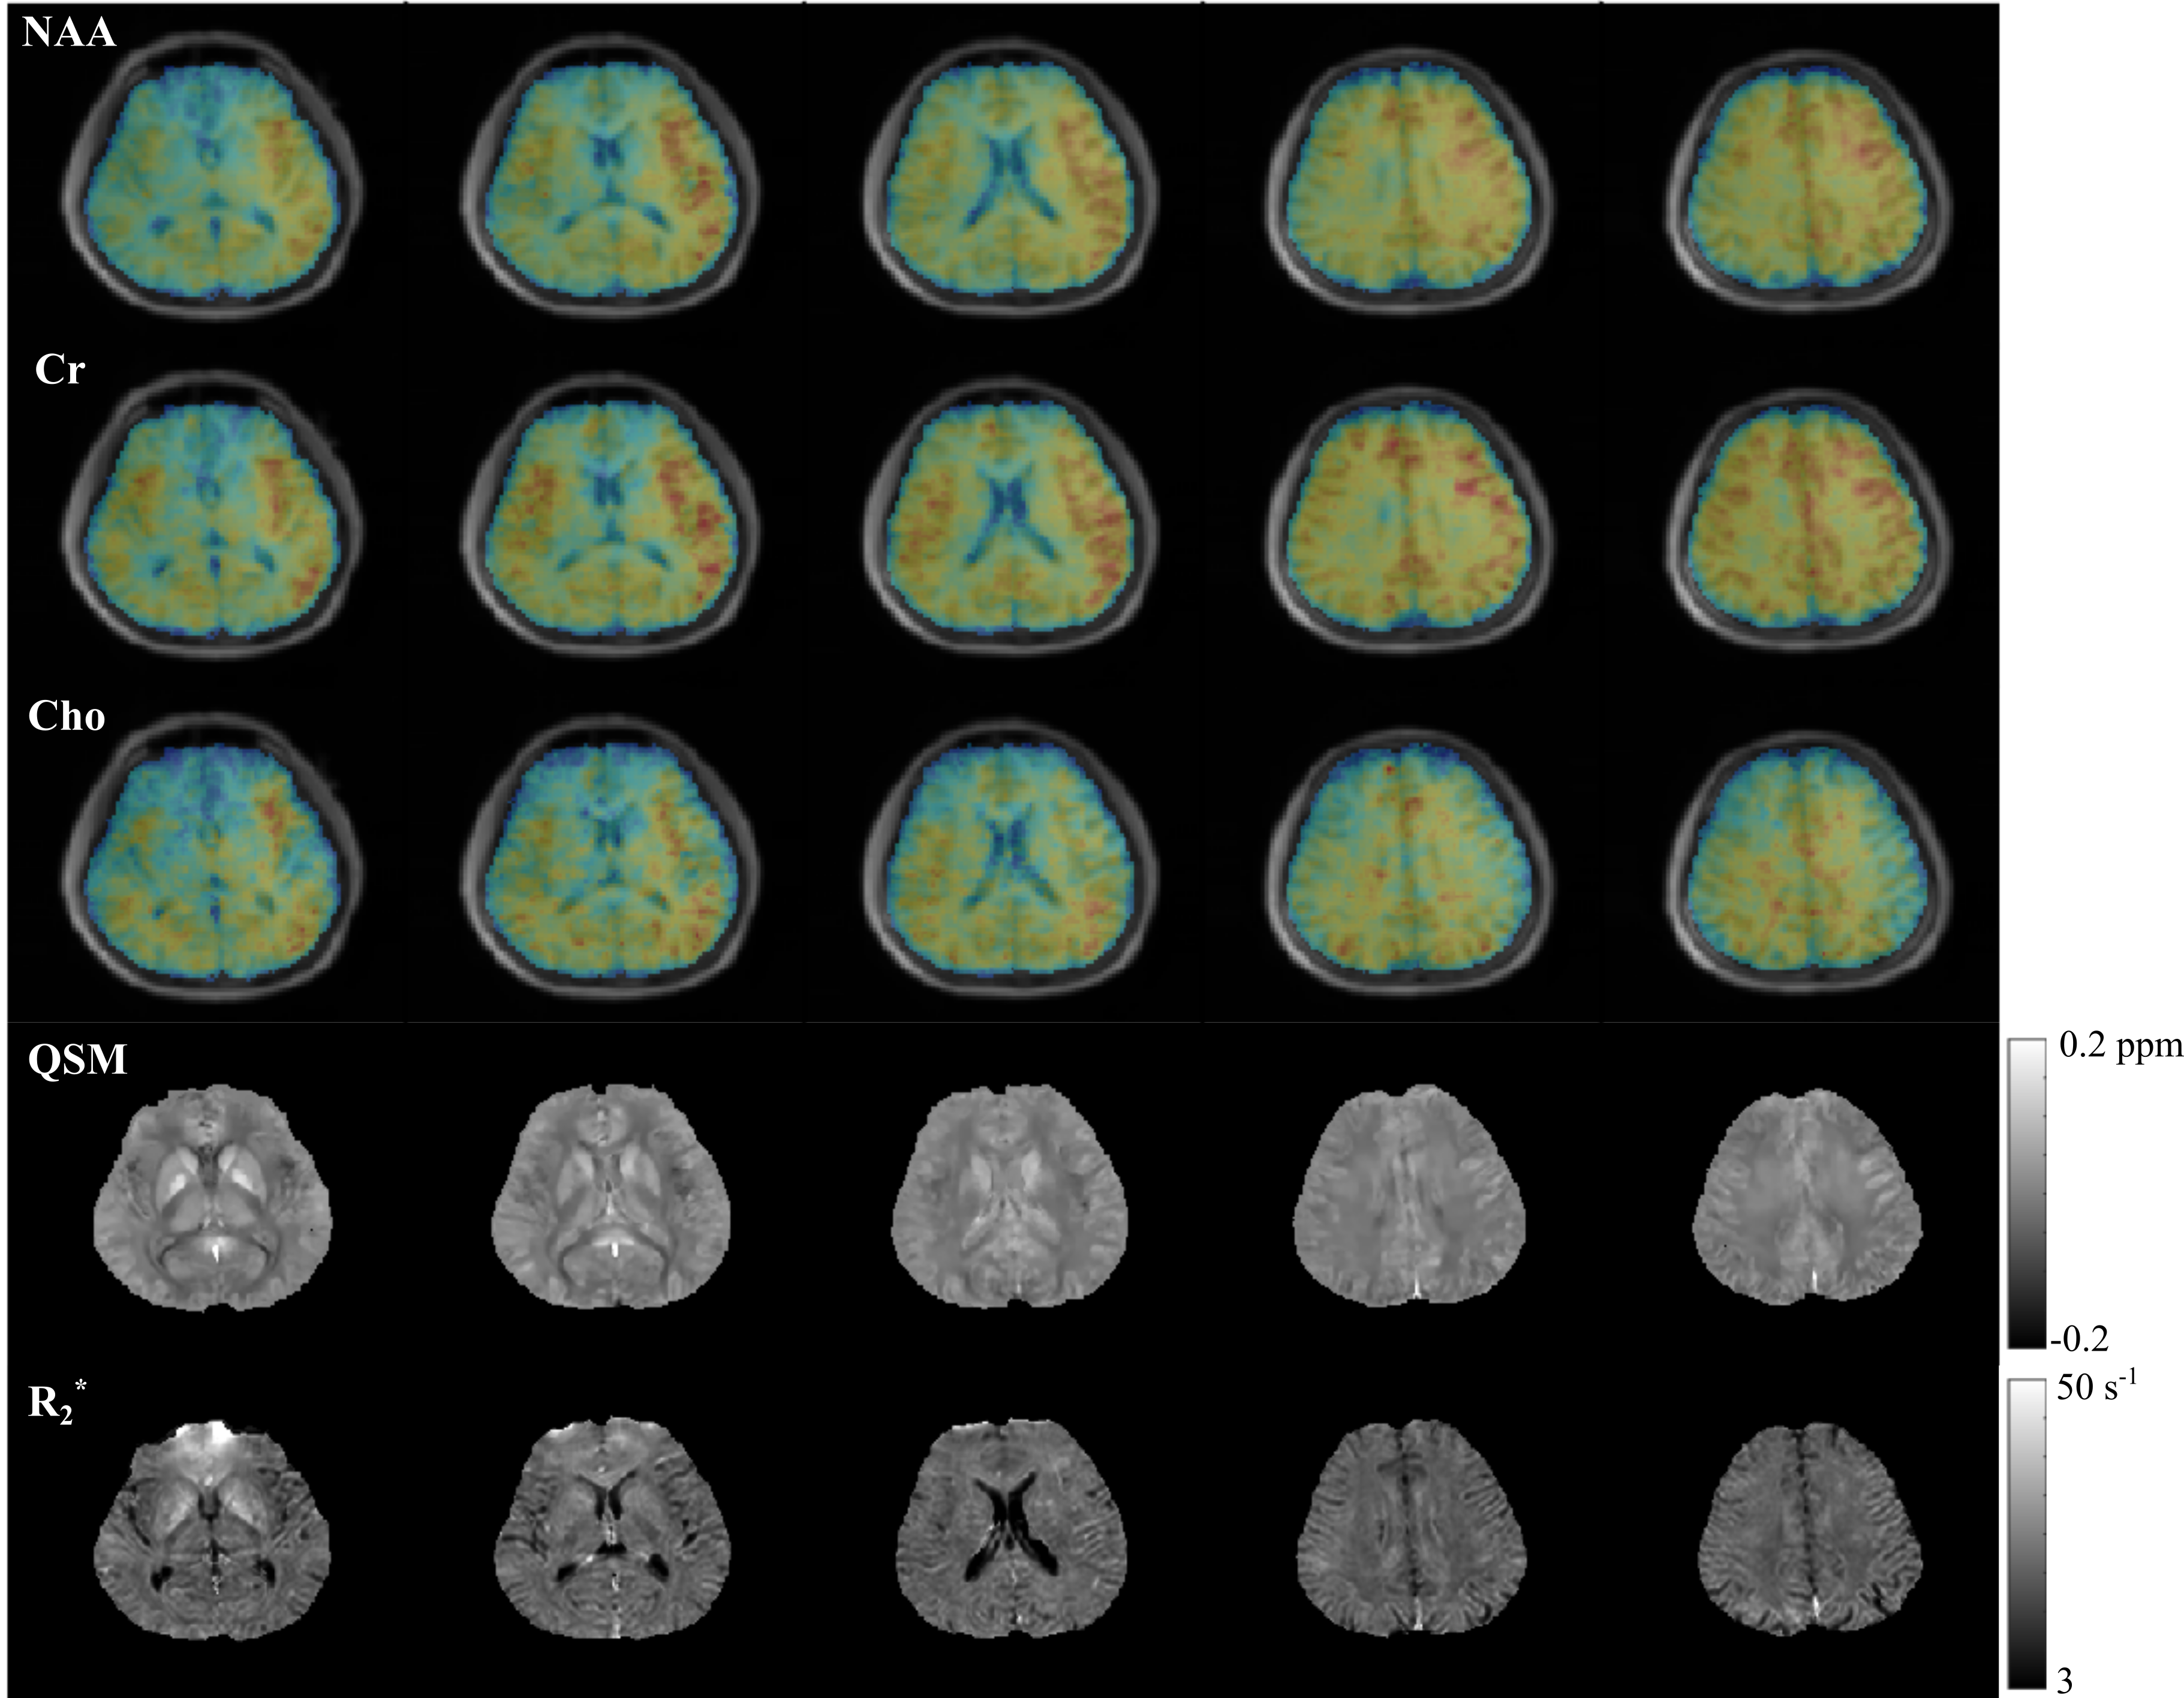
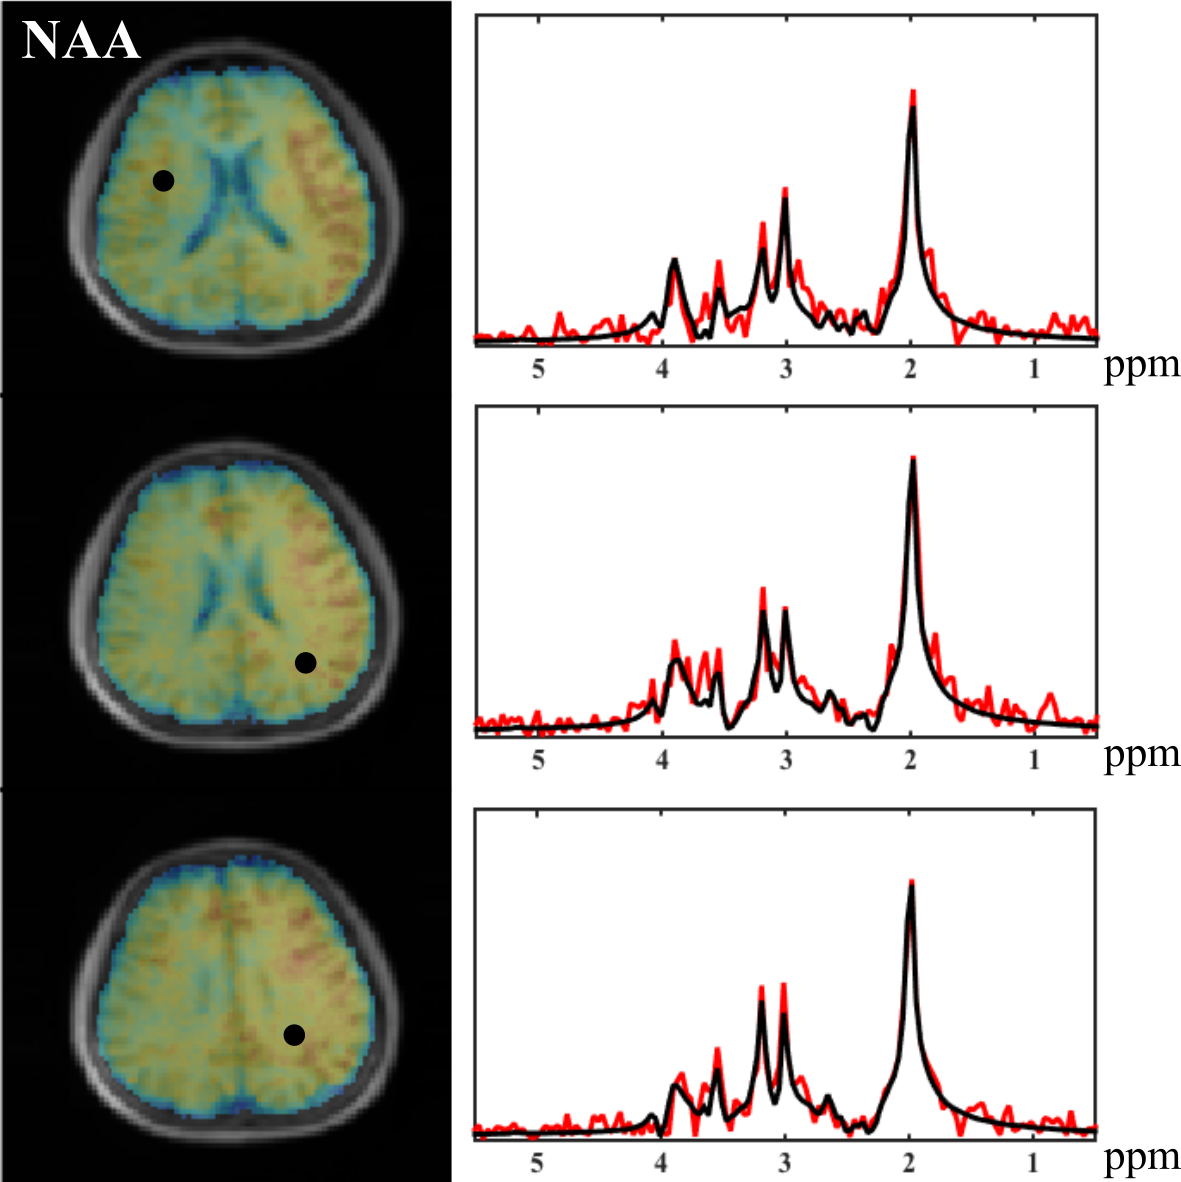
Figure 1 shows the distributions of metabolite $$$T_2^*$$$ from three subjects and the singular values for the fitted training data. The rapid decays in (a) imply that all the spectral functions reside in a low-dimensional subspace. The similar parameter distributions for all subjects support the concept of using training data for subspace estimation. Figure 2 compares the metabolite bases from different subjects, and the bases from training data to those from synthesized spectra with uniformly distributed $$$\boldsymbol{\alpha}_m$$$. Consistent subspaces can be observed for different subjects, while the synthesized subspace cannot represent the experimental data accurately, demonstrating the need of training data (determining biologically meaningful parameter distributions). Figures 3-4 show the high-quality metabolite spatiospectral reconstructions obtained using the learned subspace. QSM and R2* maps from the unsuppressed water signals are also shown.
SUMMARY
We presented a new approach to improve SPICE, by learning molecular-specific spectral features and incorporating the learned features into a subspace representation of general spatiospectral distributions. Excellent results were produced from volumetric 1H-MRSI of the brain without water suppression.Acknowledgements
This work is supported in parts by NIH-R21-EB021013-01 and NIH-P41-EB002034.References
1. Lam F et al., High-resolution 1H-MRSI of the brain using SPICE: Data acquisition and image reconstruction, Magn Reson Med, 2016;76:1059-1070.
2. Ma C et al., High-resolution 1H-MRSI of the brain using short-TE SPICE, Magn Reson Med, 2017;77:467-479.
3. Peng X et al., Simultaneous QSM and metabolic imaging of the brain using SPICE, Magn Reson Med, 2017, In Press.
4. Provencher SW, Estimation of metabolite concentrations from localized in vivo proton NMR spectra, Magn Reson Med, 1993;30:672-679.
5. Vanhamme L et al., Improved method for accurate and efficient quantification of MRS data with use of prior knowledge, J Magn Reson, 1997;129:35-43.
6. Ratiney H et al., Time-domain semi-parametric estimation based on a metabolite basis set, NMR Biomed, 2015;18:1-13.
7. Li Y et al., A subspace approach to spectral quantification for MR spectroscopic imaging, IEEE Trans Biomed Eng, 2017;64:2486-2489.
8. Lam F et al., Macromolecule mapping of the brain using ultrashort-TE acquisition and reference-based metabolite removal, Magn Reson Med, 2017, In Press.
Figures