1057
Reduction of Acquisition time by Partition of the sIgnal Decay in Spectroscopic Imaging (RAPID-SI) technique: Preliminary In-vivo results and comparison with CSI.1Department of Radiology and nuclear medicine, University of Ghent, Gent, Belgium, 2Robarts Research Institute, University of Western Ontario, London, ON, Canada
Synopsis
We describe the development of the RAPID-SI technique and its implementation on a 3 T Siemens scanner. In-vivo studies demonstrate the performance of this technique in terms of acquisition time, signal-to-noise ratio, and data analysis. The results are compared to the CSI technique. Compared to CSI, RAPID reduces the acquisition time by a factor of R and provides accurate quantification results. The SNR of RAPID at the acquisition level is lower by √R and increased by data pre-processing. Quantification results of RAPID-SI are comparable to the CSI ones. The study shows that RAPID-SI provides accurate metabolite quantification results while significantly reducing acquisition time in obtaining MRSI data similar to CSI in terms of resolution and sensitivity.
Introduction
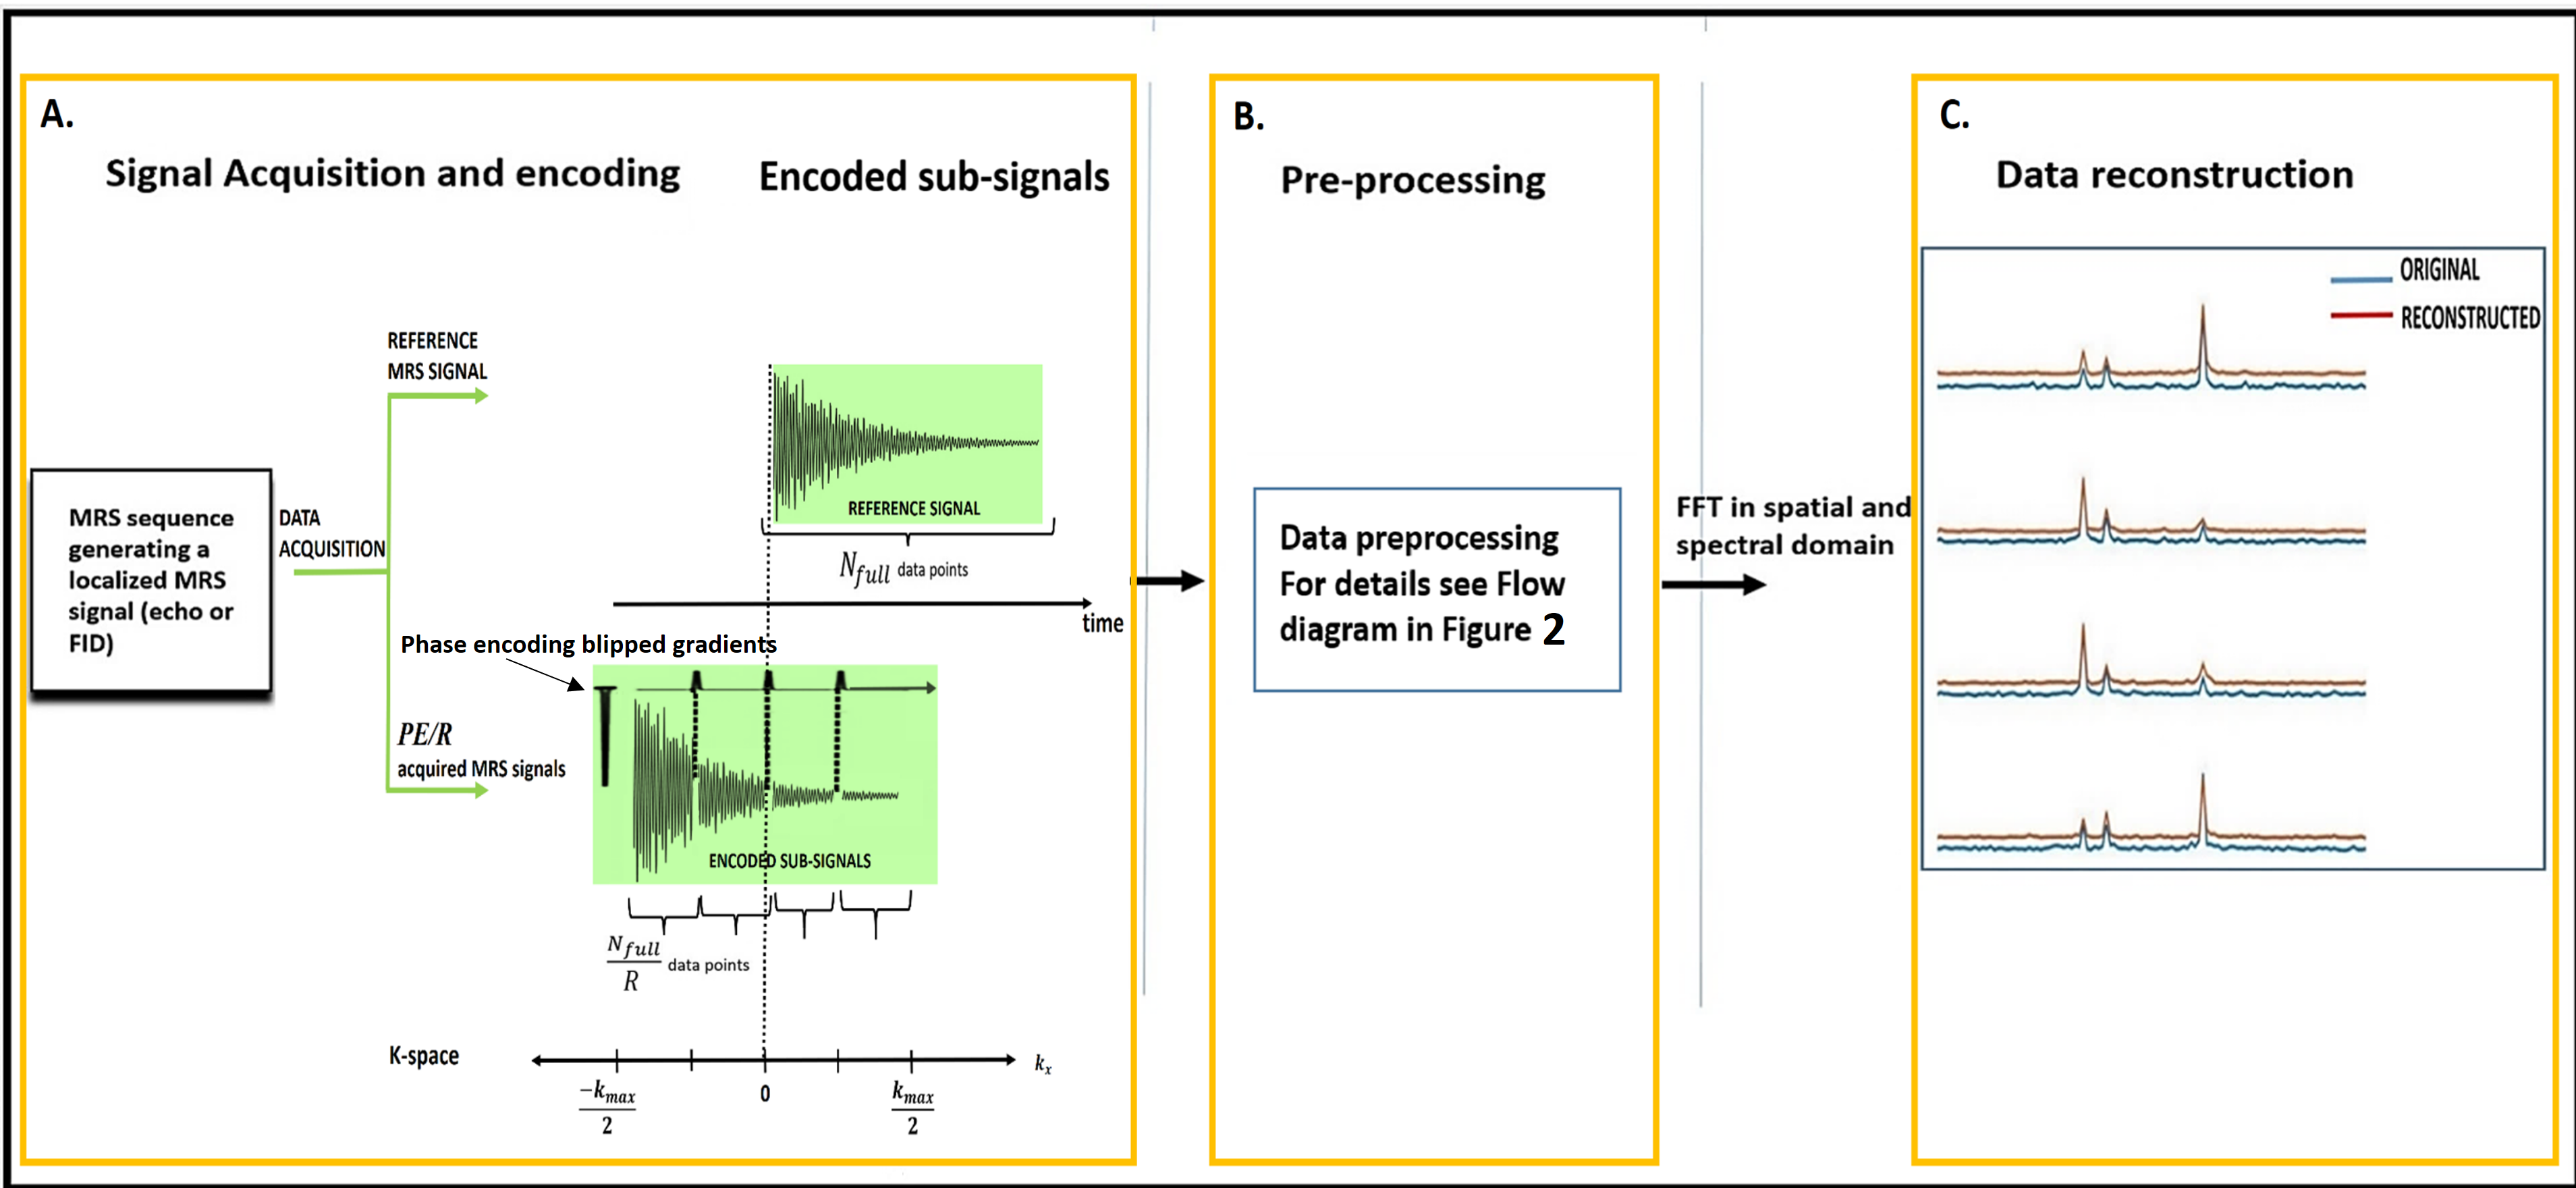
To overcome long acquisition times of Chemical Shift Imaging (CSI) 1, a new MRSI technique called Reduction of Acquisition time by Partition of the sIgnal Decay in Spectroscopic Imaging (RAPID-SI) and based upon insertion of blipped phase encoding gradients during signal acquisition has been proposed 2,3,4. To further demonstrate the usefulness of the proposed method in terms of acquisition time and data quantification, it was tested on healthy volunteers and compared to CSI.Methods
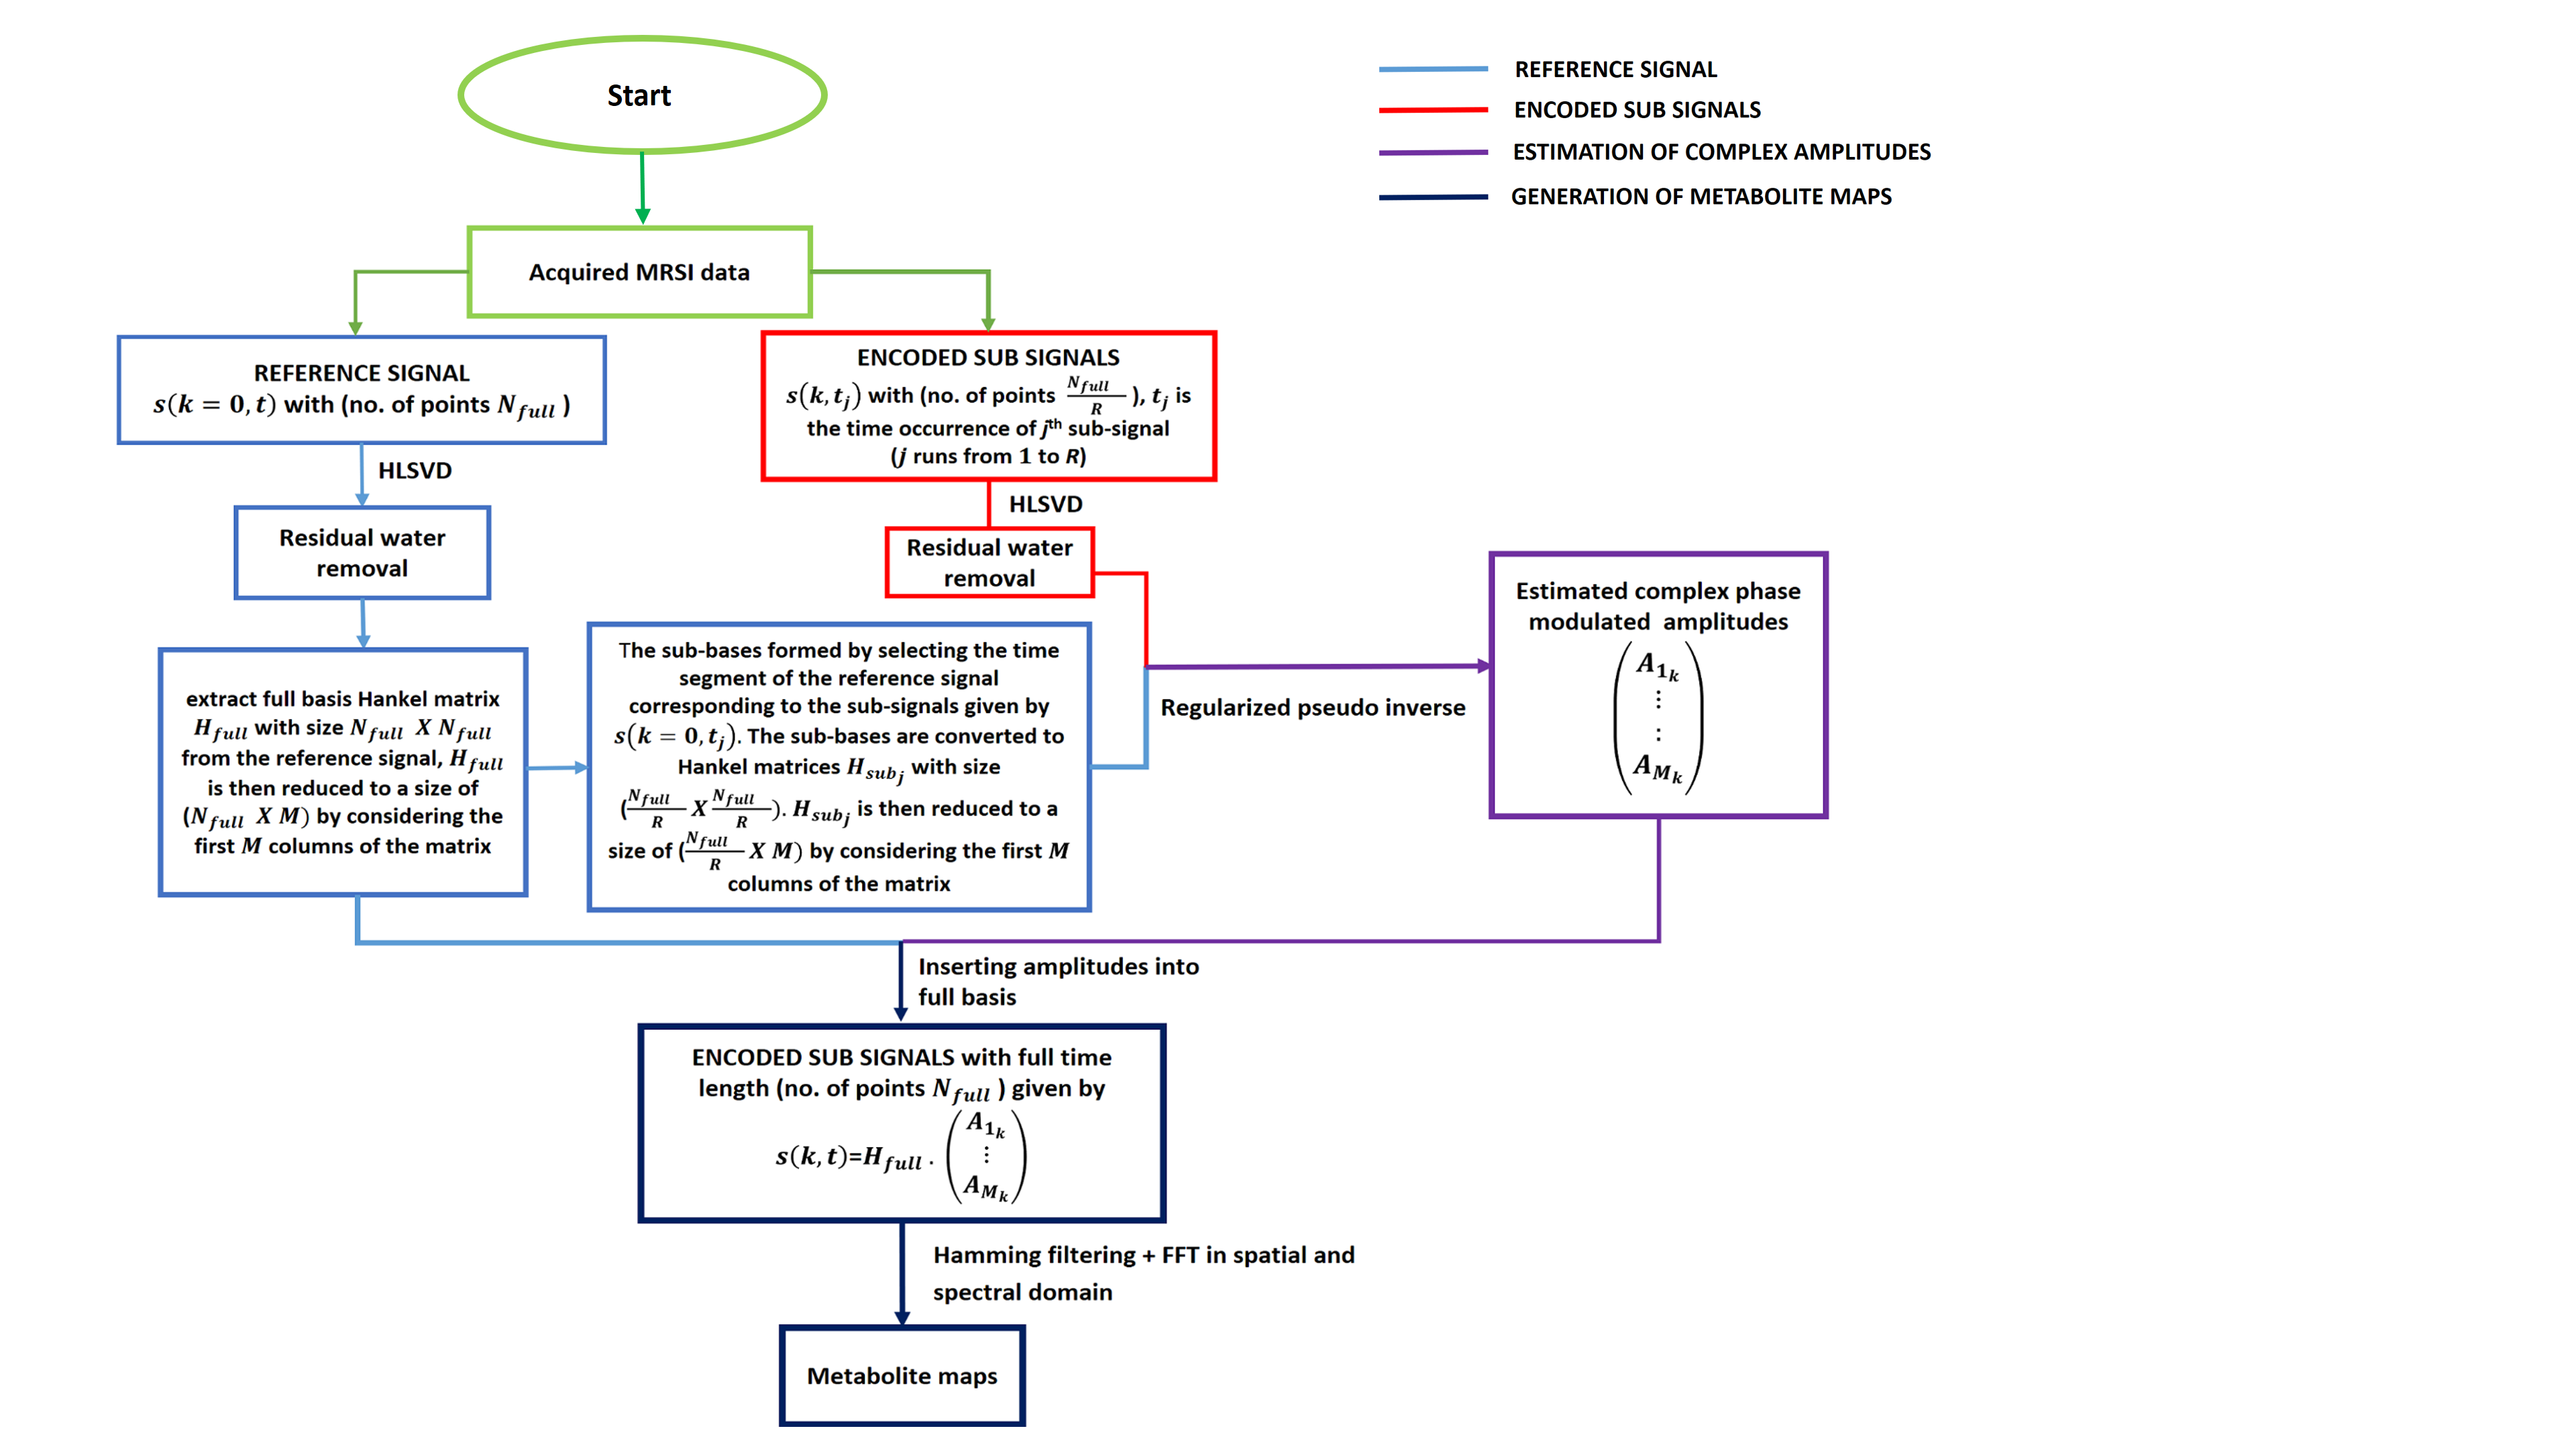
The sequence part of the RAPID-SI technique, displayed in Figure 1A, was implemented on a Siemens Tim-Trio 3T scanner, and accelerated in the anterior-posterior (AP) direction by inserting R ( R = acceleration factor) blipped gradients during data acquisition, and classical phase encoding applied along the right-left (RL) direction. The Flow diagram of the data pre-processing part of the technique is presented in Figure 2. The data pre-processing was performed offline in MATLAB. This validation study was approved by the Ethical Committee of the Ghent University Hospital. Eight healthy volunteers, aged 20 to 30 years, were scanned using both 8x8 and 16x16 2D RAPID-SI and 2D CSI data sets using the following acquisition parameters: TE/TR=35/2000 ms, BW=2000 Hz, Nacq = 512, Navg = 2, phase encoding steps (PE) = 8 and 16, and number of collected signals (FIDs) along blip (AP) direction = 1 (for PE=8) and 2 (for PE=16). The RAPID acceleration factor was set to R = 8 (AP direction) 2,3,4. The FOV dimensions along RL and AP direction = 100 mm, and slice thickness was set to 10 mm.Results and discussion
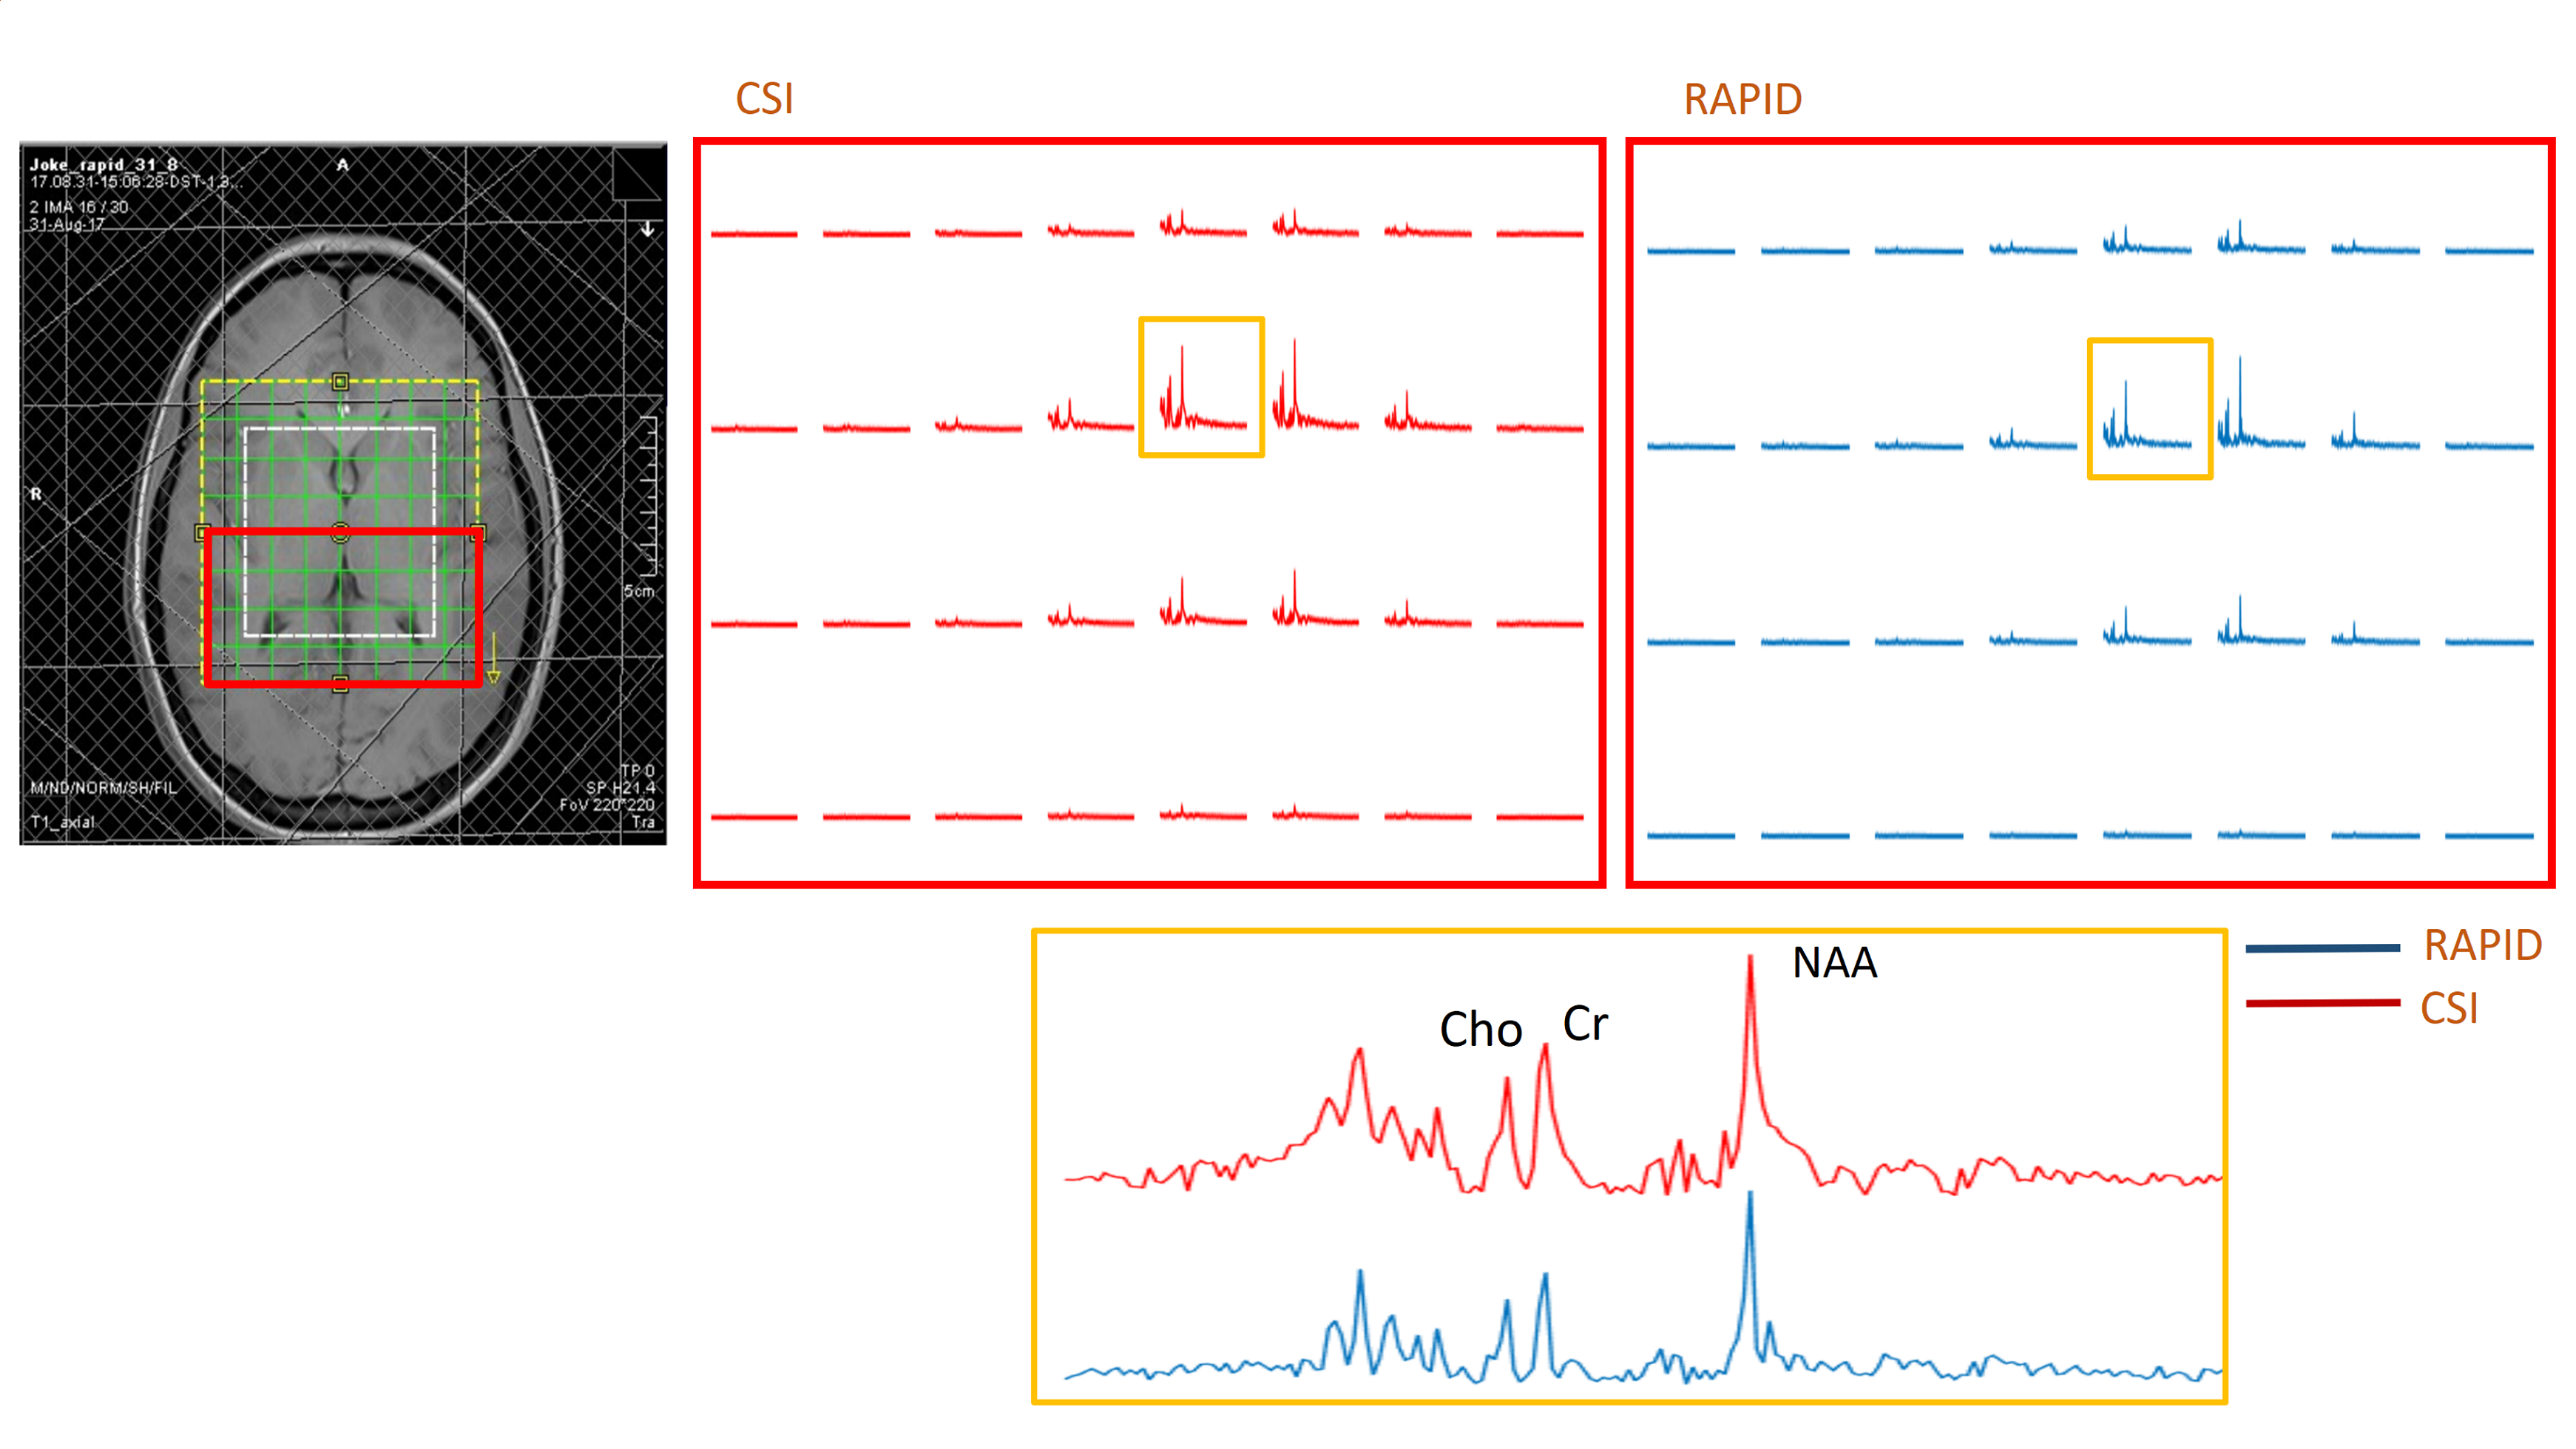
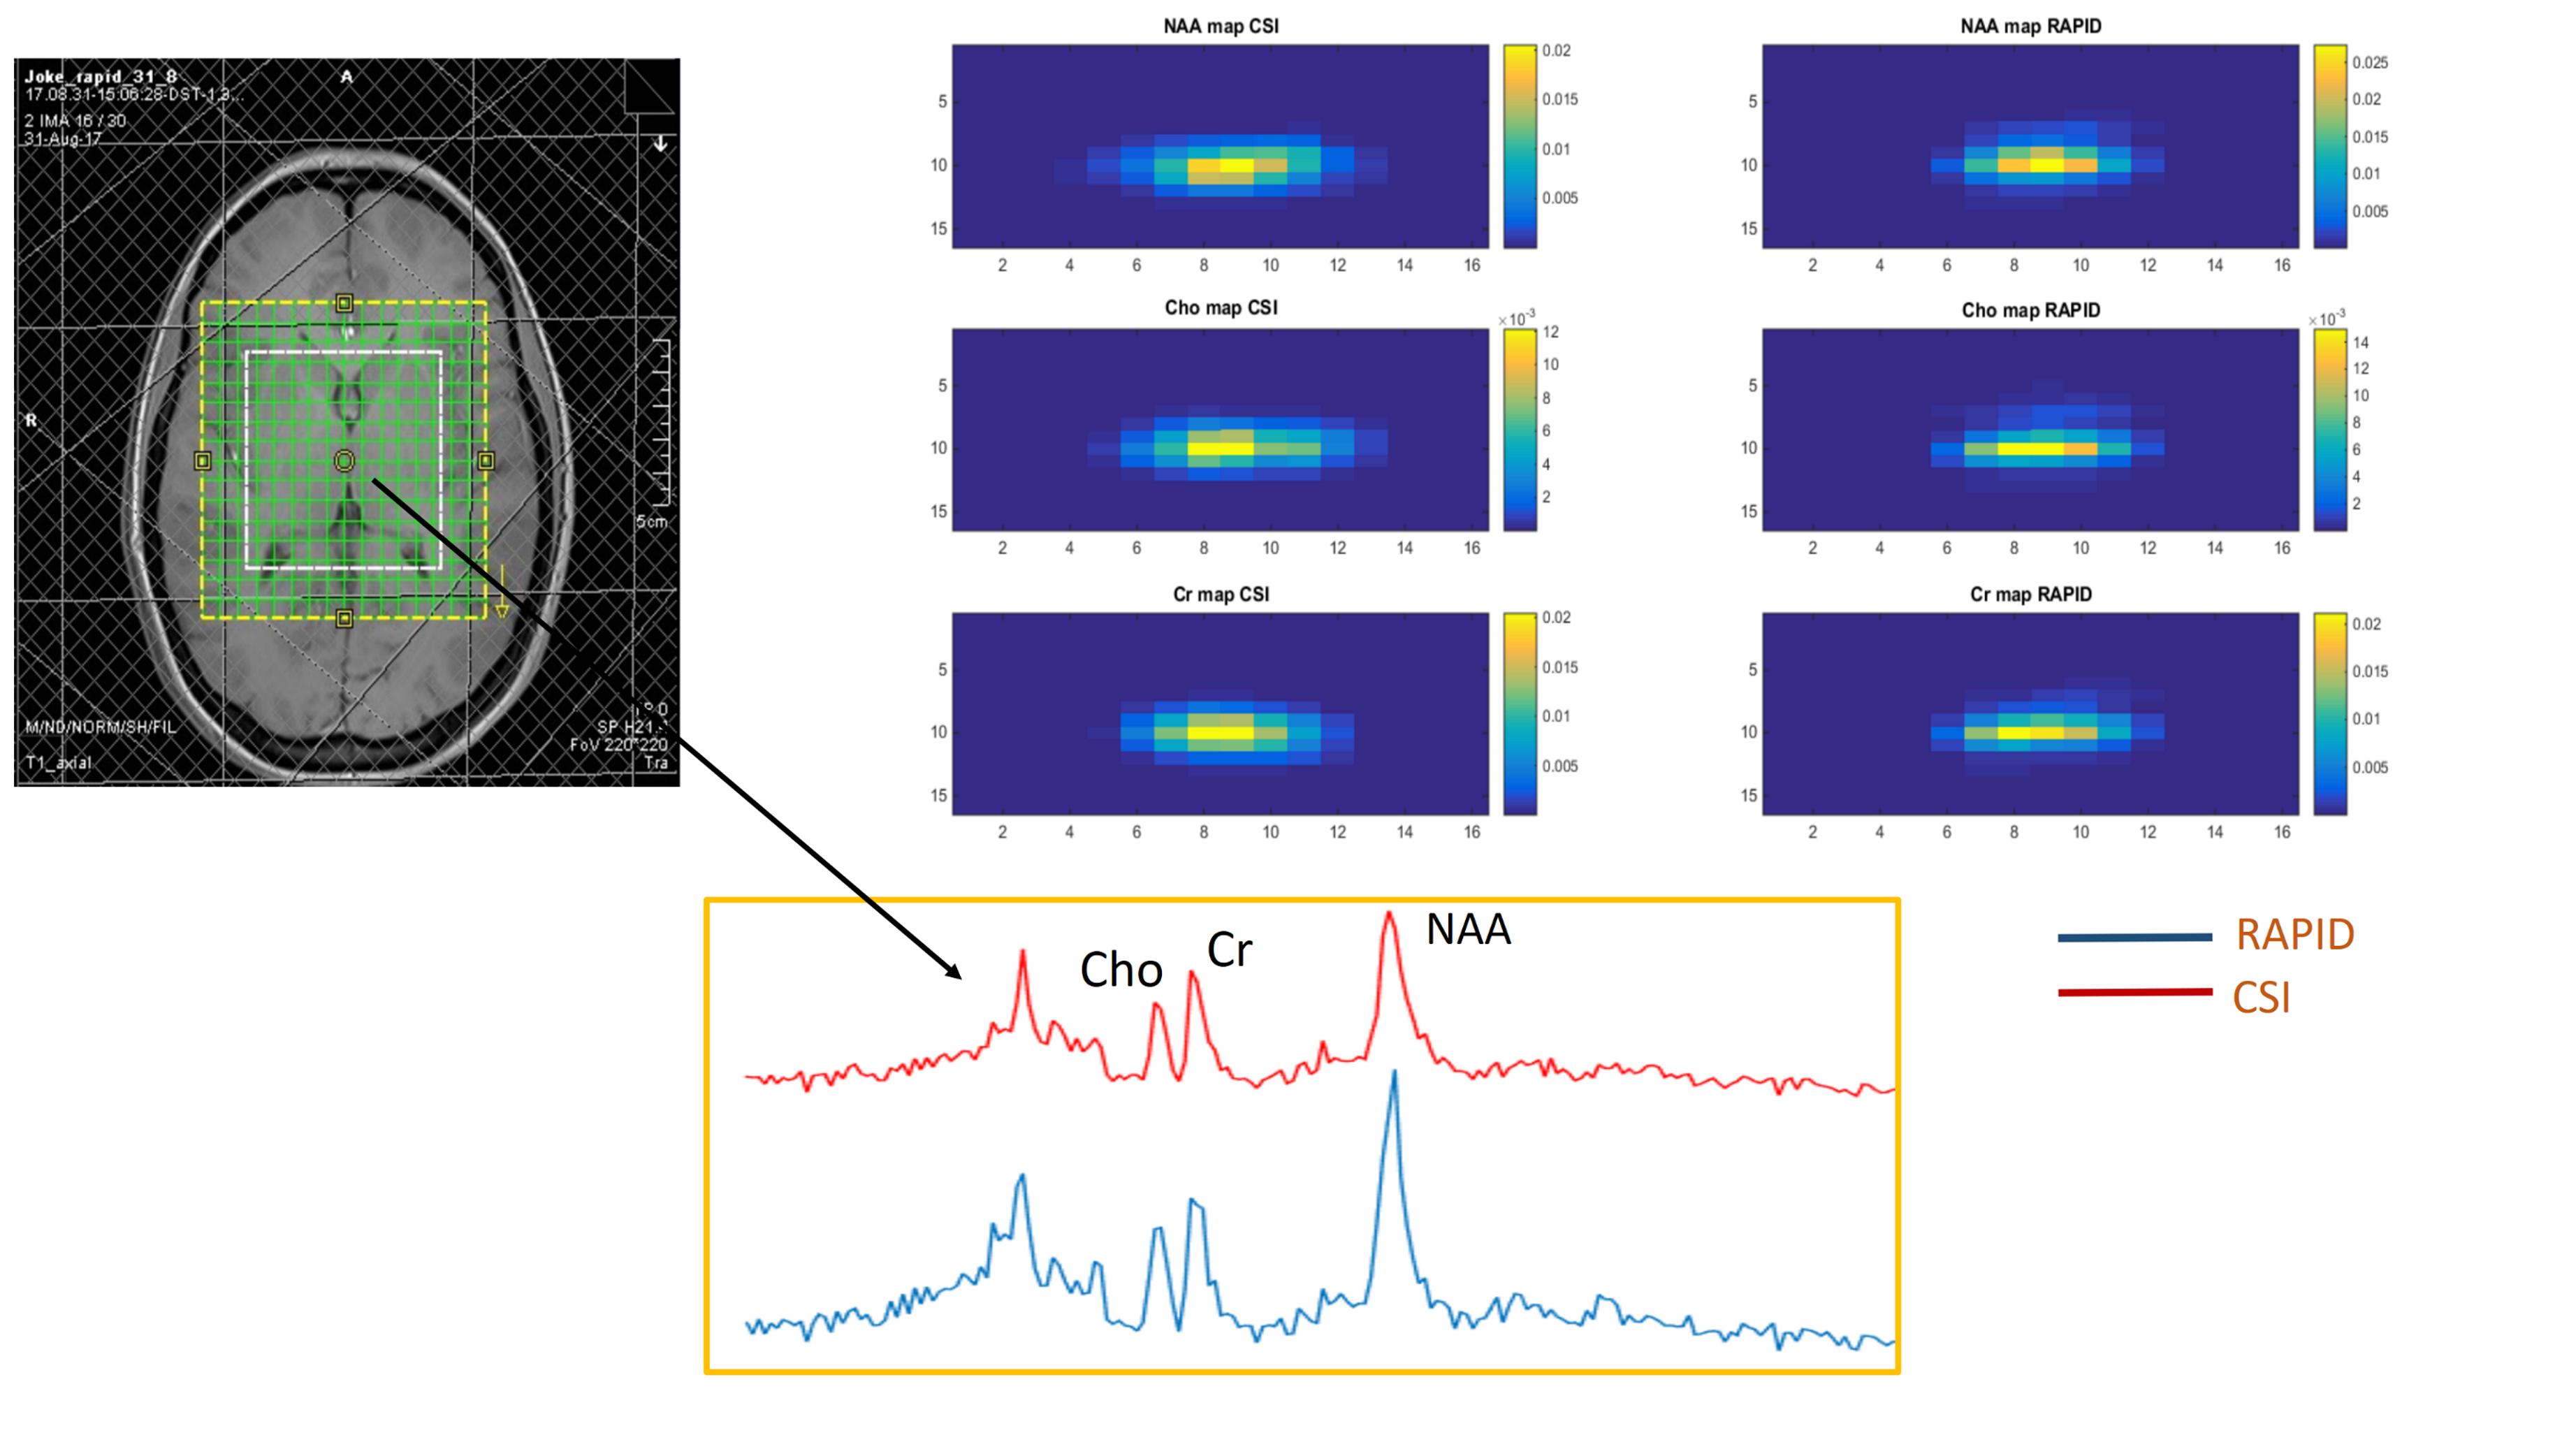
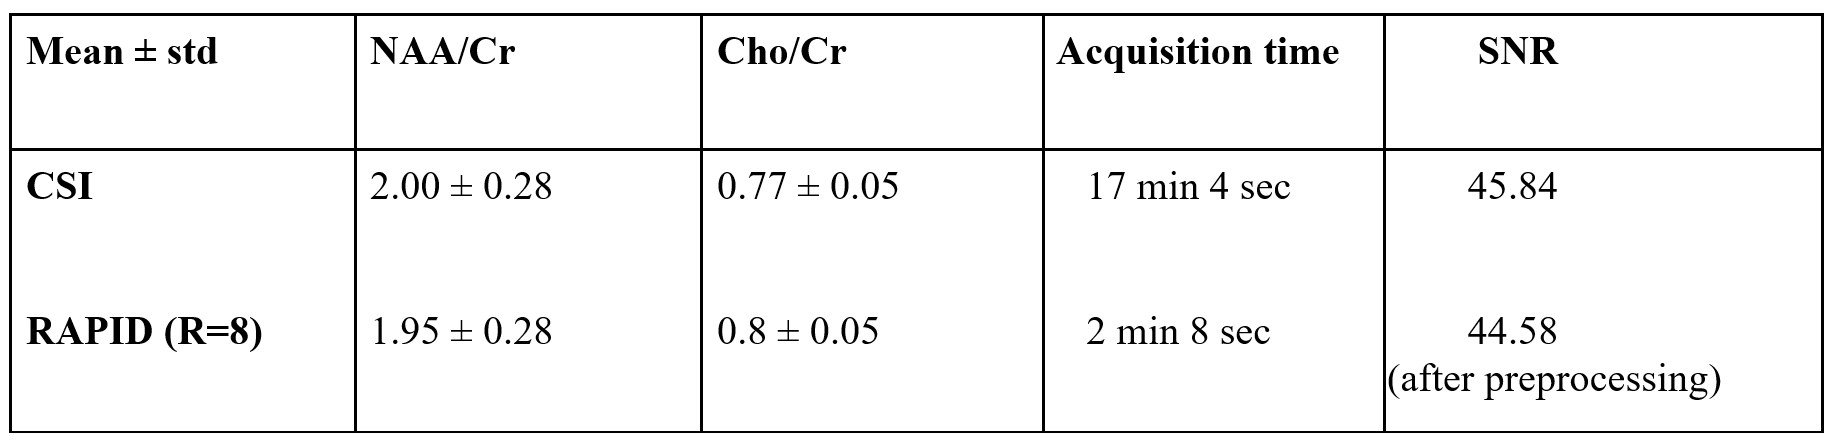
Compared to CSI, RAPID-SI shortened the acquisition time by the acceleration factor R . A 2D 16x16 data set acquired in about 17 min with CSI, was reduced to approximately 2 min with the RAPID-SI with R set to 8. The SNR in RAPID-SI was lower than CSI by approximately the factor √R . However, during data pre-processing, the SNR recovers to a value close to the CSI one as shown in Table 1 and displayed in Figures 3 and 4. The calculated NAA/Cr and Cho/Cr ratios of RAPID-SI and CSI reported in Table 1, were comparable.Conclusion
RAPID-SI reduces acquisition time, while preserving metabolites information, compared to CSI. The proposed method could be integrated into any localized MRS sequence (e.g: PRESS, STEAM) generating a FID or an echo. Furthermore, the method is flexible to be combined with other acceleration methods like parallel imaging, or compressed sensing.Acknowledgements
This work has been supported by the Flemish funding agency (FWO: Fonds voor Wetenschappelijk Onderzoek) grant number: G086912NReferences
1. Pohmann, R., et al. J Magn Reson, 1997. 129(2): p. 145-60.
2. Serrai H., et al (September 2016, Filed by European Patent Office, filing no: EP16188475.4).
3. Bhaduri.S, Achten.E, Serrai.H, ISMRM Benelux Chapter, 2017, 9th Annual meeting, Abstracts.
4. Bhaduri.S, Achten.E, Serrai.H, ESMRMB Congress, 2017, Abstracts.
Figures