1053
Dark-blood T2 mapping for improved assessment of the left ventricular subendocardium, right ventricle and left atrium1Yale University, New Haven, CT, United States
Synopsis
The accuracy of cardiac T2 mapping in small structures, such as the subendocardium, right ventricle, and left atrium, is impaired by the partial-voluming effect between myocardium and blood. In this work, we propose a dark-blood T2 mapping method that nulls the blood prior to the T2 quantification, so that partial-voluming is reduced and T2 estimation accuracy in these small structures is improved. Both conventional and the proposed dark-blood T2 mapping methods were performed in healthy subjects. The results demonstrated the potential of dark-blood T2 mapping to improve the clinical assessment of the subendocardium, right ventricle, and left atrium.
Introduction
Myocardial edema is clinically assessed through dark-blood imaging1 ( i.e. double inversion-recovery (DIR) turbo spin echo (TSE)), bright-blood T2weighted balanced SSFP (bSSFP)2, and T2 mapping3 which does not suppress the blood signal. Dark blood TSE provides a good myocardium-to-blood contrast, but less reliability compared to T2 mapping due its motion sensitivity. Several methods have been proposed to reduce the motion sensitivity. One method uses a conventional DIR but replaces the TSE readout with bSSFP4. Another method adjusts the DIR preparation, placing it partly in the previous cardiac cycle5. In this work, we propose a dark-blood T2 mapping technique that combines the strengths of these two methods, with the goal of improved mapping and visualization of edema in the left ventricular subendocardium and thin cardiac chambers, such as the right ventricle or left atrium.Methods
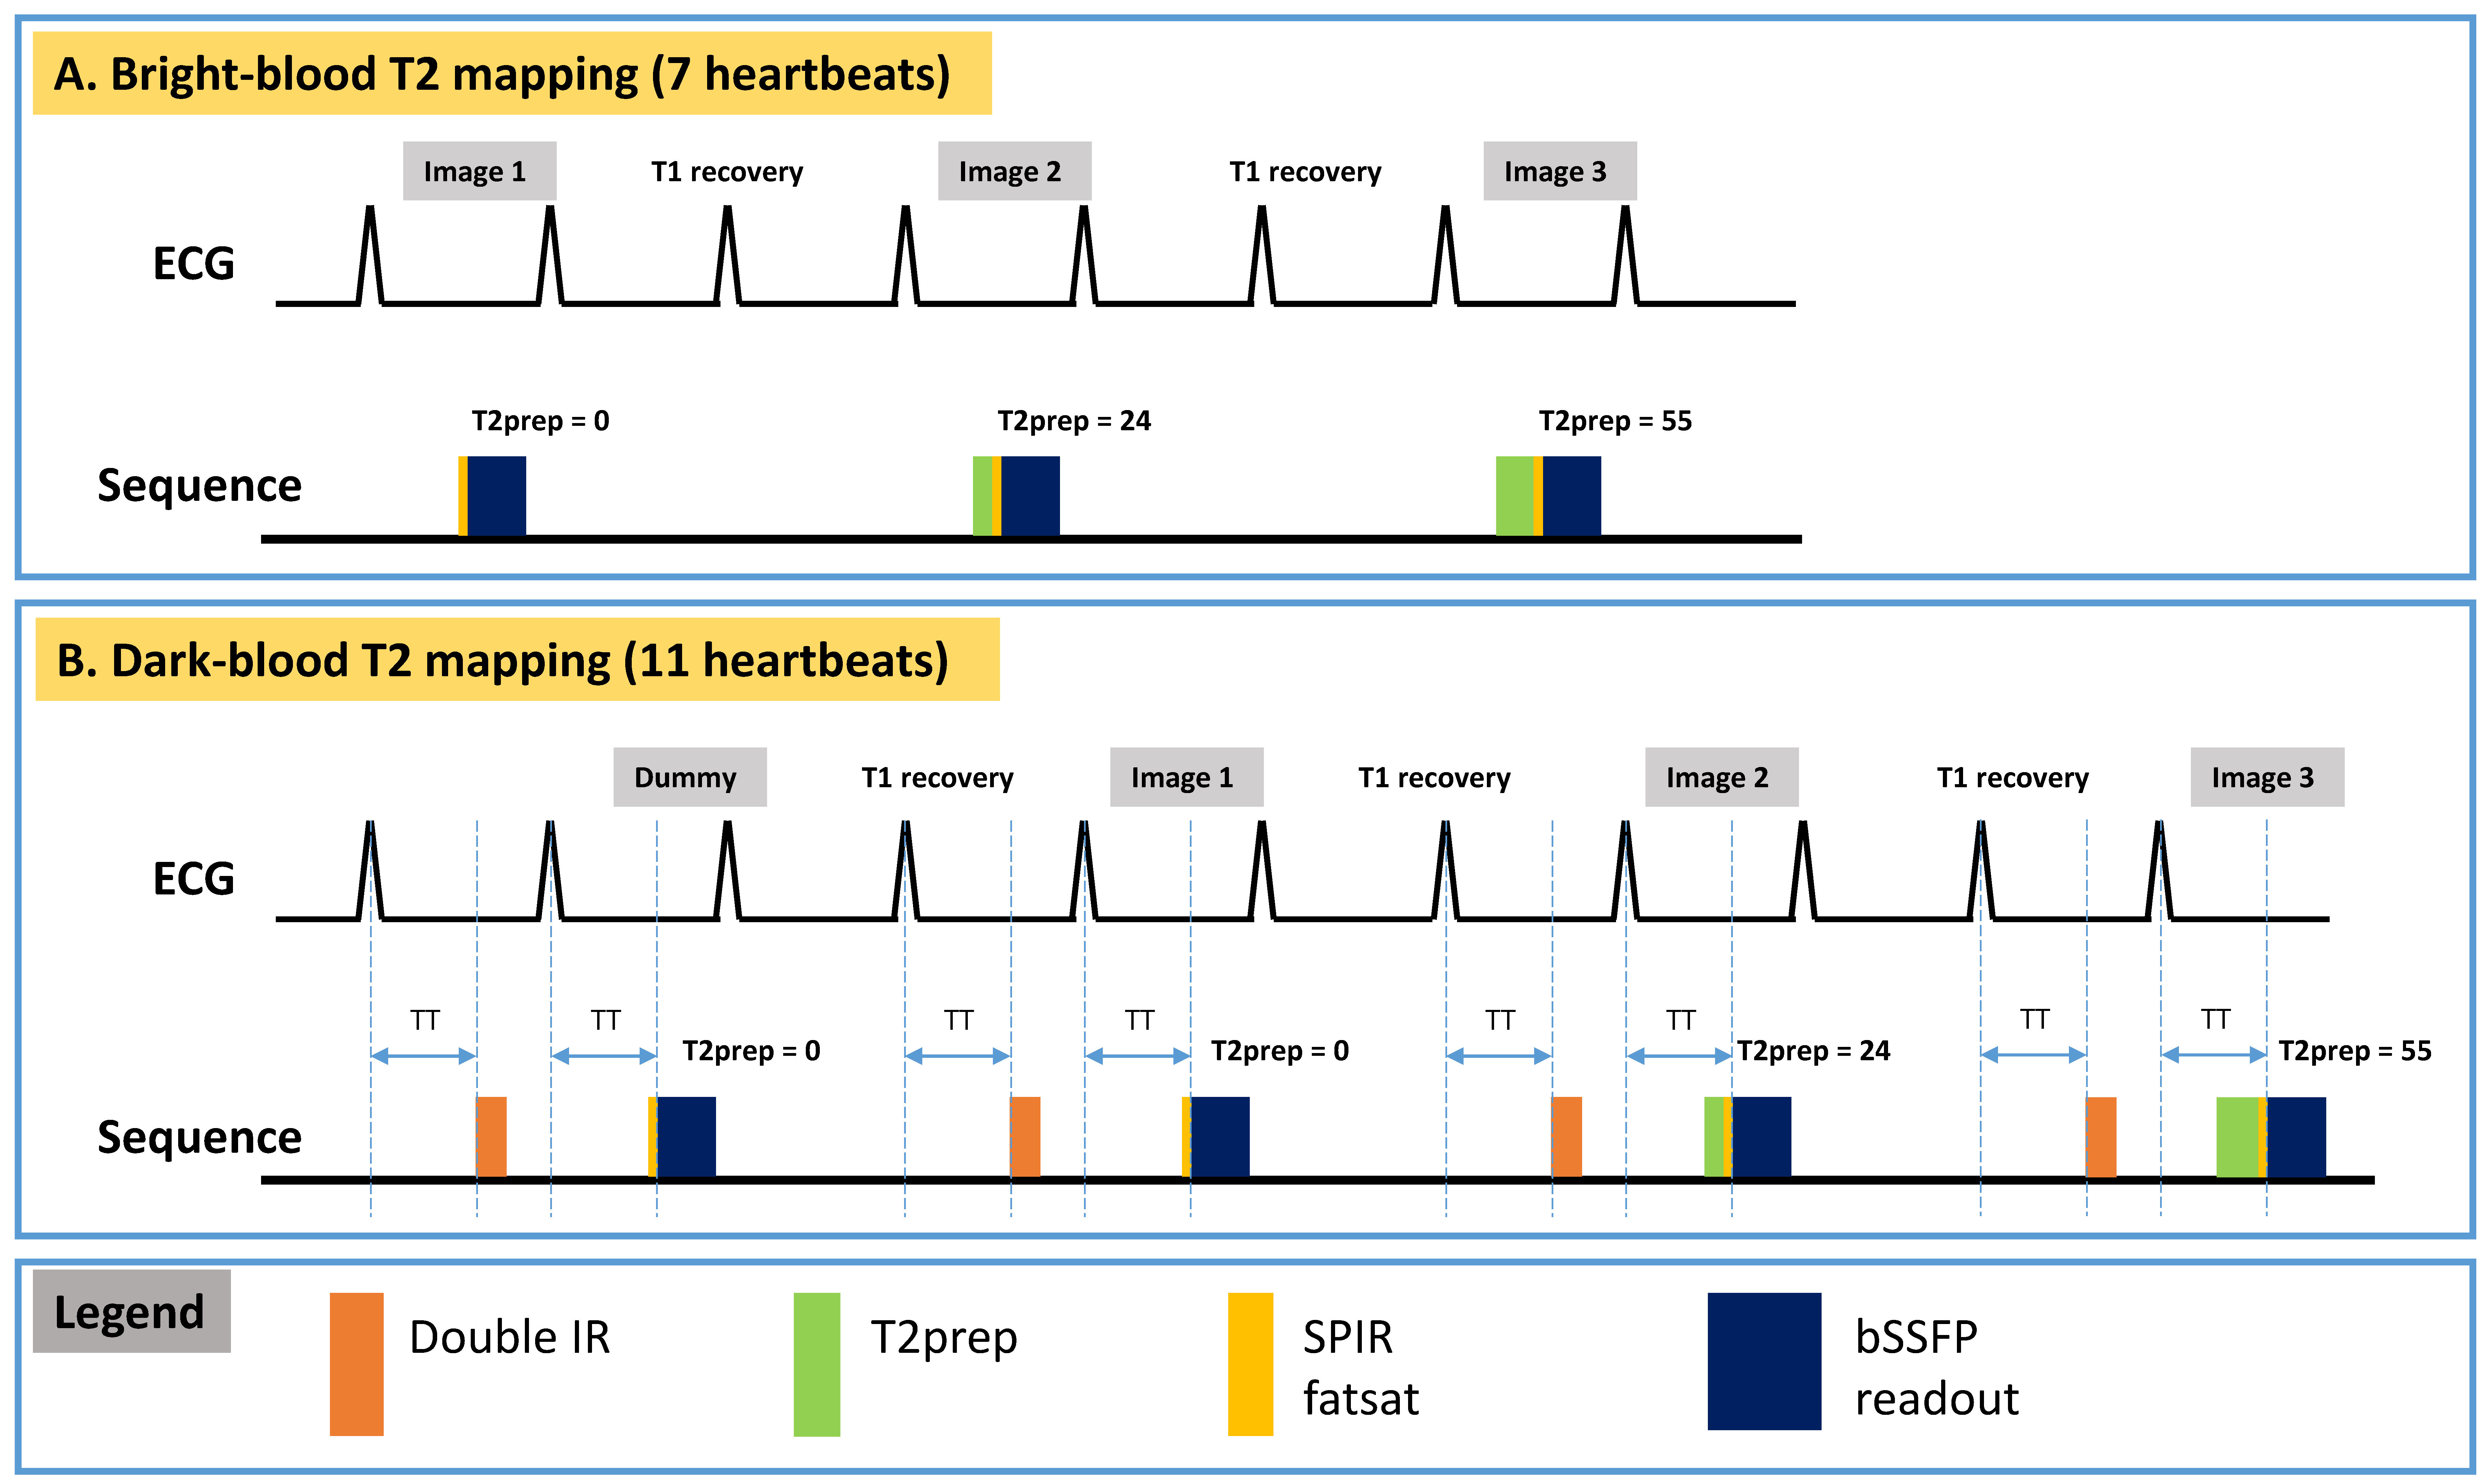
The schematic of the sequence is shown in Figure 1. Figure 1A shows the conventional bright-blood T2 mapping, which acquires 3 images in 7 heartbeats with one breath-hold. Each image is acquired with a single-shot bSSFP readout, preceded by a T2-prep to create a certain T2 contrast. The 3 T2-weighted images are then fit to a mono-exponential T2 relaxation model to estimate T2. Figure 1B shows the proposed dark-blood T2 mapping, which modifies the conventional method in two aspects. Firstly, a DIR preparation is applied before the T2-prep to null the blood signal. The DIR preparation is applied in the prior cardiac cycle, with the same trigger time as the bSSFP readout. This results in an inversion time of 1 RR interval, which for this sequence nulls the blood more accurately than the begin-systolic DIR1, since the acquisition is performed every 3 RR intervals and the blood signal is almost fully regrown. Secondly, a dummy scan with a T2prep-TE of 0ms is performed in the beginning to establish a steady state for the blood signal, necessitating a use of 11 heartbeats.
Healthy subjects were scanned with both sequences on a 3T scanner (Siemens Trio, Erlangen, Germany) with a 12-channel spine coil and a 6-channel body coil. All subjects provided informed consent and the study was approved by our IRB. Parameters for the two sequences were: FOV=360mmx270mm, image size: 192x108, slice thickness: 8mm, three TEs: 0, 24ms, 55ms, GRAPPA factor of 2, FA/TR/bandwidth = 30°/2.6ms/1532Hz/pixel. T2 maps were generated with motion correction and 2-parameter curve fitting.
Results
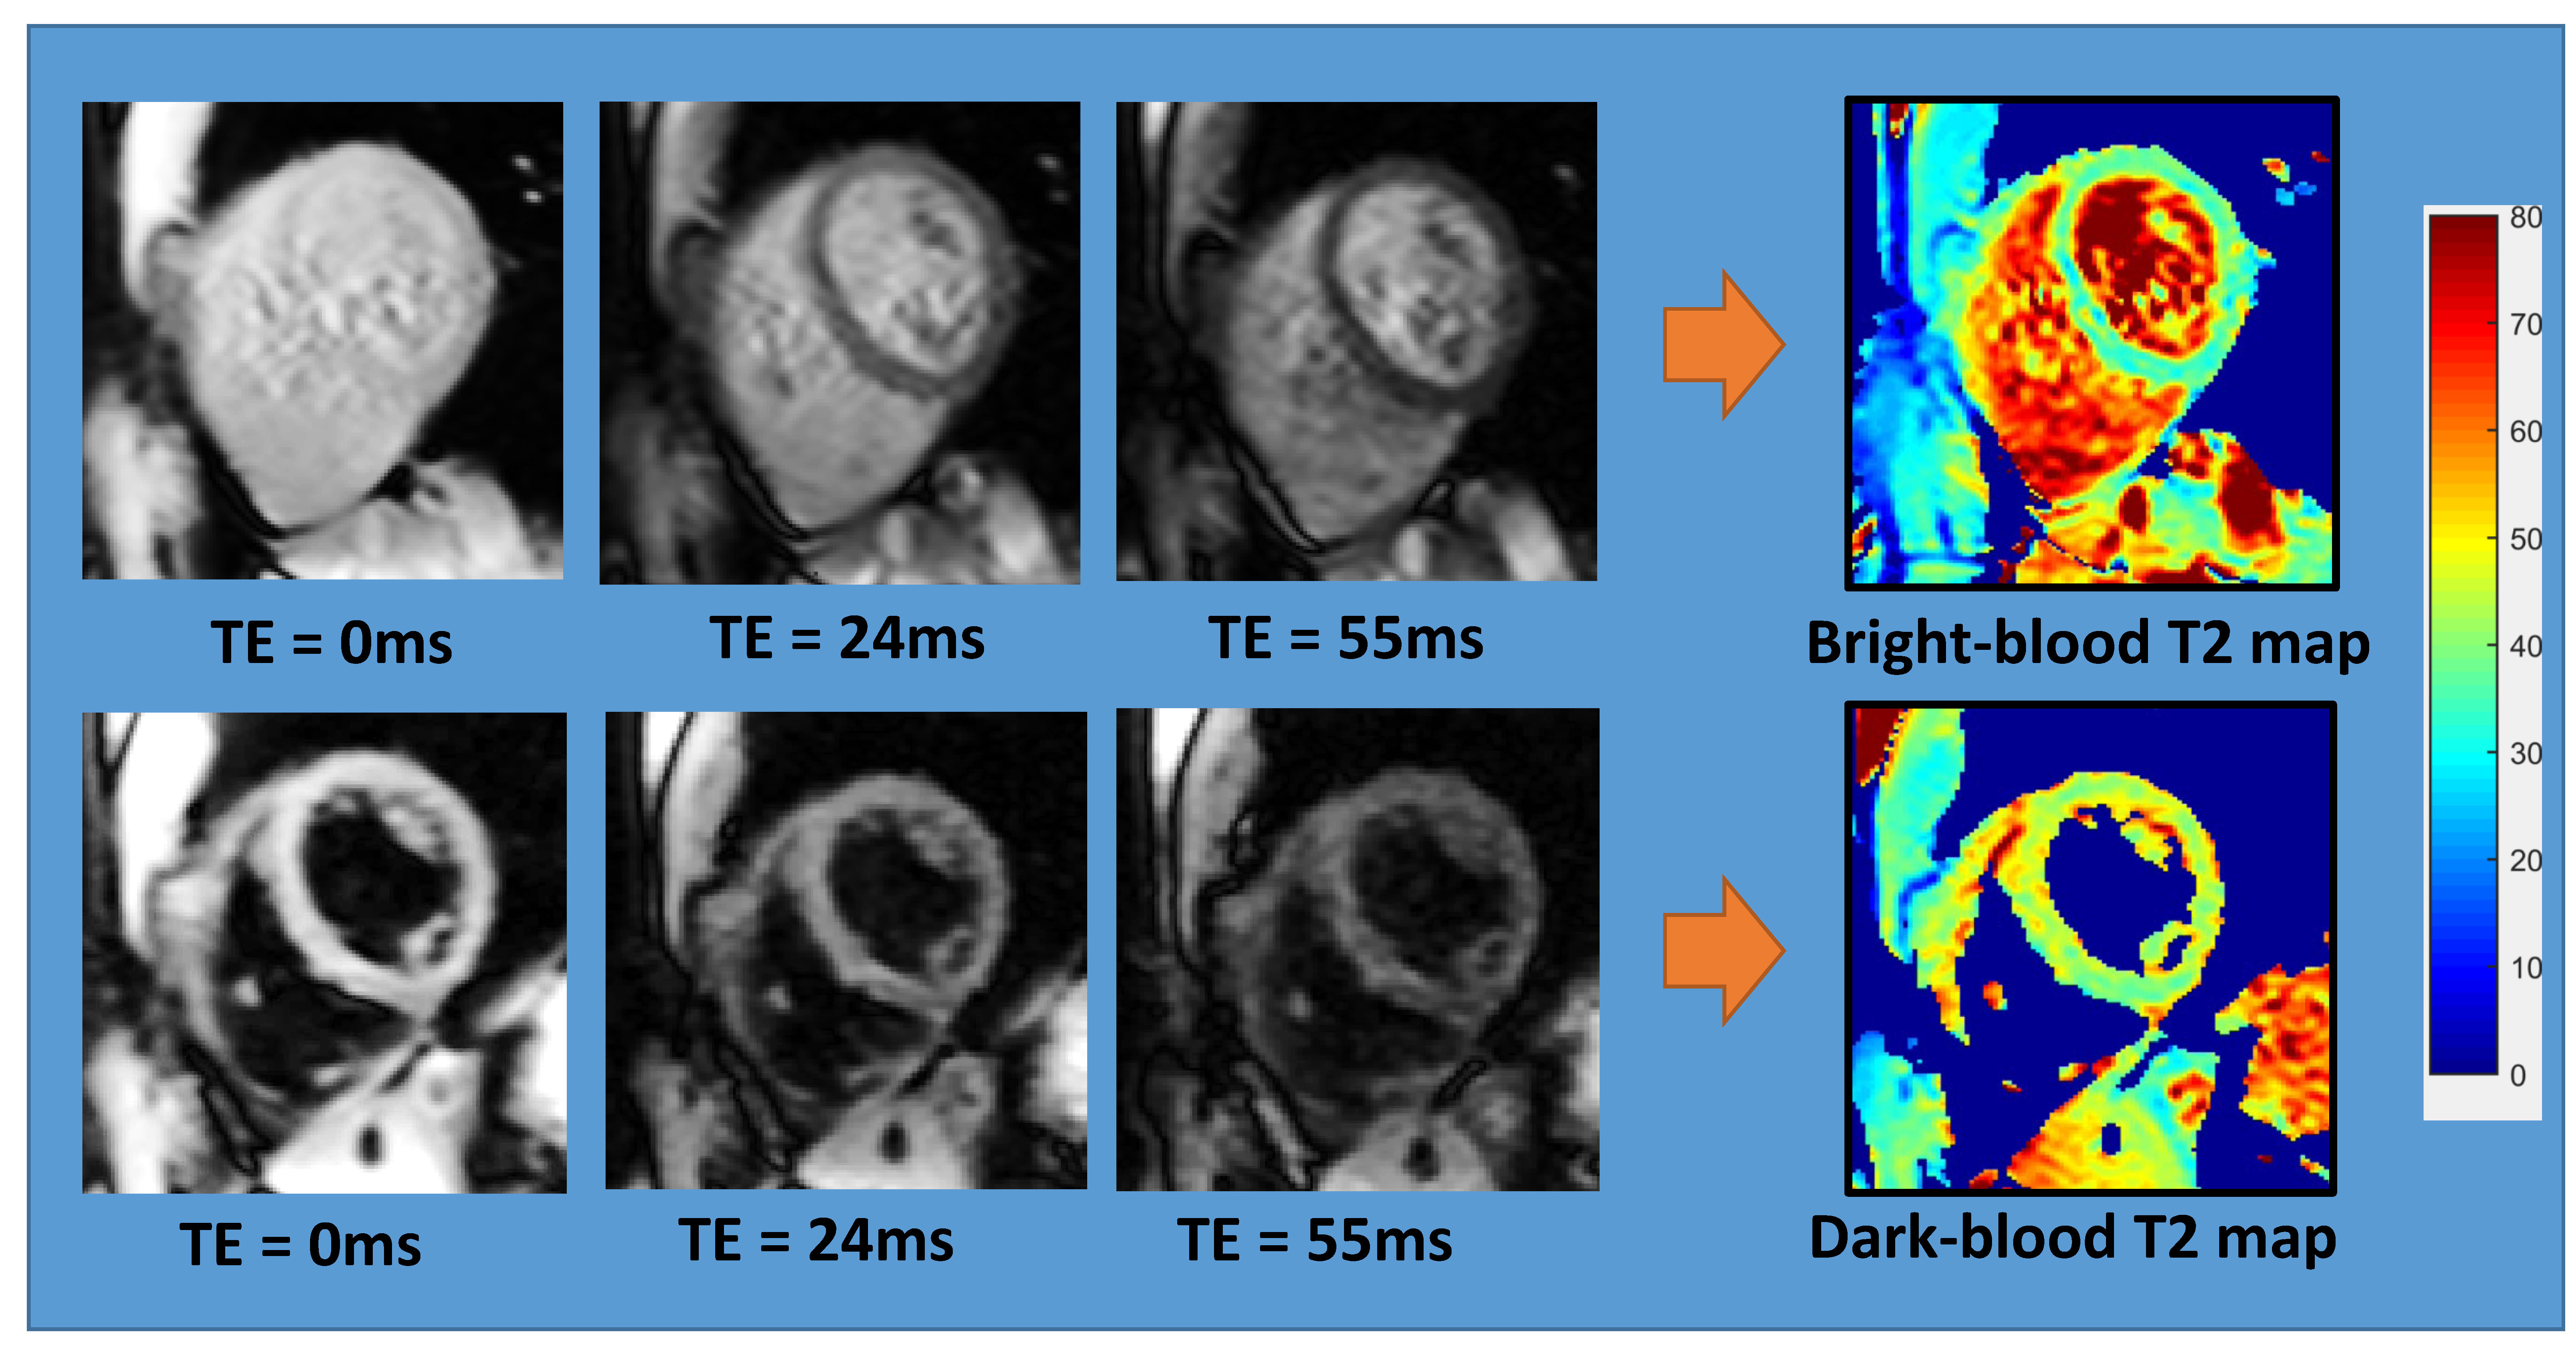
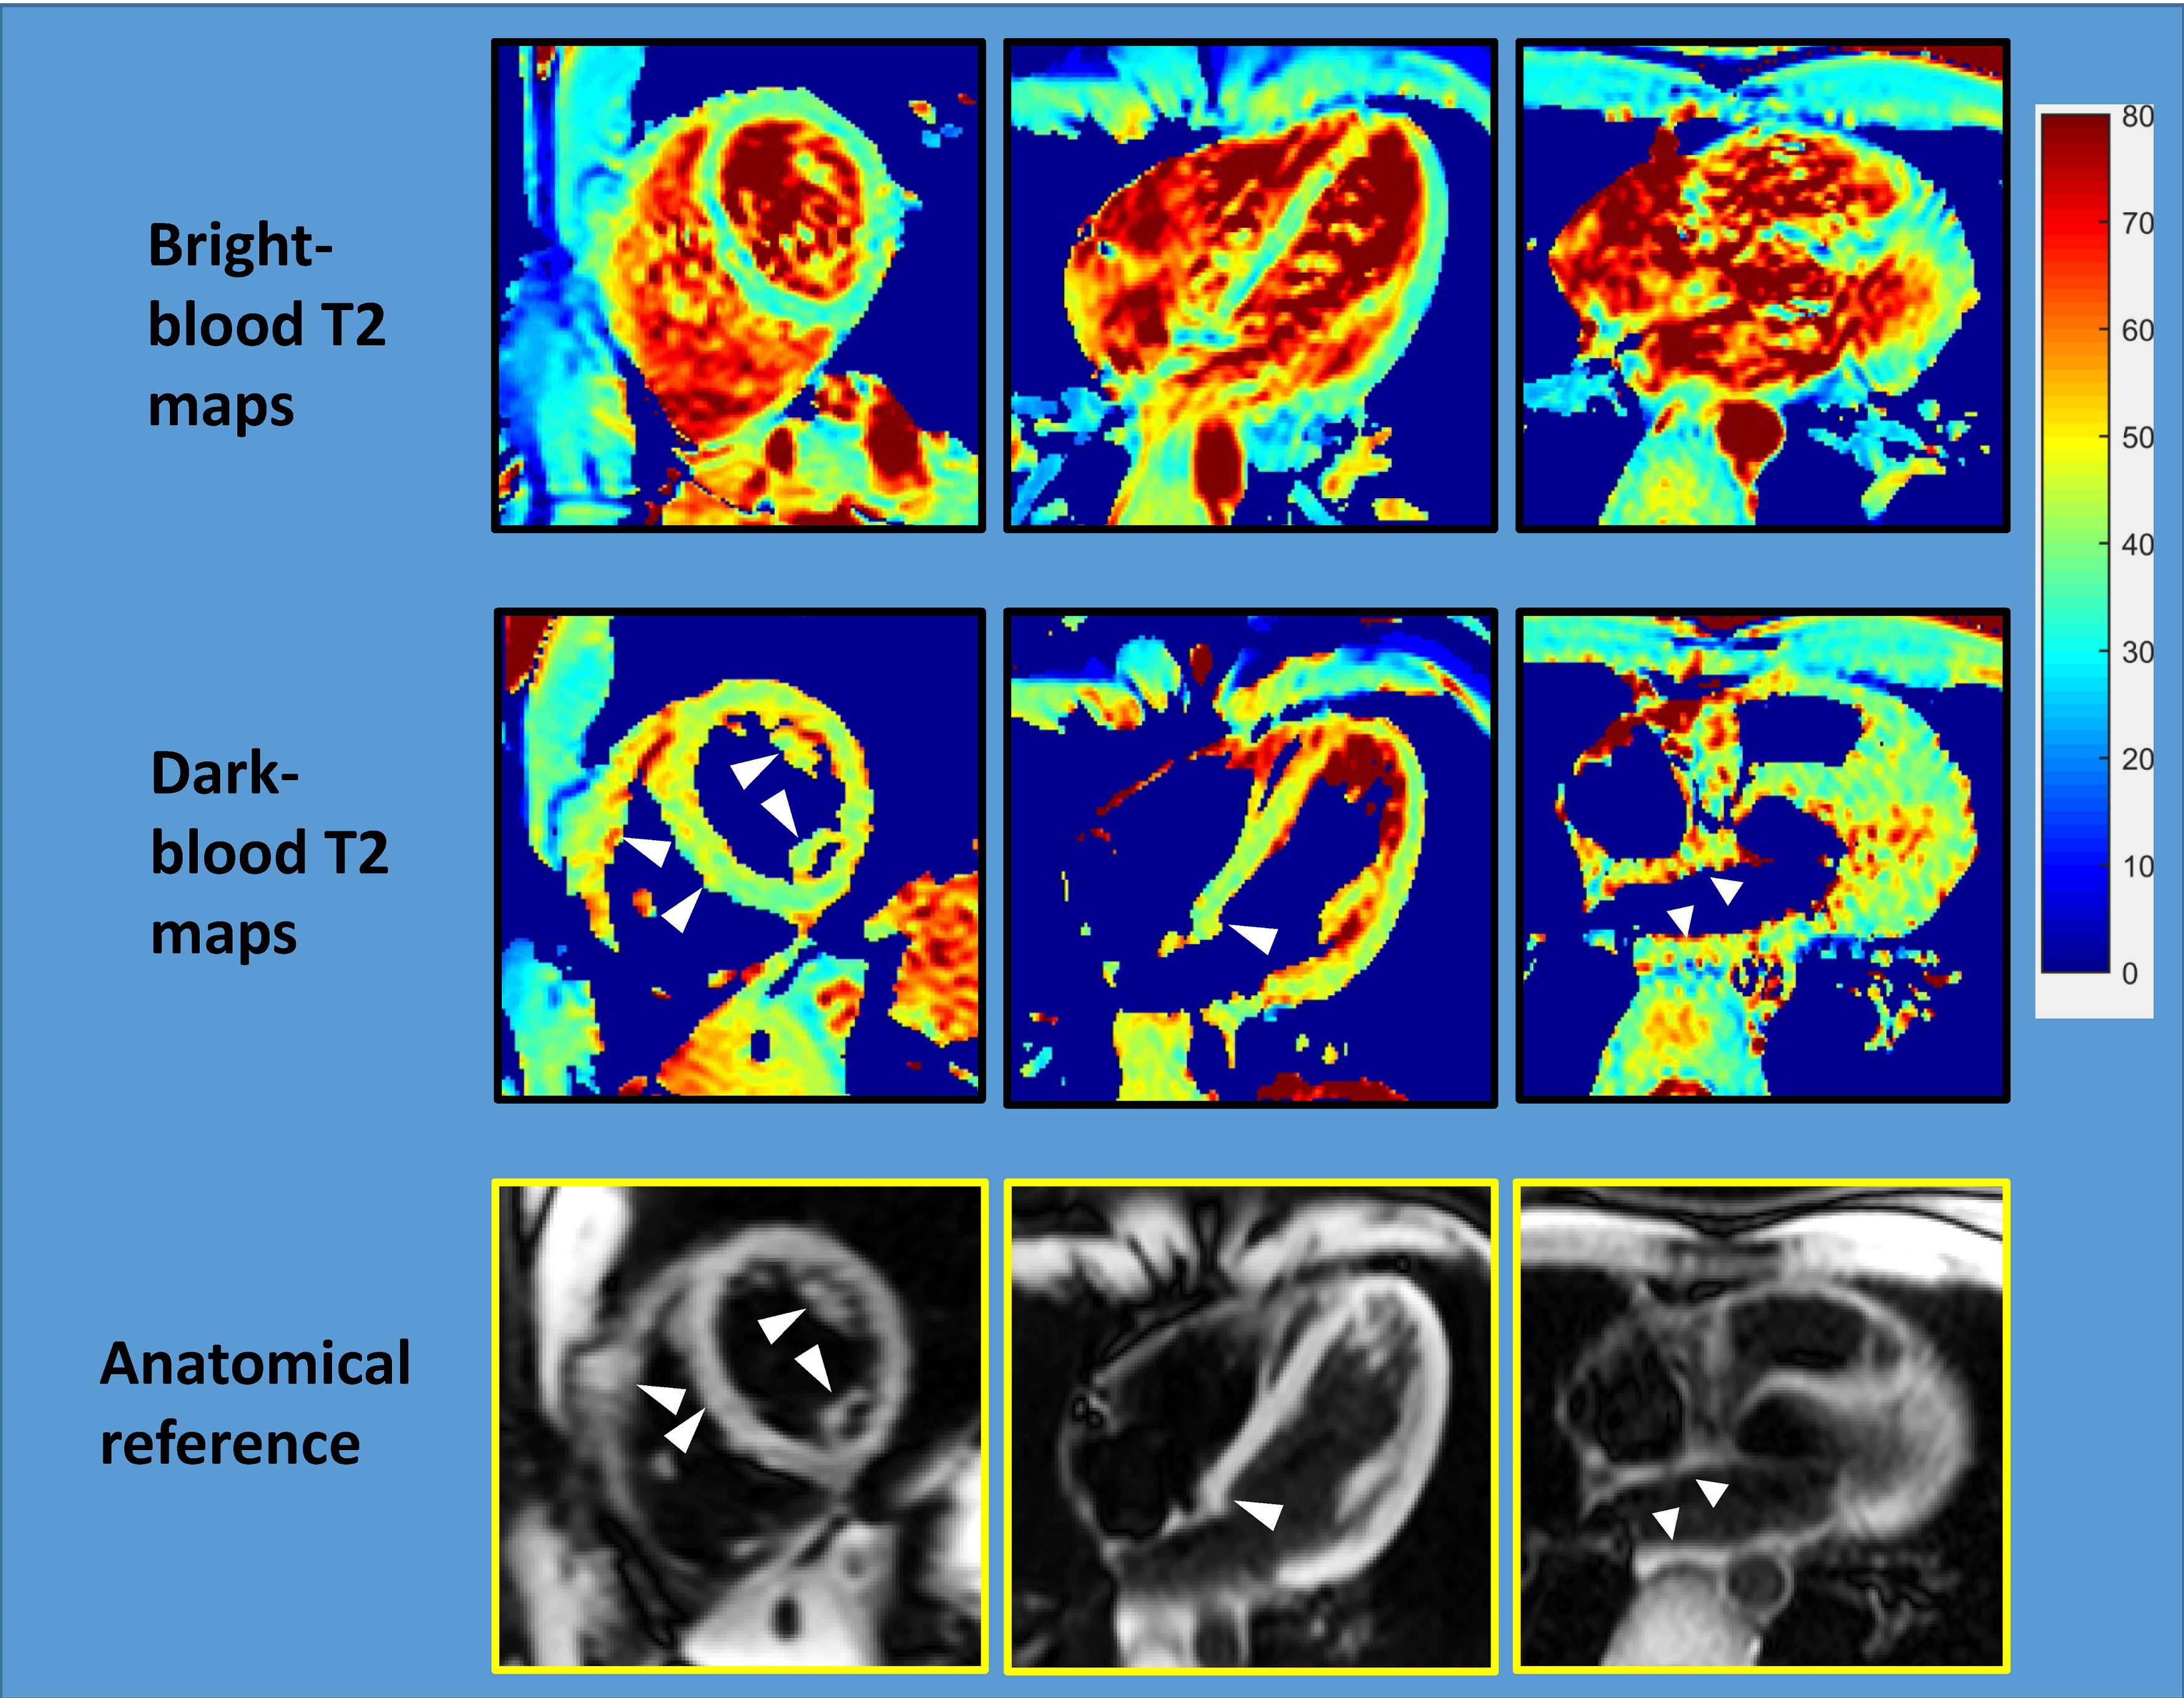
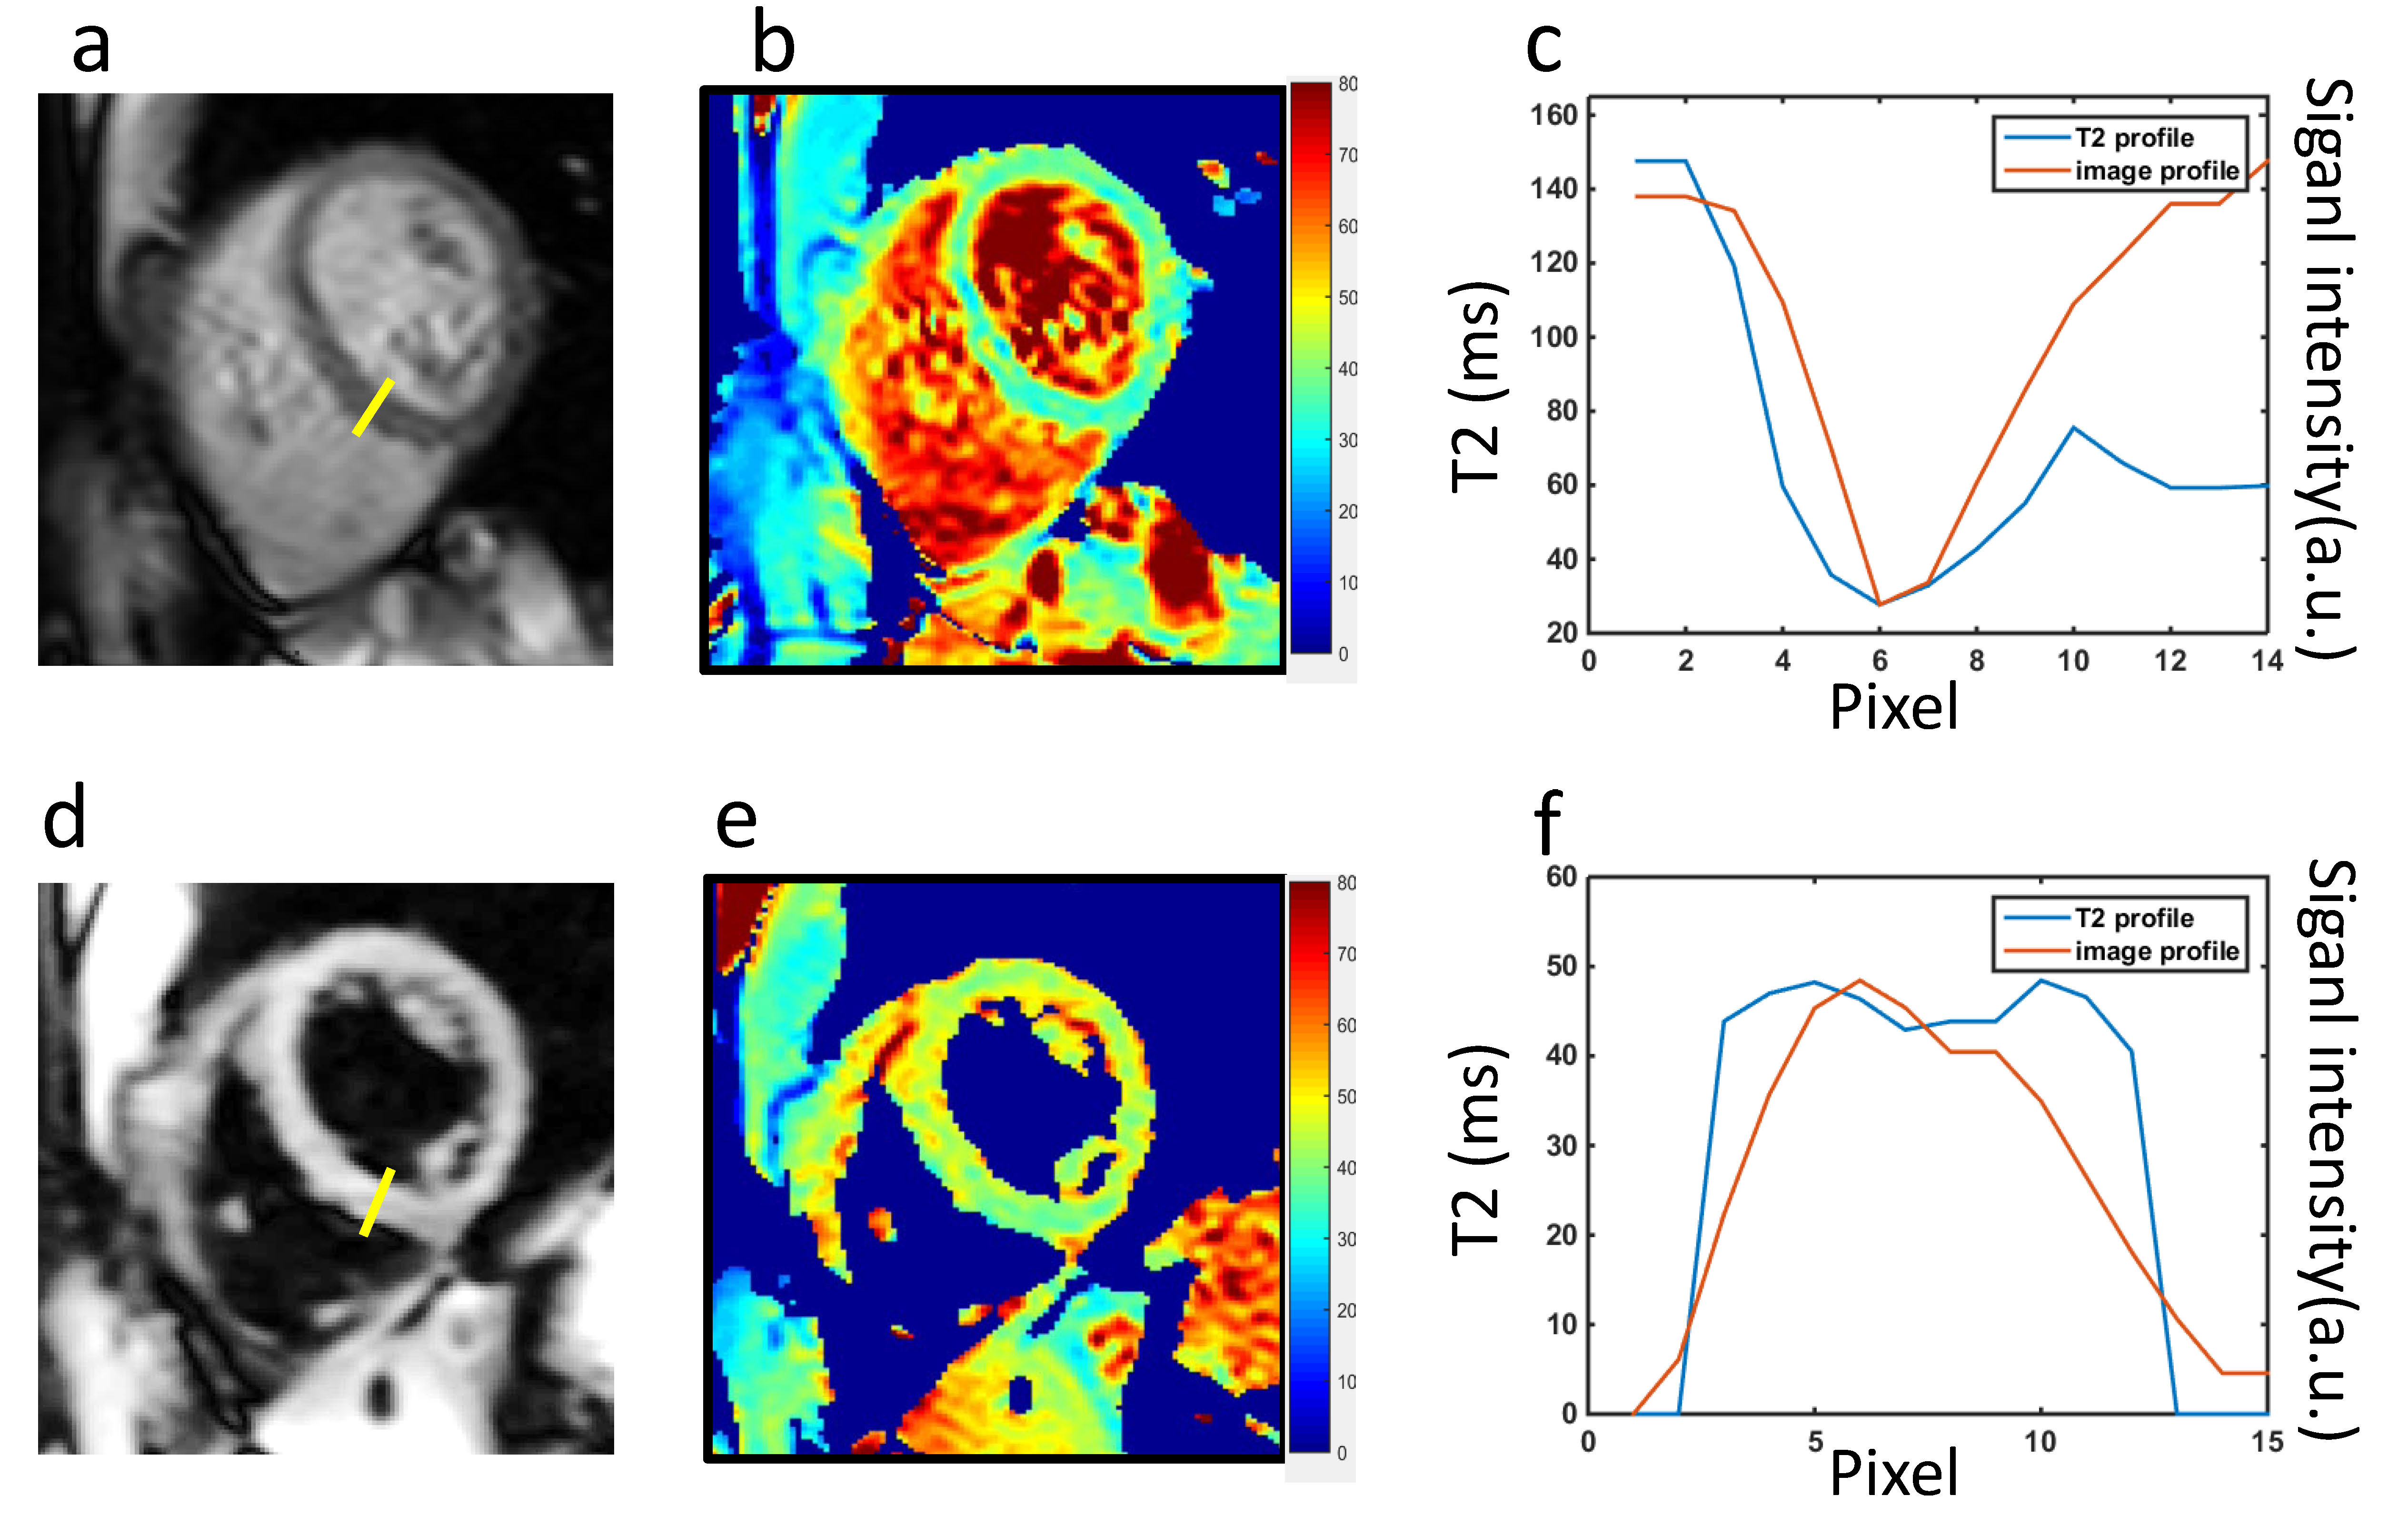
Figure 2 shows an example of the three images used to generate a T2 map with both methods, and the resulting maps. Figure 3 shows representative T2 maps of the left and right ventricles and the left atrium, estimated from a single volunteer, with the dark-blood T2-weighted images shown below as an anatomical reference. The average T2 values estimated from the bright-blood and dark-blood T2 mapping were 40.3ms ± 2.4ms and 44.7ms ± 0.9ms in the short-axis view, and 41.7ms ± 1.70ms and 45.7ms ± 0.5ms in the long-axis view, respectively. Figure 4 shows a cross-sectional plot of septal T2 for each method, in comparison to the cross-sectional signal in the same location from the acquired T2-weighted images (TE=24ms). The bright-blood T2 profile shows a narrow region in the middle, where the value reflects myocardial T2, and a transition zone, where the accuracy of T2 is compromised due to the partial-voluming. In contrast, dark-blood T2-mapping eliminates the presence of this transition zone. This observation indicates that in structures with significant partial-voluming, e.g. the right ventricle, the left atrium, papillary muscle, and subendocardium, dark blood T2 mapping improves the possibility of accurate T2 estimation.Conclusions
Partial-voluming of blood and myocardium may cause dramatic T2 elevation in the subendocardium and thin walls of right ventricle and left atrium, preventing accurate T2 mapping in these regions. In this work, we demonstrate the potential of dark-blood T2 mapping to reduce the partial-volume effects in these areas and improve mapping quality.Acknowledgements
No acknowledgement found.References
1. Simonetti et al., Radiology 1996; 2. Payne et al., Circ Cardiovasc Imaging 2011; 3. Giri et al., JCMR 2009; 4. Edelman et al., JCMR 2016; 5. Hu et al., JMRI 2017.Figures