1047
Automatic AHA model segmentation of cardiac T1 maps with deep learning1Fondazione Toscana "G. Monasterio", Massa, Italy, 2University of Pisa, Pisa, Italy, 3Fondazione Toscana "G. Monasterio", Pisa, Italy
Synopsis
We proposed a fully automated approach for the segmental analysis of T1 mapping using a fully convolutional neural network architecture. T1 maps acquired using the MOLLI sequence from 394 subjects were considered. Excellent segmentation results are demonstrated by high Jaccard (0.969±0.023) and a Dice (0.984±0.012) indexes. No significant difference in the obtained segmental T1 values compared to manual measurements was found, with a mismatch percentage ranging from 0.95% to 3.14% across segments.
Introduction
T1 mapping has been shown to be an established technique that permits both spatial visualization and quantification of myocardial tissue alterations of T1, focal or diffuse, in different cardiac pathologies [1]. Regional analysis of T1 maps can be performed by dividing the myocardium into 16 segments as defined by the American Heart Association guidelines [2]. However, such analysis requires the manual drawing of several ROIs, which is usually a time-consuming and operator-dependent task. In this study, we propose an automatic method for the segmentation of cardiac T1 maps using deep learning strategies.Methods
T1 mapping: mid-ventricular short-axis T1 maps were acquired using the MOLLI sequence with the 3-3-5 scheme [3] from 394 subjects. Imaging parameters were set as follows: FOV 350x290 mm2, in-plane resolution 1.9x1.9 mm2, slice thickness 8 mm, TE/TR 1.2/2.4 ms, flip angle 30°, SENSE factor 2, partial Fourier 0.75. T1 maps were reconstructed offline through pixelwise fitting using a three-parameter-monoexponential model.
Manual segmentation: manual segmentation of six myocardial segments was performed according to the AHA cardiac model [2]. ROIs were also drawn in the LV and RV blood pools by carefully avoiding papillary muscles.
Deep learning segmentation: a fully convolutional neural network architecture (U-Net) [4] was adopted. Our U-Net model was fed with raw MOLLI images, i.e. the eleven images at different inversion times, plus the T1 map and was trained to provide as output a 10-classes mask (the six myocardial segments, two blood pools, the cardiac region and background) and the associated softmax probabilities. A minimum value of class probability was used to perform an erosion step of the segments in order to avoid blood pool contamination on T1 estimation. The whole dataset was split into training set (n=298), validation set (n=21) and test set (n=75) for performance evaluation. During training random rotations (range [-90°,+90°]) were used for data augmentation and weighted loss function was chosen to cope with class imbalance.
Performance evaluation: Jaccard and Dice similarity metrics were used to evaluate the quality of the segmentation. The average value of T1 in myocardial segments and blood pools was calculated. Also, the orientation of each segment was estimated to measure the angular error with respect to manual segmentation.
Results and discussion
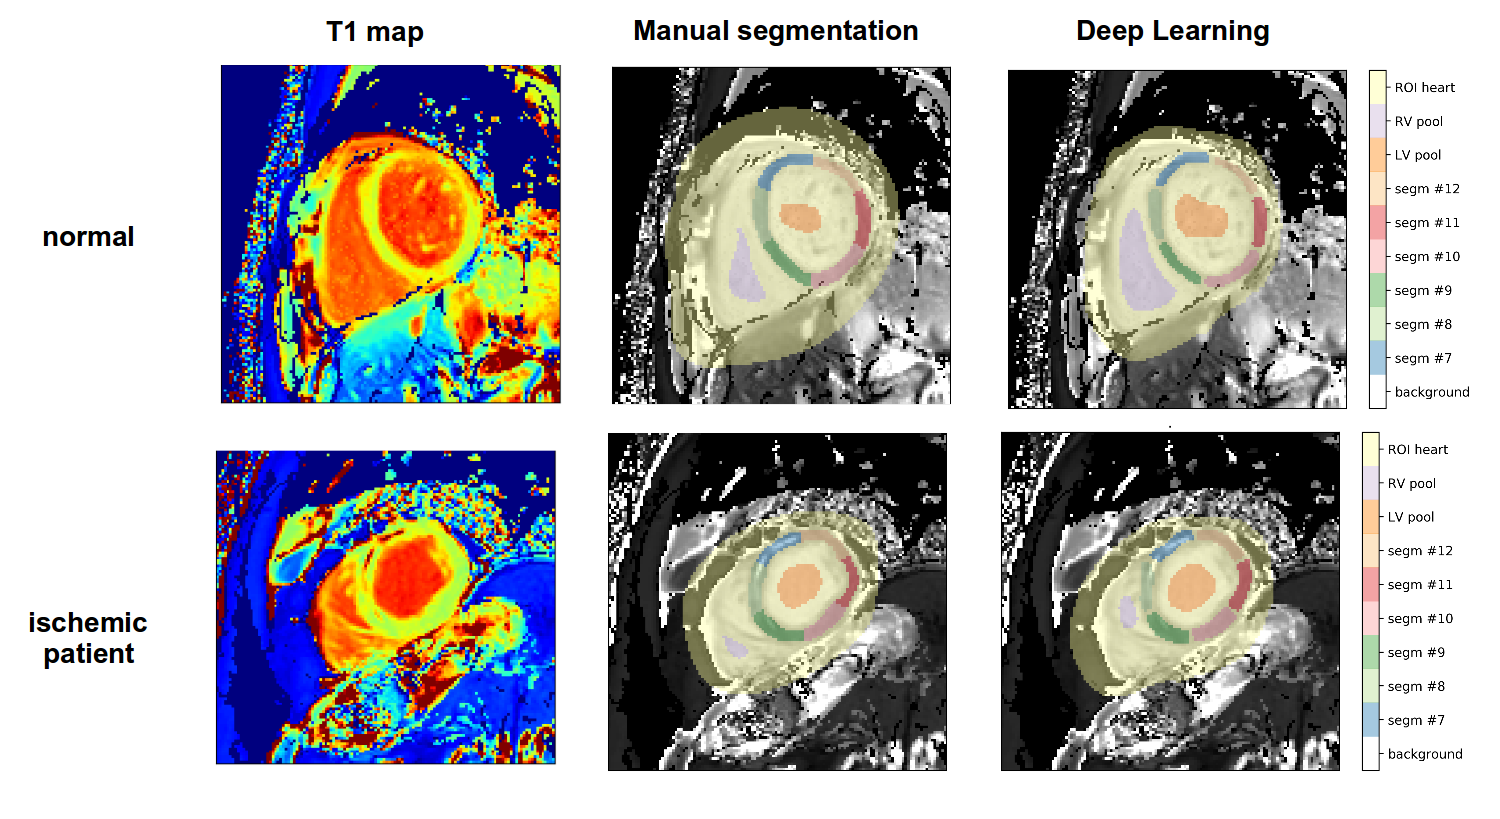
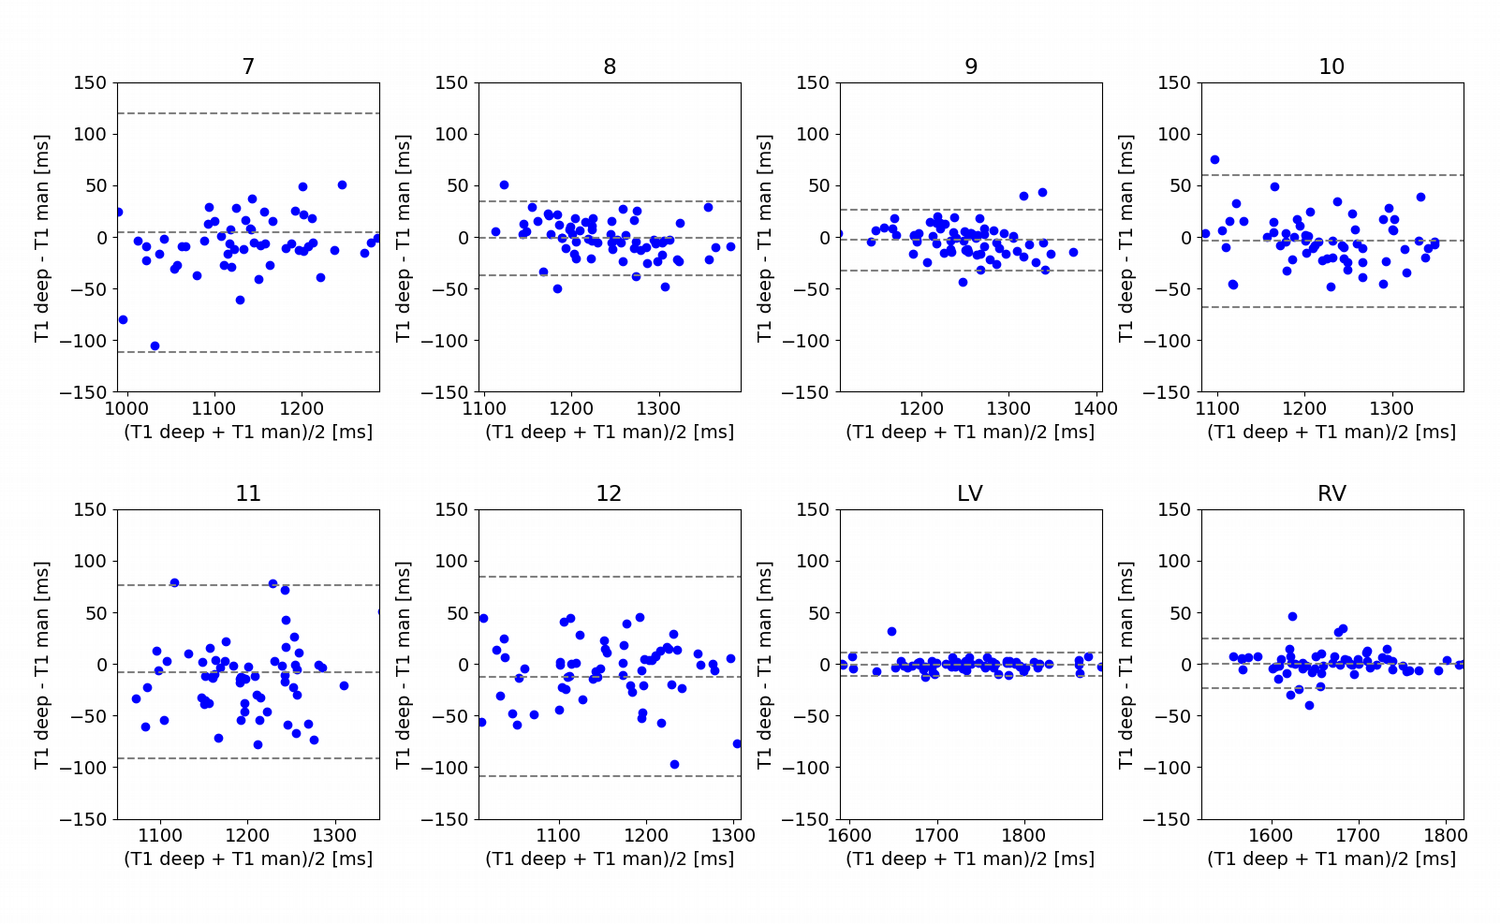
Figure 1 shows the segmentation results obtained in a normal subject and in a patient with ischemic disease. Notably, the deep learning method was able to successfully segment even myocardial regions presenting focal lesions. The high agreement with manual segmentation was confirmed by elevated values of Jaccard (0.969±0.023) and Dice (0.984±0.012) indexes. In addition, the low angular error (3.5±2.8°) highlighted the high confidence in predicting the different heart orientation among subjects. Figure 2 shows the Bland-Altman plots of the mean value of T1 in myocardial segments and blood pools estimated using manual and deep learning segmentation. No significant difference in the obtained segmental T1 values compared to manual measurements was found, with a mismatch percentage ranging from 0.95% (segment #9) to 3.14% (segment #7) across segments. The automatic segmental analysis took less than 1 second per T1 map.Conclusions
In this study we proposed a new method for the automatic segmentation of cardiac T1 maps according to the AHA model using deep learning strategies. Segmentation results showed a close agreement with manually drawn ROIs. No significant difference in the segmental T1 values was found compared to manual measurements. This method can effectively facilitate the regional analysis of cardiac T1 maps in clinical routine.Acknowledgements
No acknowledgement found.References
[1] Moon JC, Messroghli DR, Kellman P et al. Myocardial T1 mapping and extracellular volume quantification: a Society for Cardiovascular Magnetic Resonance (SCMR) and CMR Working Group of the European Society of Cardiology consensus statement.J Cardiovasc Magn Reson. 2013;15(1):92. [2] Cerqueira MD, Weissman NJ, Dilsizian V et al. Standardized myocardial segmentation and nomenclature for tomographic imaging of the heart. Circulation 2002;105:539-42. [3] Messroghli DR, Radjenovic A, Kozerke S et al. Messroghli DR et al. Modified Look-Locker inversion recovery (MOLLI) for high-resolution T1 mapping of the heart. Magn Reson Med 2004;52(1):141-146 [4] Ronneberger O, Fischer P, Brox T. U-Net: Convolutional Networks for Biomedical Image Segmentation arXiv:1505.04597.Figures