1046

Simultaneous Multislice Accelerated Diffusion-Tensor Imaging of Thigh Muscles in Myositis
Fengdan Wang1, Chanyuan Wu2, Caiyuan Sun1,3, Dong Liu1, Yi Sun4, Qian Wang2, and Zhengyu Jin1

1Radiology, Peking Union Medical College Hospital, Beijing, China, 2Rheumatology, Peking Union Medical College Hospital, Beijing, China, 3Radiology, Shenzhen Sun Yat-Sen Cardiovascular Hospital, Shenzhen, China, 4MR Collaboration NE Asia, Siemens Healthcare, Shanghai, China

Synopsis

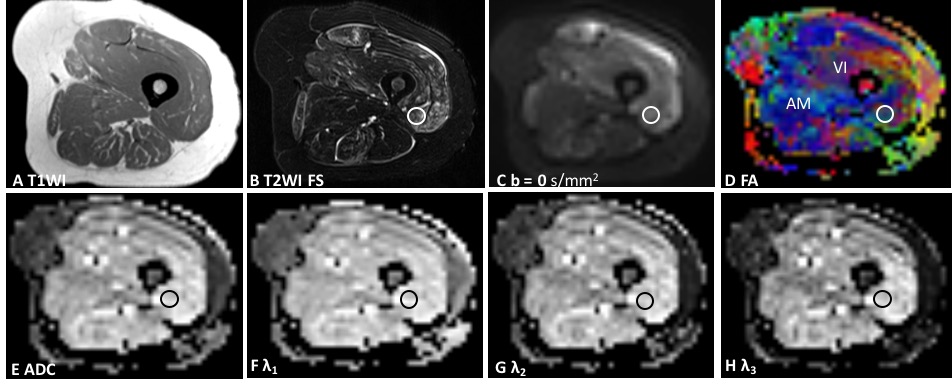
We investigated the clinical feasibility of using simultaneous multislice accelerated echo planar imaging diffusion-tensor imaging (SMS-EPI-DTI) to image thigh muscles of both 10 healthy control subjects and 20 dermatomyositis (DM)/ polymyositis (PM) patients. This technique yielded a reduced scan time to only about five minutes. The results showed that the tractographic imaging and DTI-derived parameters of edematous muscles differed among affected and unaffected muscles of the DM/PM patients and normal muscles of the control subjects. In conclusion, SMS-EPI-DTI is clinically feasible for imaging thigh muscles and quantitatively evaluating edematous muscles of DM and PM patients.

Background and Purpose

Dermatomyositis (DM) and polymyositis (PM) are the two leading types of idiopathic inflammatory myopathy and both of them have a high morbidity and mortality.[1] The use of diffusion-tensor imaging (DTI) in thigh muscles for diagnosis and monitor is technically challenging due to long data acquisition time and motion artifacts. [2] In this study, we investigated the clinical feasibility of using simultaneous multislice accelerated echo planar imaging (SMS-EPI)-DTI to image and analyze the anisotropic diffusion characteristics of the thigh muscles in DM and PM patients.

Materials and Methods

Both thighs of 20 patients (seven DM and thirteen PM patients) (male: female = 2:3, mean age = 50.1 ± 15.3 years, and body mass index [BMI] = 22.46 ± 2.78 kg/m2) and 10 healthy control subjects (male: female = 1:9, mean age = 36.6 ± 13.8 years, and BMI = 22.65 ± 3.20 kg/m2) were prospectively scanned by SMS-EPI-DTI and three conventional MR sequences on a MAGNETOM Skyra 3T MR scanner (Siemens Healthcare, Erlangen, Germany) using an 18-channel body coil. The detailed parameters for SMS-EPI-DTI were as follows: TR = 4500ms, TE = 51ms, slice thickness = 4mm, FOV= 400mm × 400mm, matrix = 100 × 66, bandwidth = 2380Hz, b value = 400 s/mm2, 16 gradient directions, slice acceleration factor = 2, and total scan time is 5min and 13s. All the acquired images were transferred to a MMWP workstation (Siemens Healthcare, Erlangen, Germany). Tractography was performed using Neuro3D software with step length = 2 mm, FA threshold = 0.2, and angle threshold = 10°. The DTI-derived parameters including fractional anisotropy (FA), apparent diffusion coefficient (ADC), and three eigenvalues (λ1, λ2, and λ3) were obtained from four selected muscles (vastus medialis, vastus intermedius, adductor magnus, and semi-membranosus). T2-weighted images were analyzed to determine which thigh muscles were affected, and were also used as reference images to delineate a circular region of interest (ROI) with an area of 60 mm2. Figure 1 illustrated the process of data acquisition. Data from edematous and unaffected muscles of the patients and normal muscles of the healthy control subjects were analyzed.

Results

Figure 2 shows the broken fibers in the edematous muscle of the DM/PM patients on tractographic images. This was extremely difficult to realize on conventional DTI due to its long TE and limited voxel size. Figure 3 and 4 summarize the quantitative evaluation of thigh muscles and the statistical results. For each of the four measured muscles, the FA values in the edematous group were significantly lower than those of unaffected muscles in the patients and the normal muscles in the healthy controls (all P < 0.001). ADC, λ1, λ2, and λ3 values of edematous muscles were significantly higher than those of the unaffected and healthy groups (P = 0.009 for semi-membranosus λ1 for the comparison between the edematous and unaffected groups, and P < 0.001 for all the other comparisons). Unaffected muscles in the patients and those of the healthy controls were similar in terms of all the parameters (P = 0.065–0.936).

Discussion and Conclusion

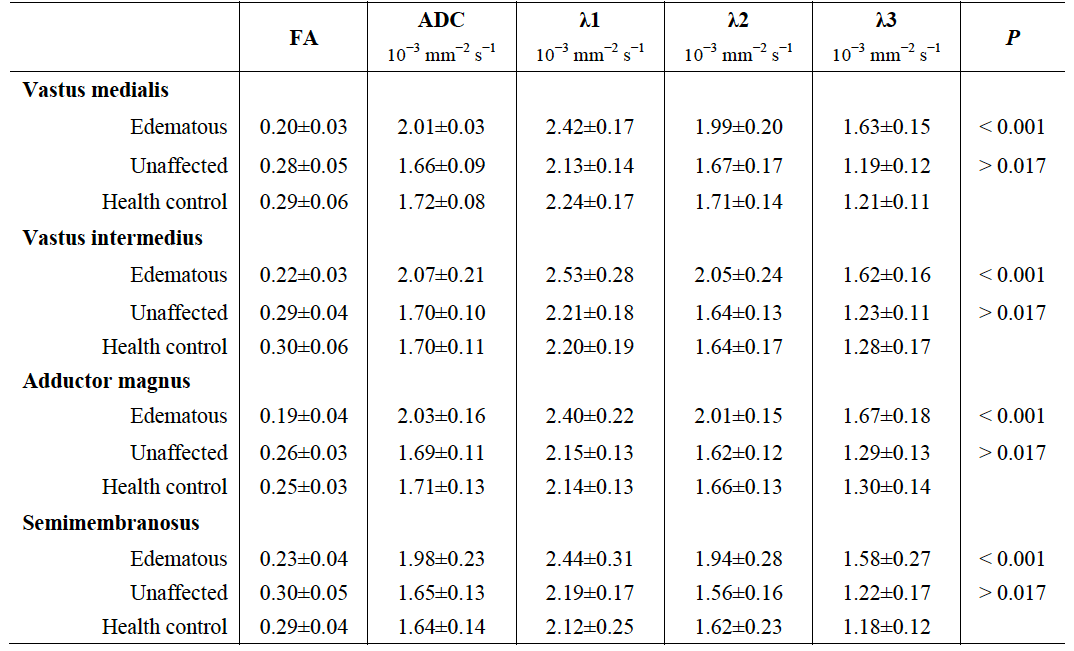
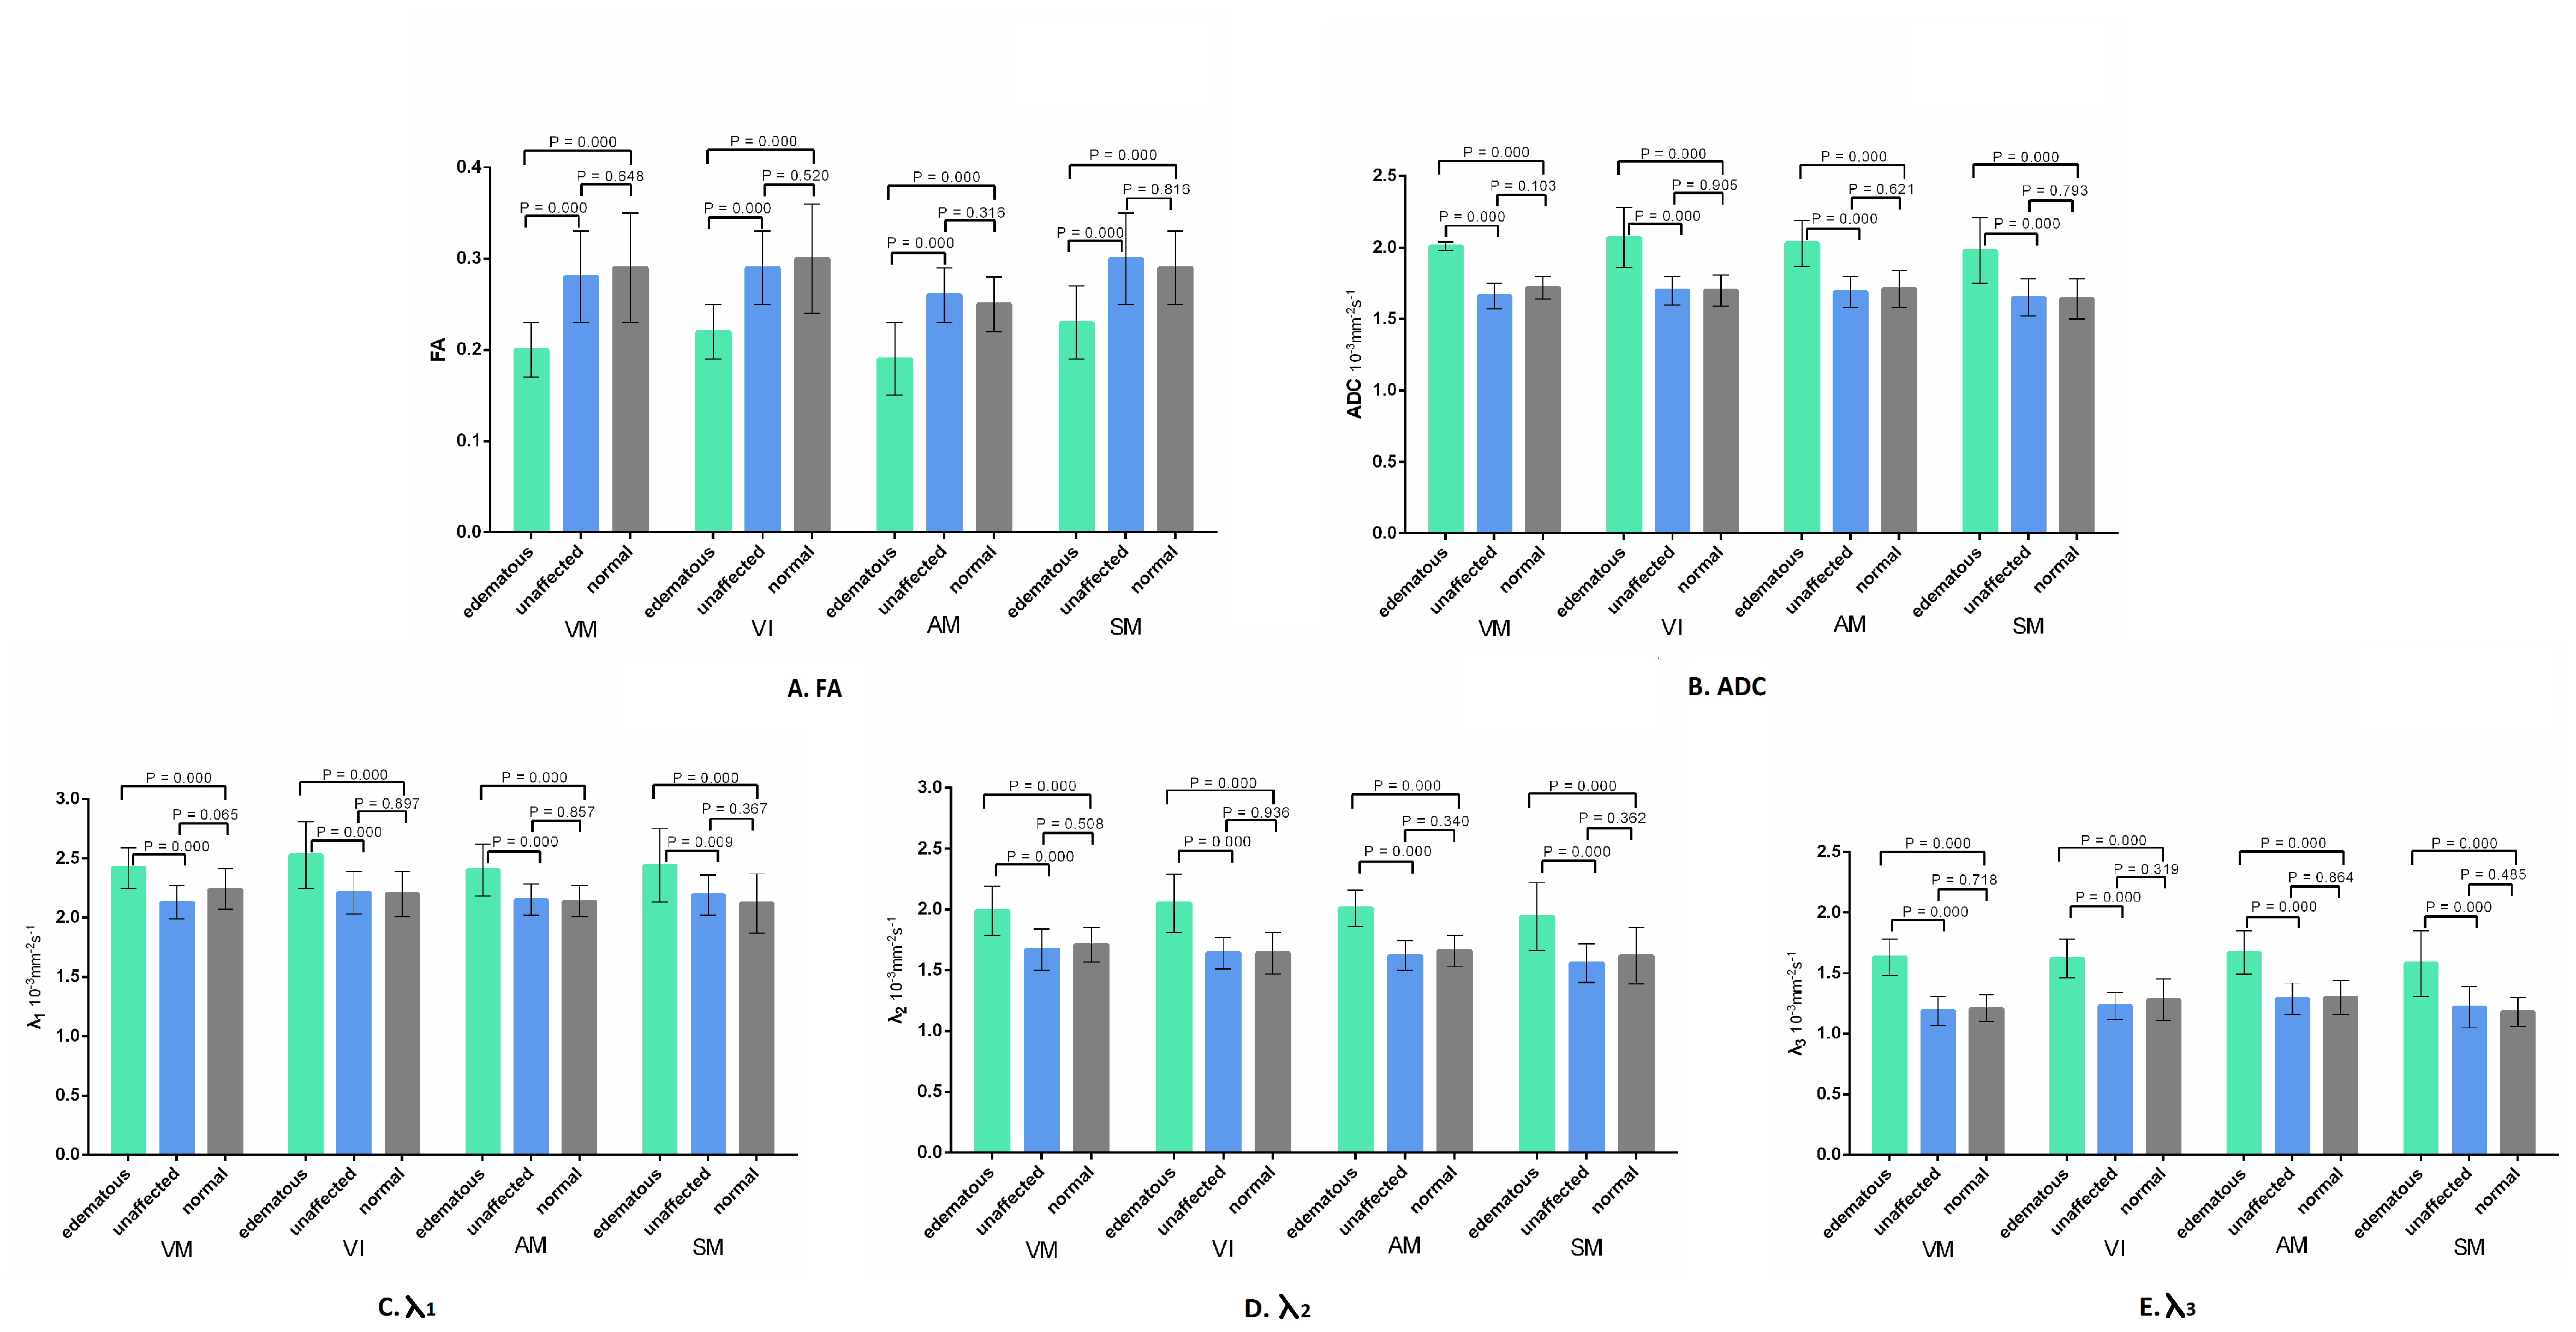
SMS is a recent innovation of the MRI technique that accelerates data acquisition through scanning and reconstruction of multiple slices simultaneously, without decreasing the SNR. [3] In this study, the scanning time of the SMS- EPI-DTI sequence for both upper legs from hip to knee was only five minutes in one examination, which is significantly shorter than other DTI techniques of comparable spatial resolution (20–40 min) [4]. For edematous muscles in the DM/PM patients, the tracking fibers and FA values decreased, whereas the ADC values increased, consistent with the pathophysiological changes of DM/PM [5]. In addition, all three eigenvalues were increased in edematous muscles in the DM/PM patients, with the greatest and lowest elevations observed in λ3 (27%–34%) and λ1 (8%–15%), in accordance with a prior animal study using a murine model [6] and other research in myositis patients [7]. In conclusion, SMS-EPI-DTI is clinically feasible for imaging thigh muscles and quantitatively evaluating the edematous muscles of DM and PM patients.

Acknowledgements

The authors thank TianYi Qian (Siemens Healthcare, Beijing, China) for his technical support, Yan Zhang (Department of Radiology, Peking Union Medical College Hospital, Chinese Academy of Medical Sciences & Peking Union Medical College) for instructions in muscle evaluation, and Bo Hou (Department of Radiology, Peking Union Medical College Hospital, Chinese Academy of Medical Sciences & Peking Union Medical College) for scanning data.

References

1. Findlay AR, Goyal NA, Mozaffar T. An overview of polymyositis and dermatomyositis. Muscle Nerve. 2015; 51(5):638-656.

2. Damon BM, Buck AK, Ding Z. Diffusion-Tensor MRI Based Skeletal Muscle Fiber Tracking. Imaging Med. 2011, 3(6):675-687.

3. Barth M, Breuer F, Koopmans PJ, et al. Simultaneous multislice (SMS) imaging techniques. Magn Reson Med. 2016; 75(1):63-81.

4. Froeling M, Oudeman J, Strijkers GJ, et al. Muscle changes detected with diffusion-tensor imaging after long-distance running. Radiology. 2015; 274(2):548-562.

5. Carstens PO, Schmidt J. Diagnosis, pathogenesis and treatment of myositis: recent advances. Clin Exp Immunol. 2014; 175(3):349-358.

6. Bryant ND, Li K, Does MD, et al. Multi-parametric MRI characterization of inflammation in murine skeletal muscle. NMR Biomed. 2014; 27(6):716-725.

7. Ai T, Yu K, Gao L, et al. Diffusion tensor imaging in evaluation of thigh muscles in patients with polymyositis and dermatomyositis. Br J Radiol. 2014; 87(1043):20140261.

Figures

Fig. 1—50-year-old patient with dermatomyositis who was later diagnosed with ascending colon adenocarcinoma. A-H, Image of left thigh. Axial T1-weighted image (A) and T2-weighted Dixon fat saturation (FS) image (B) revealed edema in multiple thigh muscles. The ROI was placed on the most edematous region of the VI. C, Non-weighted diffusion image (b = 0 s/mm2). D, FA mapping revealed heterogeneously colored VI and mainly blue-colored AM, which was only mildly affected in this patient. E–H, Images of ADC and three eigenvalues (λ1, λ2, and λ3). AM = adductor magnus, VI = vastus intermedius.

Fig. 2—40-year-old patient with polymyositis. A–D, Images of right thigh. Axial T2-weighted image (A) revealed a severely edematous adductor magnus (AM), and the other thigh muscles affected to a lesser degree, e.g. vastus lateralis (VL). It was demonstrated from axial tractographic image (B), coronal tractographic image of the VL (C) and AM (D) that most fibers of the AM could not be tracked (arrows in D) relative to VL, indicating that the normal anisotropic structure of edematous AM fibers was perturbed.

Fig. 3—Fractional Anisotropy (FA), Apparent Diffusion Coefficient (ADC), and Three Eigenvalues (λ1, λ2, and λ3) for DM/PM Patients and Healthy Controls Results are shown as rating ± standard deviation. P, probability of equivalence. For each muscle, FA, ADC, λ1, λ2, and λ3 of edematous muscle of patients were compared to those of unaffected muscles of patients and normal muscles of healthy control subjects; all had P values < 0.001. The five parameters of unaffected muscle were compared to those of control subjects; P values were 0.065–0.936, all of which were > 0.017 after Bonferroni correction to adjust for multiple comparisons.

Fig. 4— Group t-test results of the diffusion tensor parameters for edematous muscles, unaffected muscles of the DM/PM patients, and normal muscles of the control subjects. A-E, Graphs illustrate fractional anisotropy (FA) (A), apparent diffusion coefficient (ADC) (B), λ1 (C), λ2 (D) and λ3 (E).

Proc. Intl. Soc. Mag. Reson. Med. 26 (2018)
1046