1044
Longitudinal Changes in Quantitative MRI and Ultrasound Metrics of Patellar Tendon are Associated with Tendon Degeneration and Leg Dominance within of Collegiate Basketball Players over One Season of Play1Radiology and Imaging, Hospital for Special Surgery, New York, NY, United States, 2Biostatistics, Hospital for Special Surgery, New York, NY, United States
Synopsis
This study assessed correlations between quantitative T2* and Shear wave elastography (SWE) ultrasound metrics of the patellar tendon and qualitative morphologic grades patellar tendinosis (PT) within collegiate basketball players over one season of play. Within the current study, significant and strong correlations existed between T2* and SWE metrics, though morphologic PT grades were correlated with T2* metrics only. These findings support the notion that T2* relaxometry could benefit the clinical management of PT, as it is sensitive to changes in pathologic severity over time, and could therefore serve as a metric to guide treatment plans and evaluate intervention efficacy.
Introduction:
Patellar tendinosis (PT) is common and can result in prolonged disability, especially in jumping athletes (1-3). Quantitative assessment of the patellar tendon may complement morphologic imaging of tendinosis before severe injury, as well as during and after treatment. Recently developed ultra-short-echo (UTE) MRI sequences allow for quantitative evaluation of tendon biostructure with T2* relaxometry (4, 5). Shear wave elastography (SWE) ultrasound is another non-invasive imaging tool that can be used to measure tissue “elasticity”, and has demonstrated qualitative and semi-quantitative correlation with the 2D grayscale US appearance of tendinopathy (6-8). This study assesses correlations between changes over time (COT) in quantitative T2* and SWE metrics of the patellar tendon within collegiate basketball players over one season of play.
We hypothesized that significant within-subject (side-to-side) differences in T2* and SWE metrics would exist between pre-season and post-season examinations, and that COT in T2* metrics would correlate with COT in SWE measurements as well as COT in morphology.
Methods:
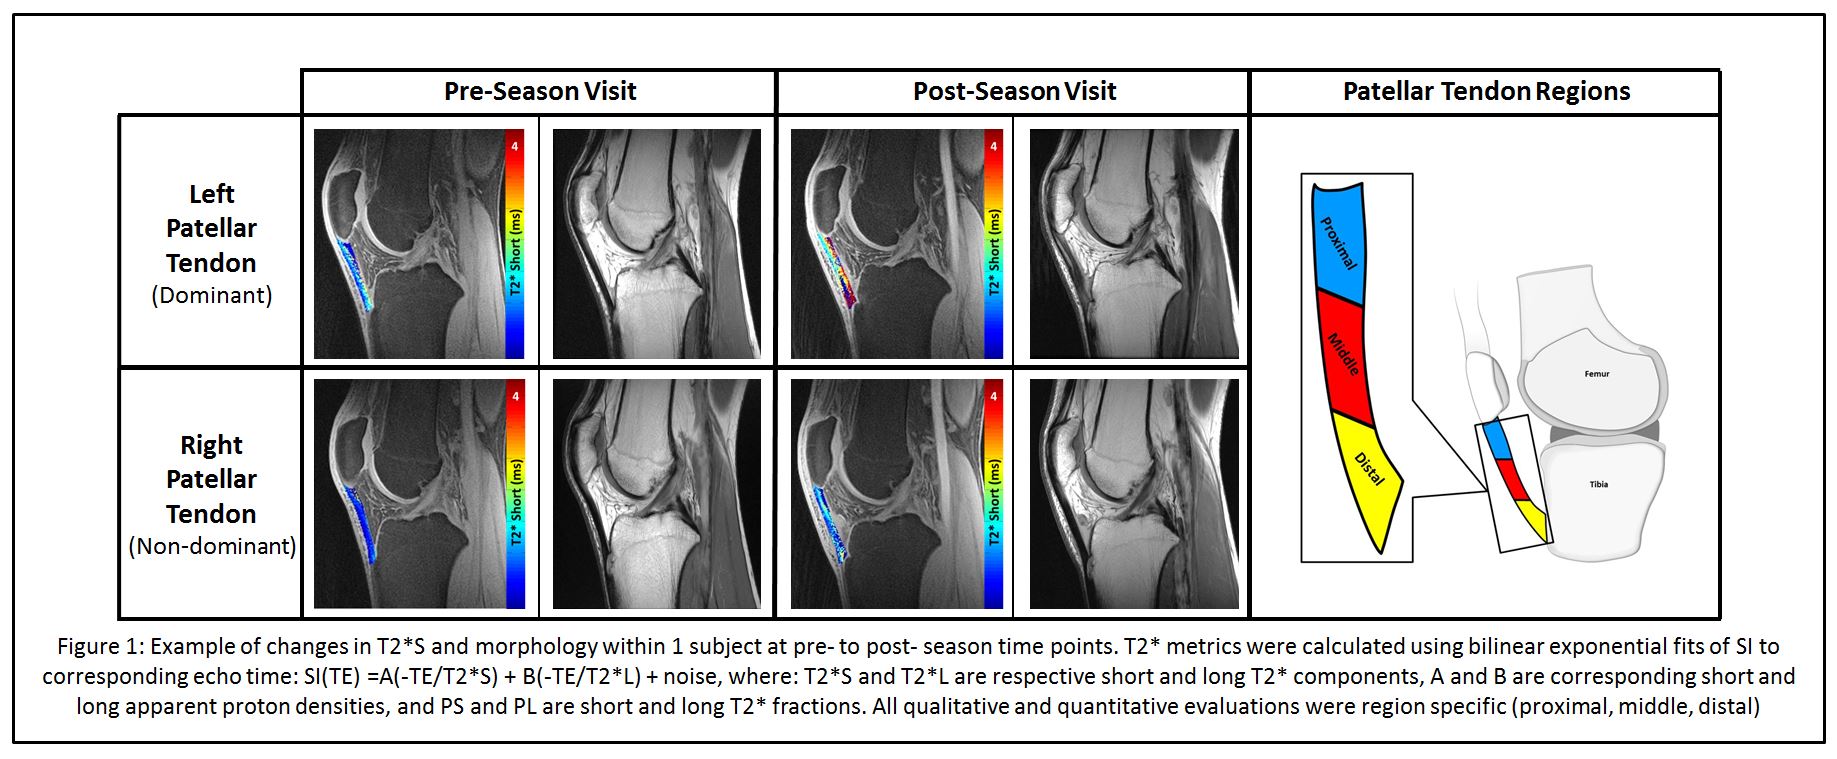
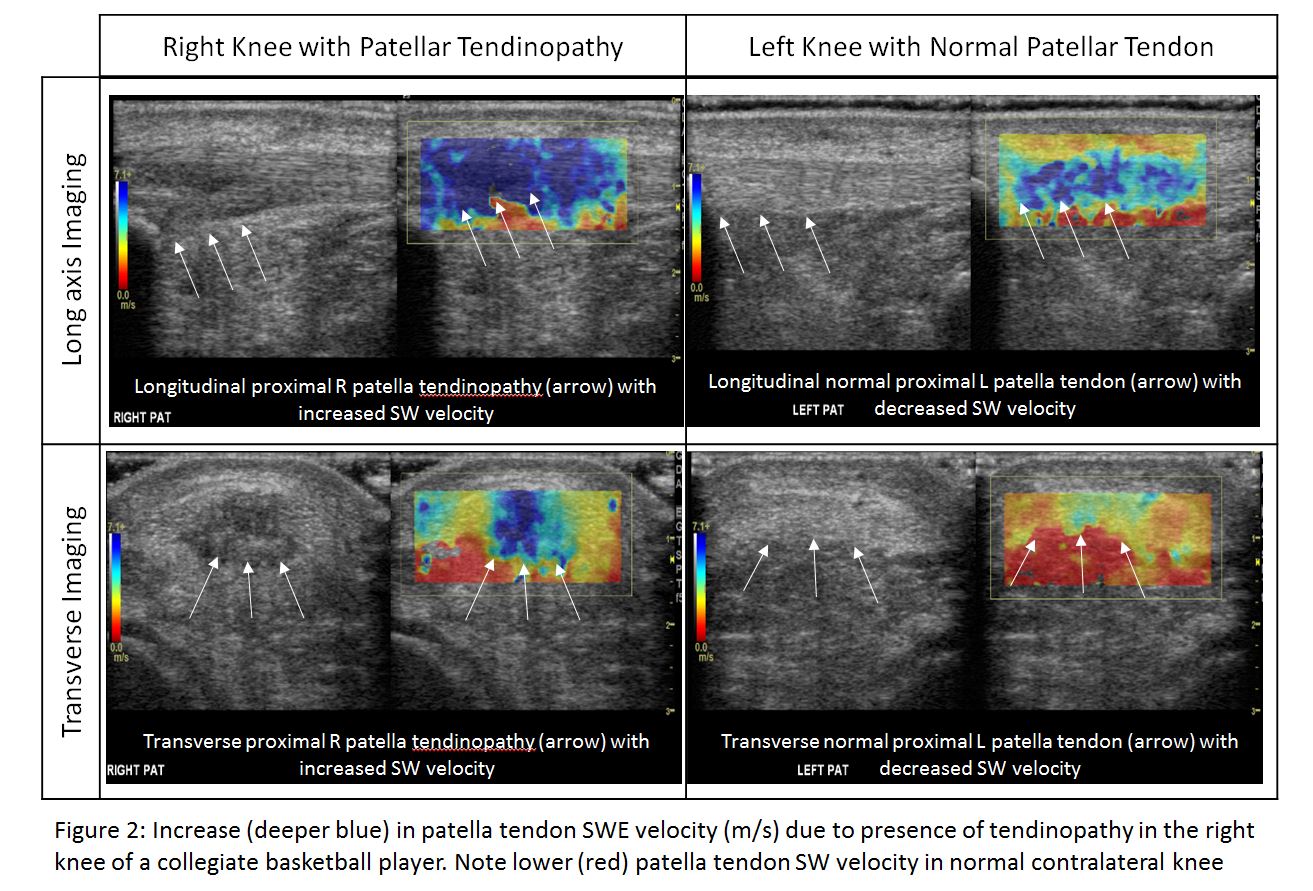
This IRB approved pilot study included 10 male subjects (Age: 19.8 ± 1.0 years) recruited from a single collegiate basketball team. All subjects participated in pre-season and post-season study visits where bilateral clinical 3T-MRI (GE Healthcare) and SWE-US data were obtained. MRI: Qualitative grading of PT was completed using the following sequence: Multi-planar FSE: TE: 25ms, TR: 4000ms, Voxel size: 0.40x0.30x3.5 mm3, NEX=2, RBW = ±62.5 kHz, severity defined as: 0 = none, 1 = mild, 2 = moderate, 3 = sever. Multi-echo 3D-UTE-Cones acquisitions were used to calculate quantitative T2* metrics via bilinear exponential fits of SI to corresponding echo time: TEs: 11 echoes between 0.03-12ms, TR: 62ms, Flip Angle: 12o, Voxel size: 0.60x0.60x3.0 mm3, RBW: ±125 kHz. SWE-US: Subjects were evaluated in the supine position with knees bent to 20 o of flexion. SWE-velocity (m/s) measurements were obtained in the longitudinal (L-SWE) and transverse (T-SWE) orientations (Figure 2) in a region specific manner using a 9 MHz transducer on a LOGIQ E9 ultrasound system (GE Healthcare, Milwaukee, WI). Statistical Analysis: All data were evaluated in a region specific manner (proximal, middle, and distal). Linear mixed effects models with random subject intercepts assessed associations of side and region with T2* metrics (T2*S, T2*L, PS, PL), and SWE-velocity measurements (L-SWE and T-SWE). Spearman correlations evaluated respective relationships between T2* metrics, SWE-velocity measurements, and PT morphology.Results:
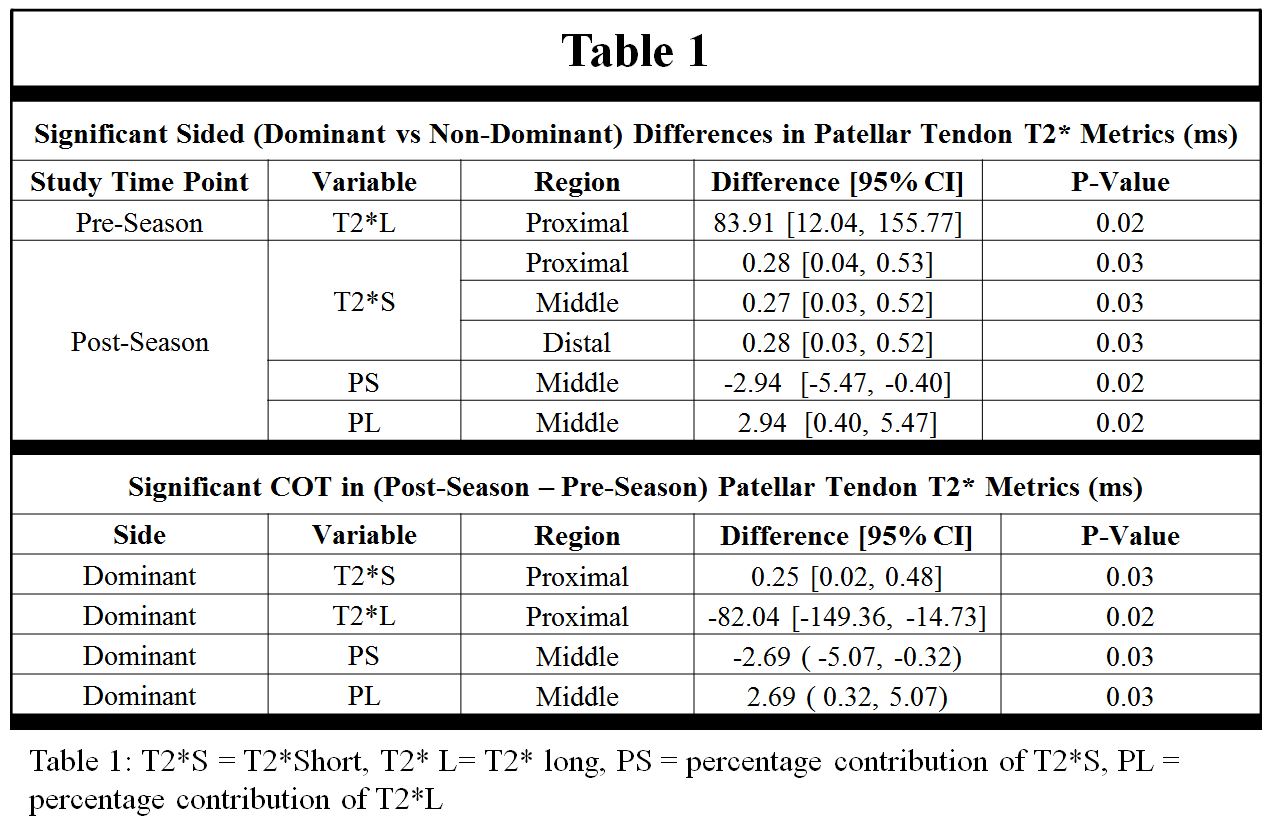
Significant within subject differences in T2* metrics were found between dominant and non-dominant knees, both within and between study timepoints (Table 1).Post-season morphologic PT grades were significantly greater (worse) within the proximal (+0.55, p< 0.01) and distal (+0.40, p< 0.01) patellar tendon regions in comparison to pre-season grades. Notably, dominant knees displayed significantly larger COT in proximal region morphologic PT grades in comparison to non-dominant knees (dominant side: + 0.80; p = 0.01). No significant dominant vs non-dominant side differences in SWE-velocity measurements were found within or between timepoints.
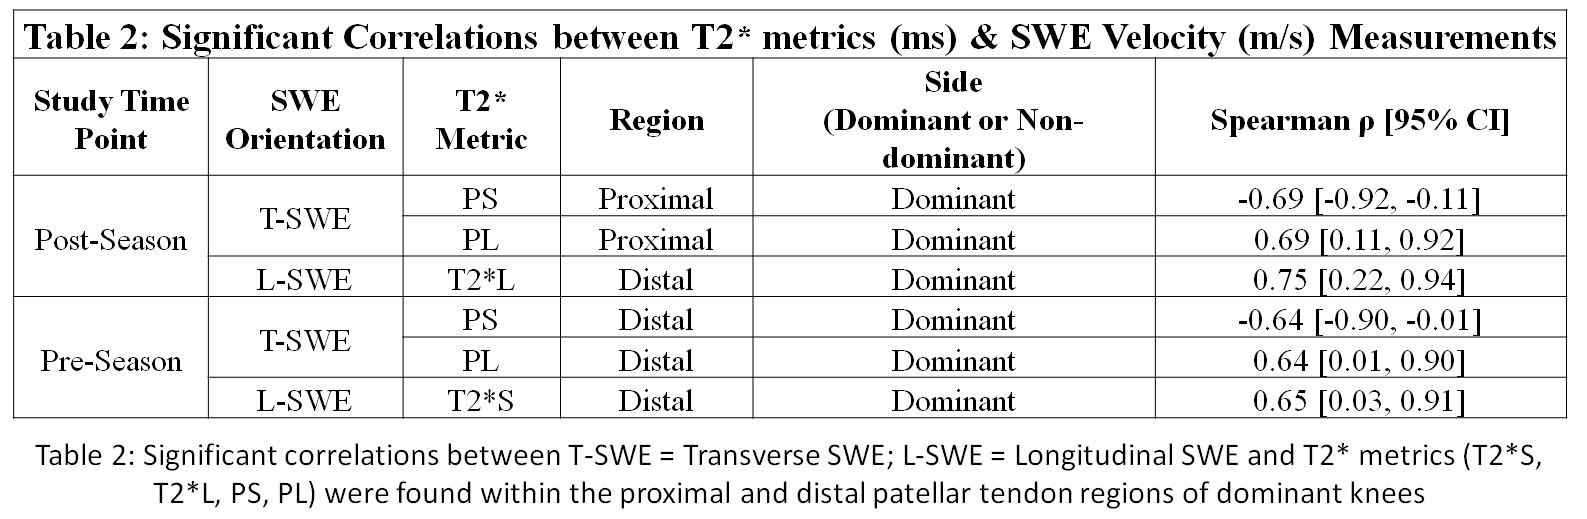
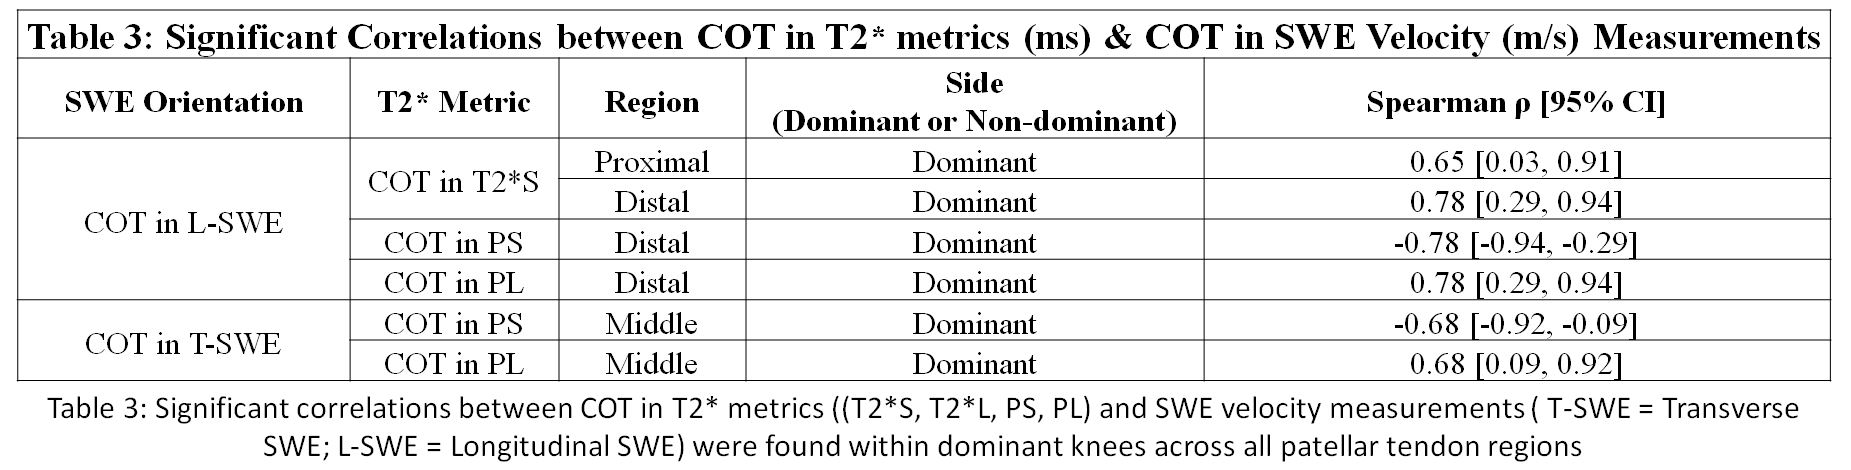
All correlations are presented as: (Spearman’s ρ [95% CI]). Moderate and strong correlations between T2* metrics and SWE-velocity measurements were found within dominant knees for both pre- and post-seasons visits (Table 2). Correlations between COT in T2* metrics and COT in SWE measurements were also found (Table 3). Significant moderate and strong correlations were found between COT in T2* metrics and COT in morphologic PT grade within the proximal (T2*S: ρ = 0.72 [0.13, 0.92]) and middle (PS: ρ = -0.81 [-0.95, -0.33]; PL: ρ = 0.81 [0.33, 0.95]) regions (Figure 1). While no significant correlations were detected between COT in SWE-velocity data and COT in morphologic grades, L-SWE measurements showed a trend towards increased values in the presence of tendinopathy.
Discussion:
Though correlations existed between T2* and SWE metrics, a direct correlation to morphologic grade of PT was found only for T2* metrics. As the severity of morphologic PT grades increased over the time, this finding suggests that T2* metrics were more sensitive to changes in in pathologic tissue deformation in comparison to SWE.
Within and between study visits, leg dominance was found to significantly impact both T2* metrics and corresponding PT grades. As T2* metrics are indicative of tendon biostructure, these data suggest that dominant and non-dominant patellar tendons may experience and adapt to disparate loading conditions over a basketball season.
Conclusion:
These findings support the notion that quantitative T2* relaxometry could benefit the clinical management of PT, as it is sensitive to changes in pathologic severity over time and could therefore serve as a metric to guide treatment plans, evaluate intervention efficacy, and better inform decisions regarding appropriate timing for return to play.Acknowledgements
GE-NBA Co-Initiative for Tendinopathy, HSS has an institutional research agreement with GE Healthcare. Authors would like to thank Roseann Zeldin, Liza Morales, and Valentina Pedoia for their assistance with this studyReferences
- Pappas et al, Canadian Academy of Sport Medicine 2016;26:483-489.
- Kaplan et al, Arthroscopy 2005;21:557-561.
- Major NM, et al, AJR 2002;179:641-644.
- Du et al, Magn Reson Imaging 2009;27:557-564.
- Robson et al, J Comput Assist Tomogr 2003;27:825-846.
- Ooi et al, Ultrasound Med Biol. 2015 Jan;41(1):15-25.
- Chen et al, J Ultrasound Med. 2013;32:449–55.
- Drakonaki et al, Clin Radiol. 2009 Dec;64(12):1196-202.
Figures