1039
Super-Resolution Musculoskeletal MRI using Deep Learning1Radiology, Stanford University, Palo Alto, CA, United States, 2Bioengineering, Stanford University, Palo Alto, CA, United States, 3LVIS Corporation, Palo Alto, CA, United States, 4Orthopaedic Surgery, Stanford University, Palo Alto, CA, United States, 5Neurology & Neurological Sciences, Stanford University, Palo Alto, CA, United States, 6Electrical Engineering, Stanford University, Palo Alto, CA, United States, 7Neurosurgery, Stanford University, Palo Alto, CA, United States
Synopsis
Near-isotropic high-resolution magnetic resonance imaging (MRI) of the knee is beneficial for reducing partial volume effects and allowing multi-planar image analysis. However, previous methods exploring isotropic resolutions, typically compromised in-plane resolution for thin slices, due to intrinsic signal-to-noise ratio (SNR) limitations. Even computer-vision-based super-resolution methods have been rarely been used in medical imaging due to limited resolution improvements. In this study, we utilize deep-learning-based 3D super-resolution for rapidly generating high-resolution thin-slice knee MRI from slices originally 2-8 times thicker. Through quantitative image quality metrics and a reader study, we demonstrate superior performance to both conventionally utilized and state-of-the-art super-resolution methods.
Introduction
Near-isotropic high-resolution magnetic resonance imaging (MRI) of the knee is beneficial in clinical and research scenarios for reducing partial volume effects and allowing interrogation of tissues in arbitrary oblique planes. However, previous methods exploring isotropic resolutions, typically compromised in-plane resolution for thin slices, due to intrinsic signal-to-noise ratio (SNR) limitations. While MRI vendors utilize Fourier interpolation (FI) and DICOM viewers utilize trilinear interpolation (TLI) to generate thin-slice images, neither methods have high diagnostic-quality. Conversely, computer-vision-based super-resolution methods may maintain high in-plane resolution and retrospectively sharpen lower-resolution MR images through-plane. However, even state-of-the-art single-image super-resolution methods such as sparse-coding super-resolution (ScSR) are not pervasive in medical imaging due to limited resolution improvements, lack of generalizability to 3D data, and slow execution speeds1–3. In this study, we explore the feasibility of deep-learning-based 3D super-resolution for rapidly generating high-resolution thin-slice knee MRI from slices originally 2-8 times thicker. We assess image quality through image similarity metrics and a reader study.Theory
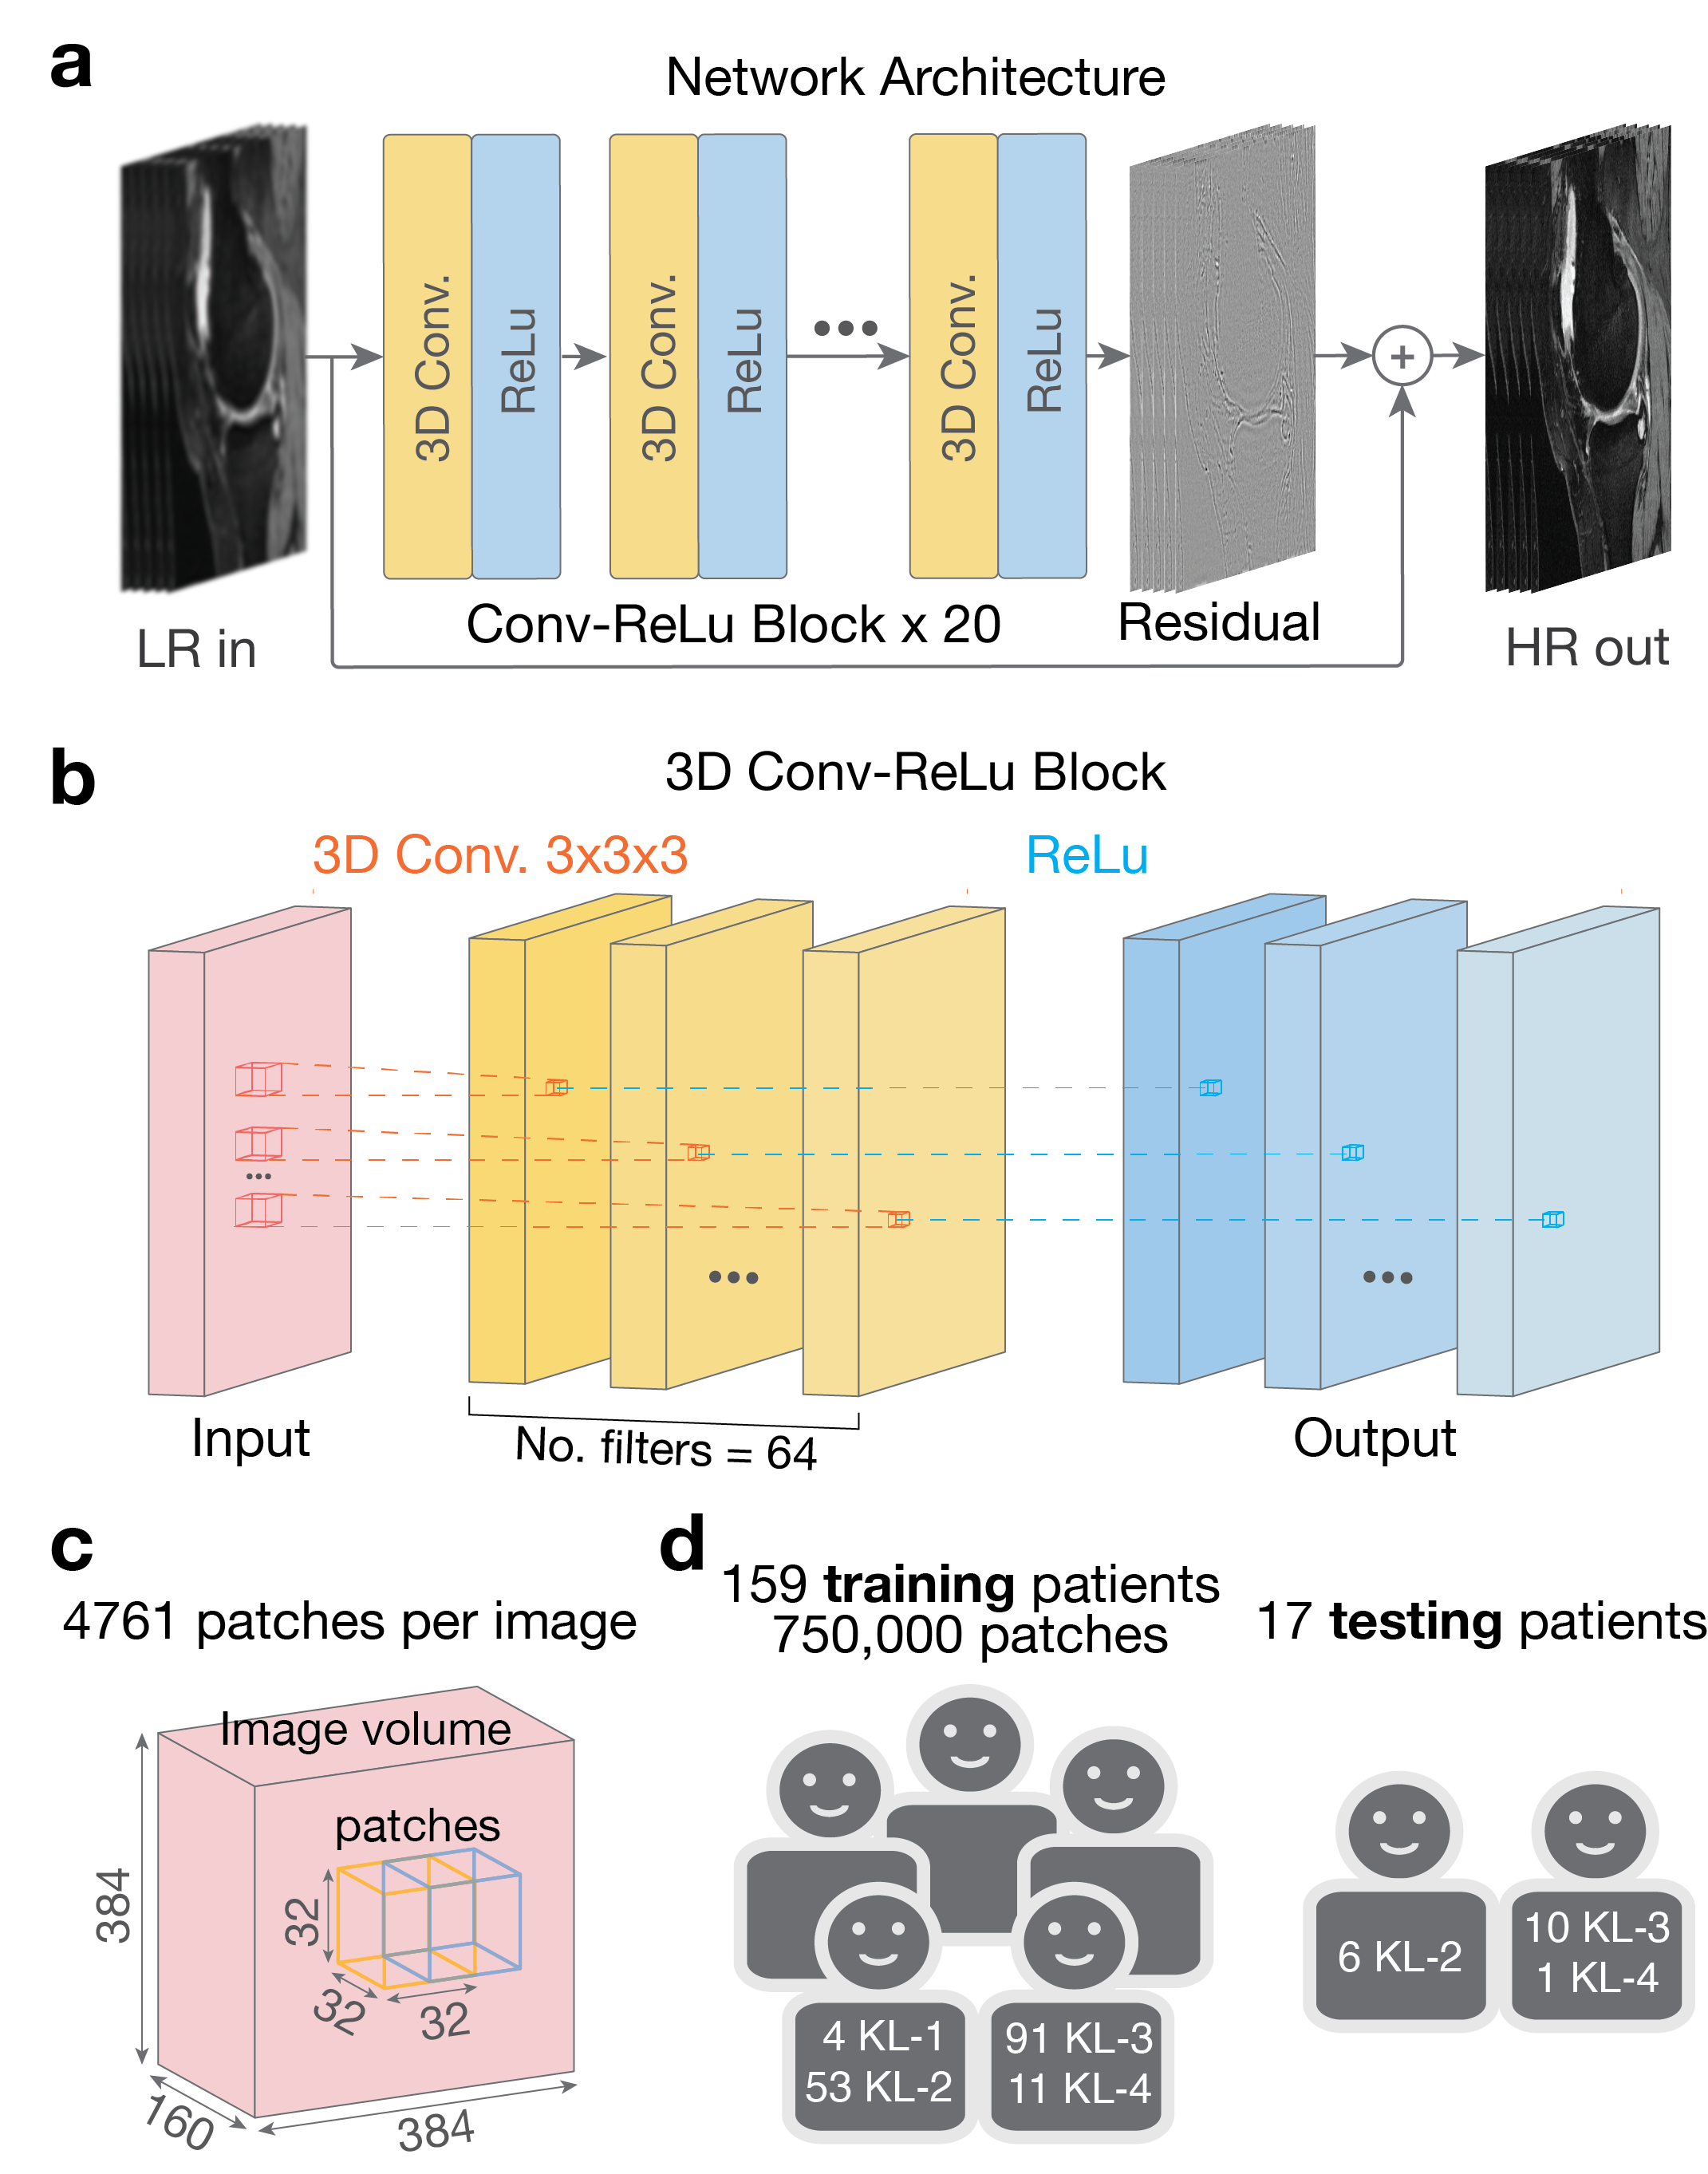
We propose a convolution neural network entitled MRI Deep Super-Resolution (MDSR) capable of transforming low-resolution images $$$(x)$$$ into high-resolution images $$$(y)$$$, inspired by previous work4. Functionally, MDSR learns and predicts thin-slice images when provided with thicker-slice images interpolated to the desired slice thickness. Given a paired training data set consisting of $$$\{x^{(i)},y^{(i)}\}_{i=1}^N$$$ and residuals $$$r=x-y$$$, MDSR learns a function estimating residuals, $$$\hat{r}=f(x)$$$. This function is modeled as a cascade of convolutional filters that minimize the mean-squared-error $$$min(\frac{1}{N}\sum_{i=1}^{N}||y^{(i)}-(x^{(i)}+f(x^{(i)}))||^2)$$$. After training, a high-resolution image can be calculated through $$$\hat{y}=x+f(x)$$$.Methods
MDSR was trained on 159 3D sagittal double-echo in steady-state (DESS) knee datasets obtained through the Osteoarthritis Initiative (relevant parameters: Matrix=384x307 (zero-filled to 384x384), 160 slices, slice-thickness=0.7mm)5, then tested on 17 additional datasets. The ratio of the ground-truth slice thickness and the input low-resolution slice thickness was termed as the downsampling factor (DSF). Separate networks were trained for DSFs of 2x,3x,4x,6x, and 8x (network and training/testing data description in Fig.1). The training data consisted of the ground-truth high-resolution images and simulated low-resolution images generated by sequential anti-aliasing low-pass filtering (to avoid aliasing), downsampling to the DSF, and TLI upscaling at the ground-truth slice locations. Fourier interpolated (FI) and state-of-the-art MRI single-image sparse-coding super-resolution (ScSR) images were also generated for comparison6.
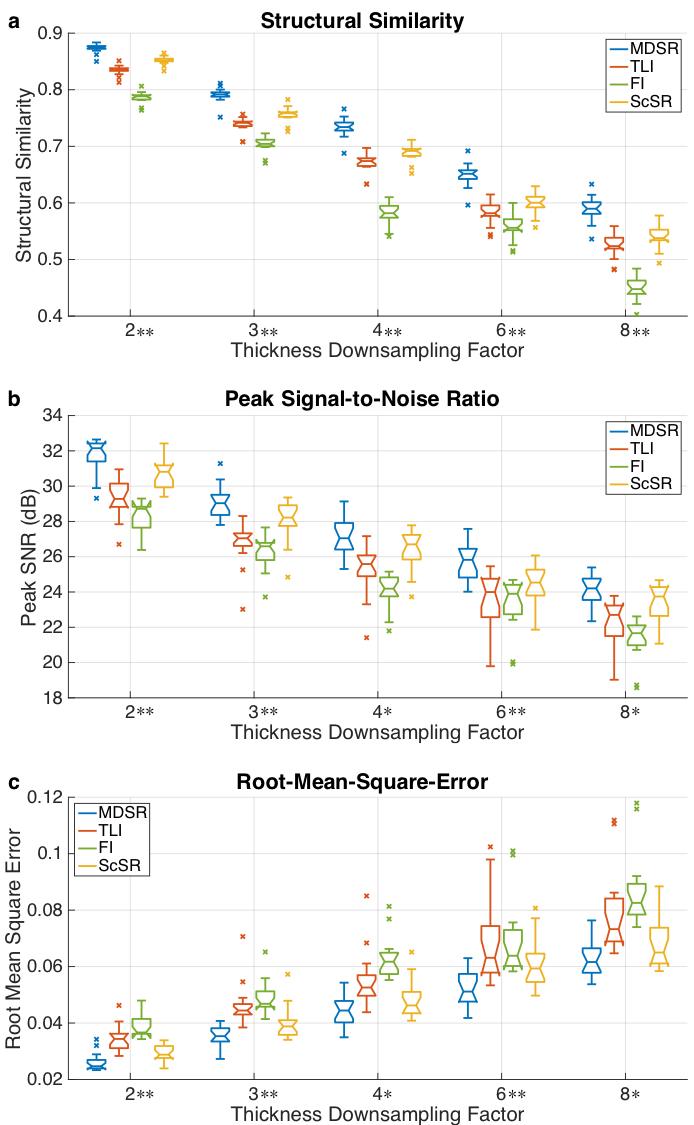
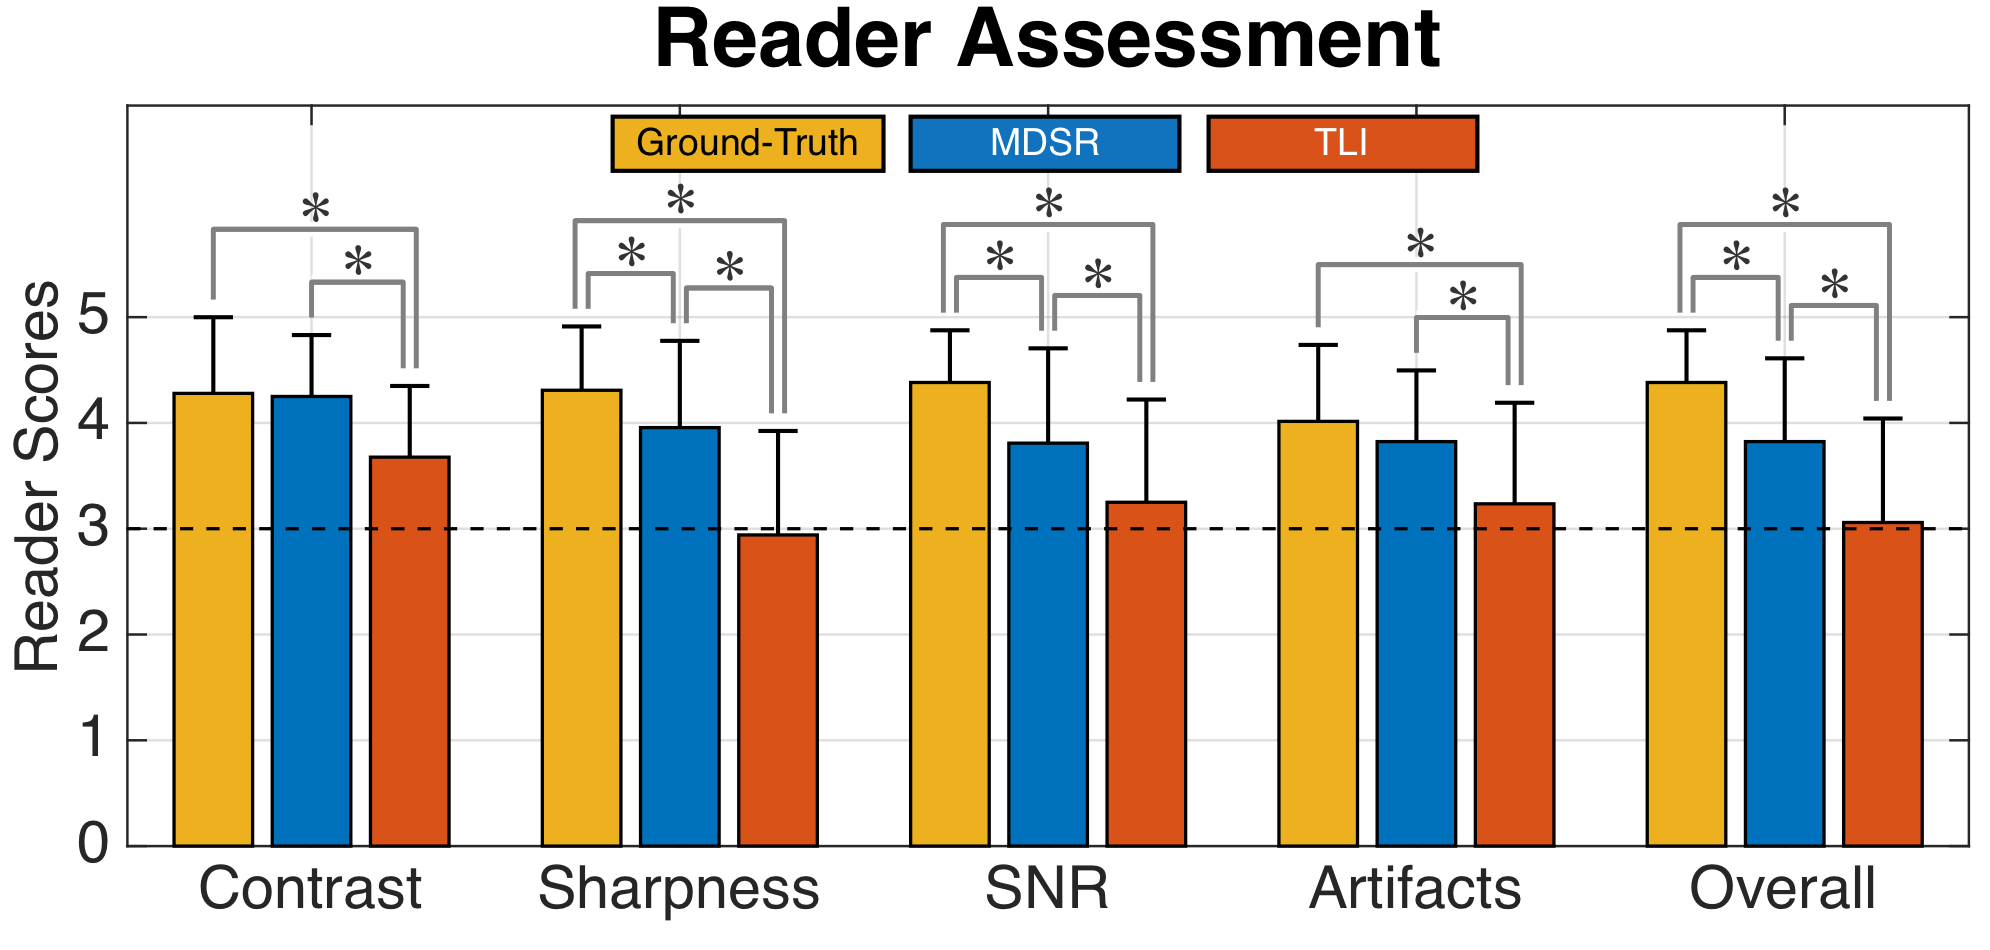
Image quality between the ground-truth images and the MDSR, TLI, FI, and ScSR images was compared using computer-vision metrics of root-mean-square-error (RMSE), peak SNR (pSNR), and structural similarity (SSIM) for all DSF for the 17 testing datasets7. Two musculoskeletal radiologists (with 17 and 2 years of experience respectively) assessed the image sharpness, contrast, artifact-level, SNR, and overall quality for randomly-presented ground-truth, MDSR, and TLI images on a five-point scale (1=non-diagnostic, 2=limited, 3=diagnostic, 4=good, 5=excellent).
Notched-box plots and Mann-Whitney U-tests (α=0.05) compared and tested RMSE, pSNR, and SSIM variations between the MDSR and the TLI, FI, and ScSR images. One-sided Mann-Whitney U-tests (α=0.05) evaluated pairwise reader-score variations between the ground-truth, MDSR, and TLI images. Cohen’s kappa (κ) evaluated inter-reader reliability8.
Results
Sample ground-truth images and super-resolution images with 3x DSF (Fig.2) show that MDSR images were visually the most comparable to the ground-truth. For the varying DSFs, all sagittal images appeared mostly similar, however, the axial and coronal MDSR reformations had the highest image fidelity (Fig.3). MDSR significantly (p<0.001) outperformed TLI, FI, and ScSR for all DSFs for RMSE, pSNR, and SSIM improvements (except for ScSR with DSFs of 4 and 8).
In the reader study, MDSR was significantly better (p<0.01) than TLI in all image quality categories, while MDSR was not significantly different to the ground-truth for contrast and artifact-level. Unlike, TLI, all MDSR image metrics were of ‘diagnostic quality’ or higher. Both readers had substantial scoring agreement (κ=0.73).
DIscussion
MDSR expectedly achieved the best resolution gains for axial and coronal reformations, since it was trained to resolve slice-direction (left-right) high-resolution features. Increasing DSFs led to increased image blurring, demonstrating that DSFs higher than 4x may not be ideal for diagnostic use. Using a large training dataset with over 60% of patients with moderate or higher osteoarthritis was beneficial for training MDSR on healthy and pathologic tissue features9. MDSR may be pragmatic for clinical use since it outperforms commonly performed FI on MRI scanners (‘ZIP2’-GE Healthcare, ‘Interpolate’-Siemens) and TLI performed in DICOM viewers (such as OsiriX). Unlike ScSR, MDSR generates output datasets in 10 seconds. Future studies will be required for evaluating MDSR for diagnosing knee derangements.Conclusion
We have presented MDSR - a deep-learning-based 3D super-resolution technique capable of resolving high-resolution thin-slice images from lower-resolution thicker slices, achieving superior performance to both conventionally utilized and state-of-the-art methods.Acknowledgements
Research support provided by NIH AR0063643, NIH EB002524, NIH AR062068, NIH EB017739, NIH EB015891, and GE Healthcare.References
1. Park SC, Park MK, Kang MG. Super-resolution image reconstruction: A technical overview. IEEE Signal Process Mag. 2003;20(3):21-36. doi:10.1109/MSP.2003.1203207.
2. Plenge E, Poot DHJ, Bernsen M, et al. Super-resolution methods in MRI: Can they improve the trade-off between resolution, signal-to-noise ratio, and acquisition time? Magn Reson Med. 2012;68(6):1983-1993. doi:10.1002/mrm.24187.
3. Wang YH, Qiao J, Li JB, Fu P, Chu SC, Roddick JF. Sparse representation-based MRI super-resolution reconstruction. Meas J Int Meas Confed. 2014;47(1):946-953. doi:10.1016/j.measurement.2013.10.026.
4. Kim J, Lee JK, Lee KM. Accurate Image Super-Resolution Using Very Deep Convolutional Networks. Cvpr 2016. 2016:1646-1654. doi:10.1109/TPAMI.2015.2439281.
5. Peterfy CG, Schneider E, Nevitt M. The osteoarthritis initiative: report on the design rationale for the magnetic resonance imaging protocol for the knee. Osteoarthr Cartil. 2008;16(12):1433-1441. doi:10.1016/j.joca.2008.06.016.
6. Yang J, Wright J, Huang TS, Ma Y. Image super-resolution via sparse representation. IEEE Trans Image Process. 2010;19(11):2861-2873. doi:10.1109/TIP.2010.2050625.
7. Z. Wang, A. C. Bovik, H. R. Sheikh and E. P. Simoncelli. Wavelets for Image Image quality assessment: From error visibility to structural similarity. IEEE Trans Image Process. 2004;13(4):600-612. doi:10.1109/TIP.2003.819861.
8. Landis JR, Koch GG. The measurement of observer agreement for categorical data. Biometrics. 1977;33(1):159-174. doi:10.2307/2529310.
9. Kellgren JH, Lawrence JS. Osteo-arthrosis and disk degeneration in an urban population. Ann Rheum Dis. 1958;17(4):388-397. doi:10.1136/ard.17.4.388.
Figures