1037
Fully Automated Deep Learning Pipeline for Meniscus Segmentation and Lesion DetectionBerk Norman1, Valentina Pedoia1, Thomas Link1, and Sharmila Majumdar1
1Radiology and Biomedical Imaging, University of California San Francisco, San Francisco, CA, United States
Synopsis
Damage to the meniscus is a physically limiting injury that can lead to further medical complications. Automatically classifying this type of meniscal damage poses the advantage for quicker and more accurate diagnosis at the time of an MRI scan. Using a fully automated deep learning pipeline we identify the region around the 4 meniscal horns and then classify if a lesion exists and if so, its severity based on WORMS grading. Lesion detection achieved 89.81% specificity and 81.98% sensitivity. This algorithm has the ability to quickly identify meniscal lesions from MRI and filter higher risk lesion subjects.
Introduction
Knee meniscal tears and degeneration are physically limiting injuries and have been proposed as an initiatory event for osteoarthritis, a degenerative disease affecting millions a year with a significant reduction in quality of life1,2. Moreover, meniscal injury assessed by MRI-based grading has been associated with greater odds of longitudinal cartilage loss 1. Semi-quantitative scoring systems, such as the Whole-Organ Magnetic Resonance Imaging Score (WORMS) have been developed in an attempt to standardize the MRI evaluation, by indicating the presence of a lesion and its severity on a scale from 0 to 43. Despite grading systems being widely used in a research setting, the clinical application is hampered by the time and the level of expertise needed to reliably perform the reading making the automation of this task appealing for a smoother and faster clinical translation. The goal of this study is therefore to implement automatic meniscal grading by capitalizing on recent developments in Artificial Intelligence applied to medical imaging4. Specifically, in this study we aim to use deep learning models to (i) identify the region around the meniscus and then using that region (ii) to predict if a lesion is present and if so, its severity.Methods
1,478 knee MRI subjects with and without osteoarthritis and after ACL injury were collected from three previous studies (age = 42.79±14.75 year, BMI = 24.28 ± 3.22 Kg/m2, 48/52 male/female split) conducted on a GE 3T scanner. All studies used a high resolution 3D fast spin-echo (FSE) CUBE sequence TR/TE = 1500/26.69 ms, field of view = 14 cm, matrix = 384 x 384, slice thickness = 0.5 mm, bandwidth = 50.0 kHz). A deconvolutional neural network architecture was used to learn the bounding boxes around the 4 meniscal horns that were manually annotated for training data5. This resulted in a total of 5,912 “meniscal volumes of interest” (mVOIs). These mVOIs were randomly divided with a 65/20/15% split into training, validation, and testing data. Due to a large imbalance in the WORMS score classes (see Figure 1 for breakdown and description), the classification problem was divided into two parts: first, identifying the presence of a lesion (scores 2-4) vs. no lesion (scores 0-1) and then, using those tuned network parameters, predicting no lesion (scores 0-1), small lesion (scores 2-3), and large lesion (score 4), per recommendation of the clinical radiologist. Using 3D convolutional neural networks (CNNs), these respective WORMS groupings were learned from the mVOIs.Results
99% of the 4 predicted meniscal horn bounding boxes match at least 80% of the true bounding box with actual meniscal volume overestimated by about 12%. This overestimation was intentional to insure the bounding boxes were encapsulating all relevant information to predict WORMS grading. For the binary lesion vs. no lesion classifier, specificity of 89.81% and sensitivity of 81.98% were achieved. The corresponding ROC curve can be viewed in Figure 2. For the three class WORMS model, the classification accuracies for the 3 different grades were 99.38%, 74.39%, and 87.50%, respectively. The count confusion matrix can be viewed in Figure 3. There was no statistically significant difference between results of the 4 meniscal horns.Discussion
A handful of the misclassified cases from the binary model were reviewed by a clinical radiologist to better understand why and if the model was incorrect. For the majority of these cases, the radiologist agreed that there were features that could make the argument for switching the true grading to the predicted one (Figure 4A). For the other misclassified cases, the meniscus was usually severely deformed, which may sometimes cause the grading radiologist to make a scoring that does not follow the traditional grading rules (Figure 4B). While the "small lesion" group of the three class WORMS model still requires some parameter tuning, it is promising that the model can differentiate with high accuracy the difference between no lesion and a large lesion.Conclusion
In this study we provide a proof of concept that a fully automated deep learning pipeline can identify, with high accuracy, the presence of a meniscal lesion. This algorithm has the ability to quickly filter MRIs identifying higher risk cases for the radiologist to further examine. This pipeline also has potential future ability to make more in depth examinations of lesion subjects.Acknowledgements
Funding from GE Healthcare IT Business, NIH AR P50AR060752, NIH AR R01046905, NIH K99AR070902References
- Russell C PV, Souza RB, Majumdar S. Cross-sectional and longitudinal study of the impact of posterior meniscus horn lesions on adjacent cartilage composition, patient-reported outcomes and gait biomechanics in subjects without radiographic osteoarthritis. Osteoarthritis and Cartilage. 2017;25(5):708-17.
- Lawrence RC, Felson DT, Helmick CG, et al. Estimates of the prevalence of arthritis and other rheumatic conditions in the United States. Part II. Arthritis Rheum. 2008;58(1):26-35.
- Peterfy CG, Guermazi A, Zaim S, et al. Whole-Organ Magnetic Resonance Imaging Score (WORMS) of the knee in osteoarthritis. Osteoarthritis Cartilage. 2004;12(3):177-90.
- LeCun Y, Bengio Y, Hinton G. Deep learning. Nature 2015;521:436-44
- Norman B, Pedoia V, Majumdar S. Deep Learning Convoutional Neural Networks for Knee Multi-Tissue Automatic Morphometry and Relaxemtry. 2nd SIIM Conference on Machine Intelligence in Medical Imaging
Figures
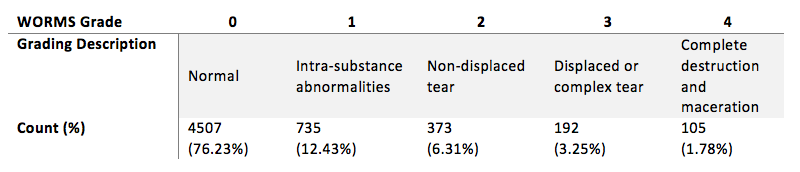
Figure 1: WORMS Description and
Breakdown: clinical description of each of the worms grading accompanied by
the availability of each grade in our dataset
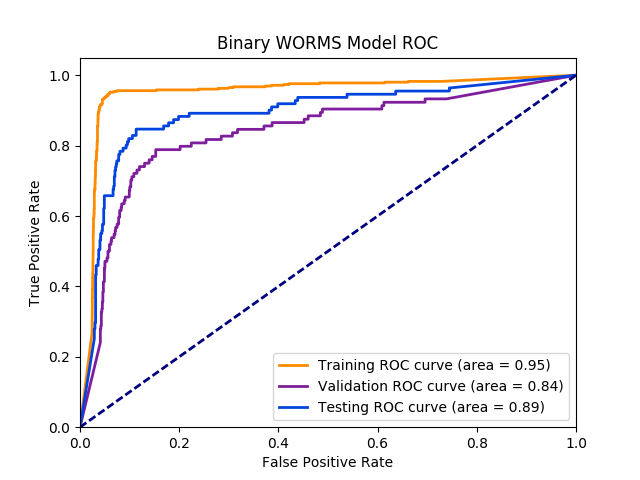
Figure 2: ROC
Curve for Binary WORMS Model:
area under the curve is 95% for training, 84% for validation, 89% for testing of classifying the presence of lesions.
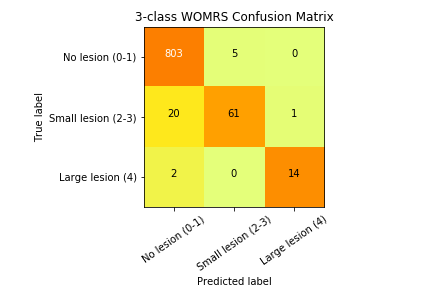
Figure 3: Confusion
Matrix for 3 Class WORMS Model: true labels are the rows while the
predicted labels are the columns. The diagonal represent the number of correct
predictions for that class. The total number of subjects in each group can be
obtained by summing that respective row. Darker squares represent a higher
percentage of that group classified for a predicted label.
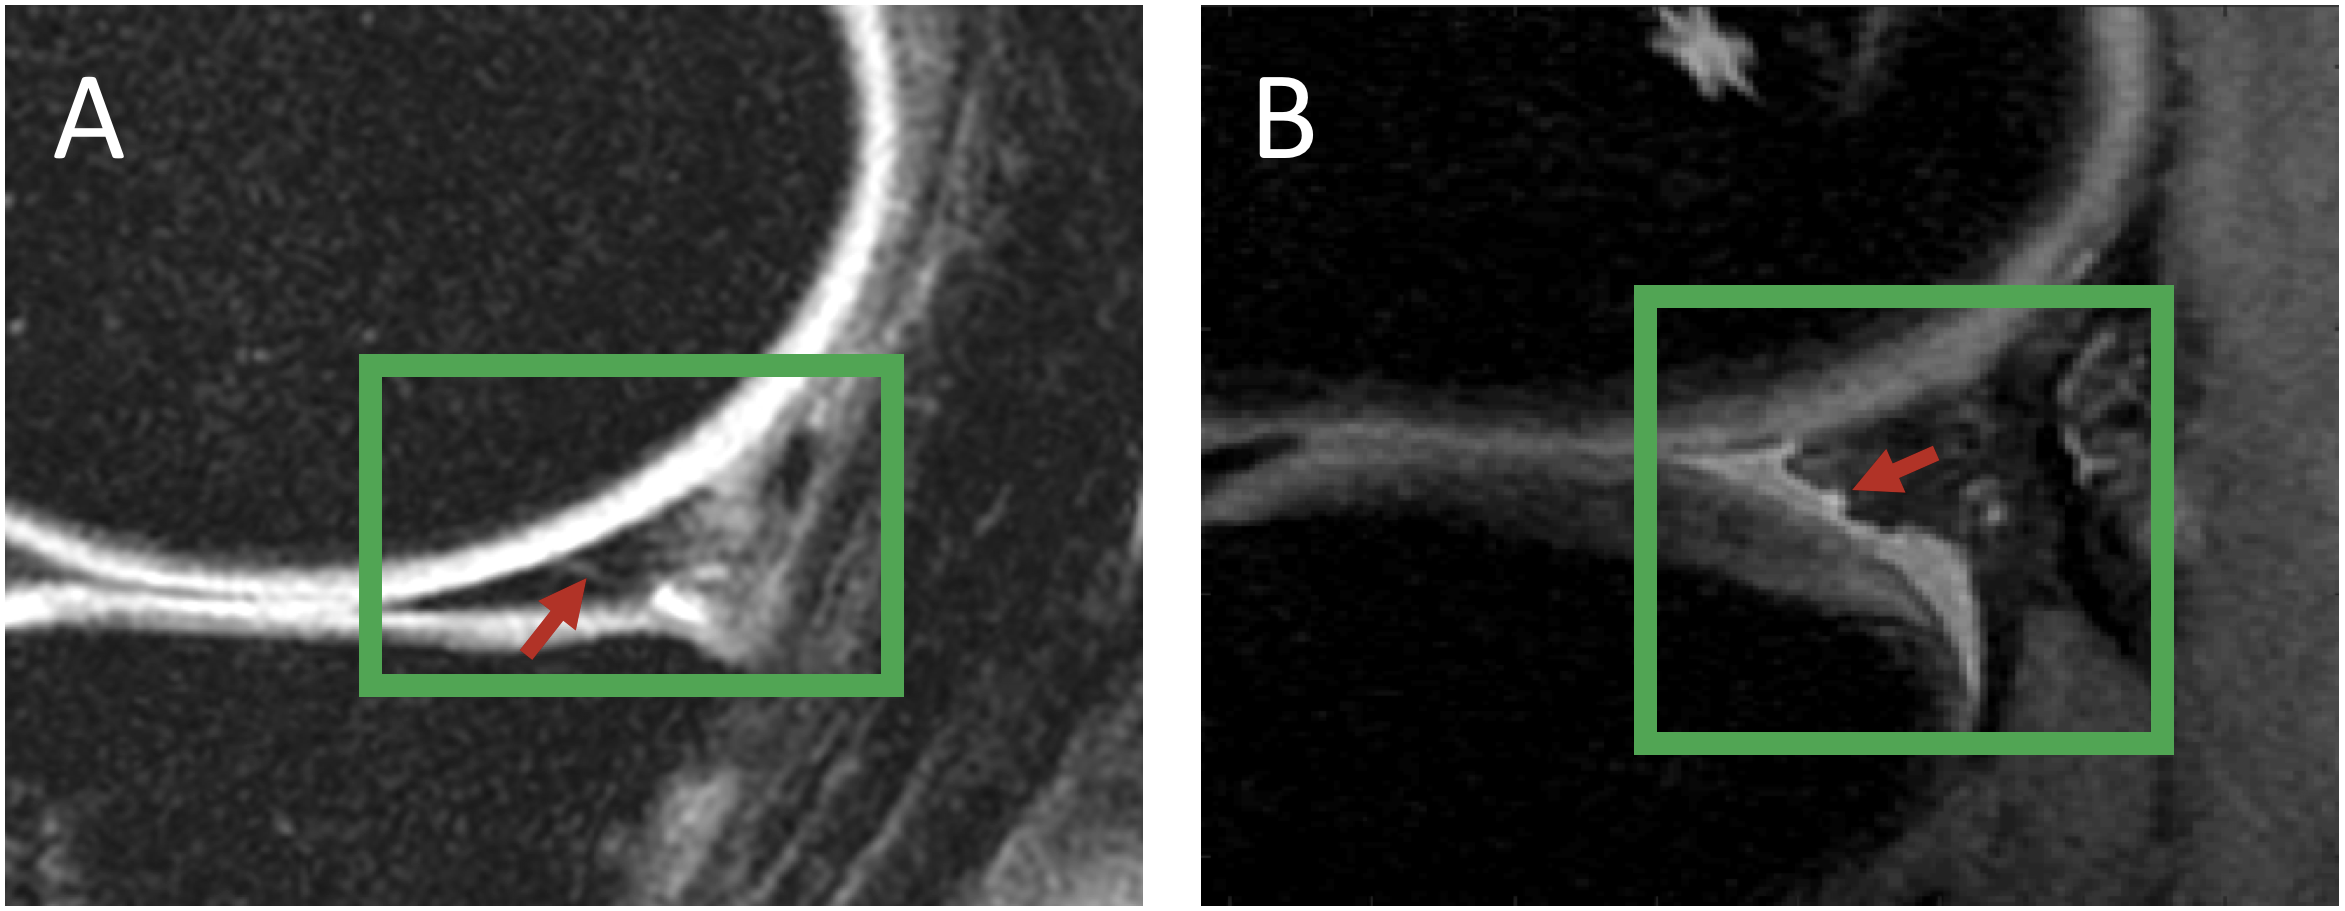
Figure 4: Model
Misclassification Examination: (green boxes represent the bounding box) A. This meniscus was graded as having
no lesion but the model predicted there was one. There does appear to be small linear
signal abnormality (indicated by the red arrow) that may extend to the surface
which would classify it as a lesion. B.
This meniscus was graded as having a lesion but the model predicted there was
no lesion. This meniscus is severely deformed and irregular so it was graded as having a complex
tear even though there was no traditional complex tear.