1035
High resolution diffusion MRI maps of mice with normal and dysfunctional placentas reveal clear fetal differences1Department of Chemical and Biological Physics, Weizmann Institute of Science, Rehovot, Israel, 2Department of Biological Regulation, Weizmann Institute of Science, Rehovot, Israel
Synopsis
DWI could evaluate pregnancy-related dysfunctions, yet EPI’s sensitivity to motions and air/water/fat heterogeneities prevent these studies in preclinical settings. We developed DWI methodologies based on SPatiotemporal ENcoding (SPEN) for overcoming these obstacles, delivering ADC images at ≈150µm resolutions. We demonstrate the power of these new methods to resolve placental layers (maternal, fetal, trophoblastic) and umbilical cords, as well as brain features in developing mice fetuses. Daily monitoring of pregnancies for naïve and for eNOS-/- mice also showed differences in the development of placental and fetal (e.g. brain) structures. SPEN DWI thus opens the potential for the early detection of pregnancy disorders.
INTRODUCTION
Understanding the fetoplacental unit, its dynamics and development, requires characterizing the fluids within its key compartments. Diffusion imaging (DWI) could do so without the need for optical access or exogenous agents[1]. The combination of motional artifacts and heterogeneities in abdominal tissues, however, challenge such MRI studies. Although the EPI sequences on which DWI rely are incapable of tackling these problems in rodents, we have recently shown that spatiotemporal encoding (SPEN) techniques can cope with DWI on mice placenta[2]. Those initial single-shot SPEN studies suffered from limited resolution; we have now developed new interleaved approaches that can deliver diffusivity maps with ~100µm resolutions[3]. The power of these new methods is here used to monitor the progress of fetoplacental units from day E10.5 onwards, and to compare development between naïve and vascularly-altered mice.METHODS
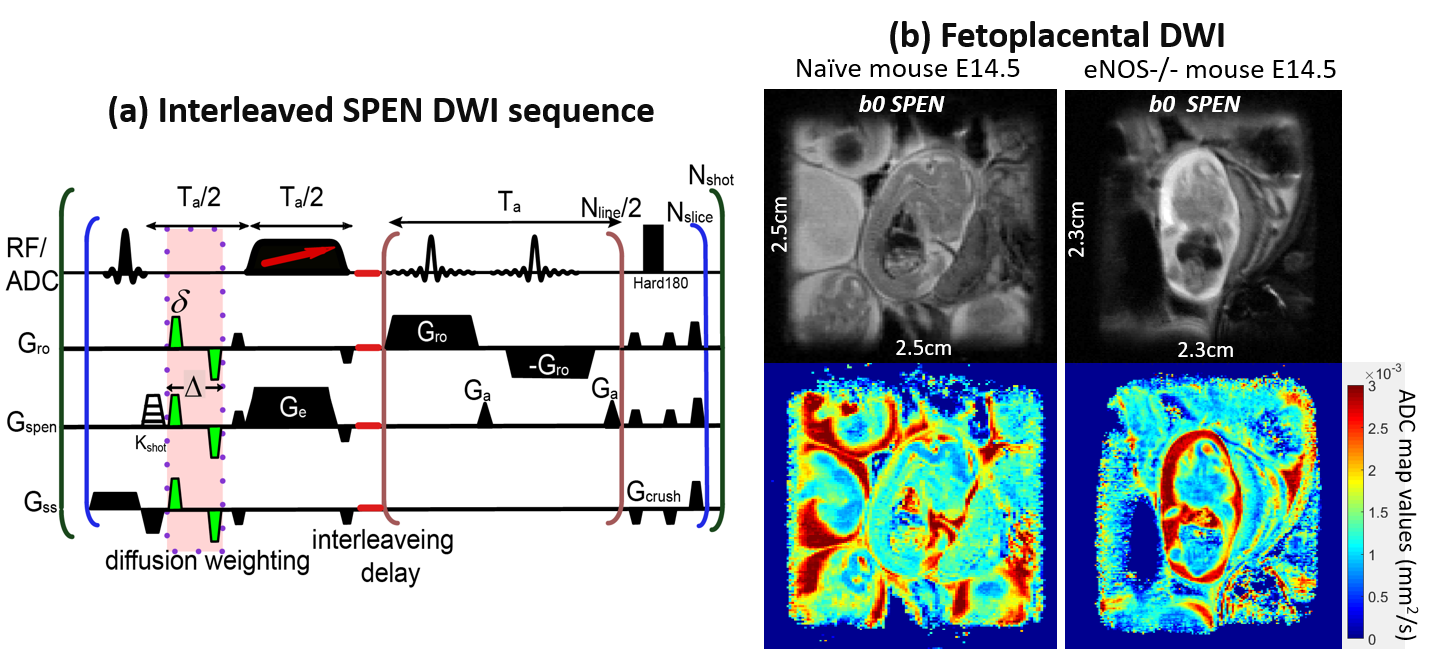
Daily pregnancy development was monitored on control mice and on mice deficient on the eNOS-/- (endothelial nitric oxide synthase) gene, which leads to growth-restricted symptoms. MRI was performed from gestation day E10.5 onwards on a 7T Agilent scanner using the SPEN sequence in Fig. 1a, which includes diffusion-weighting bipolar gradients placed within a full-refocusing period[4], an interleaved encoding module including blipped interleaving gradients/delays and an adiabatic π pulse in the presence of Ge[3, 5], and an acquisition including an oscillating readout gradient scanning kRO interspersed with blipped Ga gradients rasterizing the SPEN dimension. Isotropic diffusion was probed along three orthogonal directions with 0, 550 s/mm2 nominal b-values. Other parameters were TR/TE=2000ms/45ms, FOV=30x30x1mm3, in-plane resolution 187µm, four averages and respiration trigger. Higher resolution (~140µm, Fig. 1b) images were obtained using SPEN’s “zooming” abilities (FOV=23x23x1mm3).RESULTS & DISCUSSION
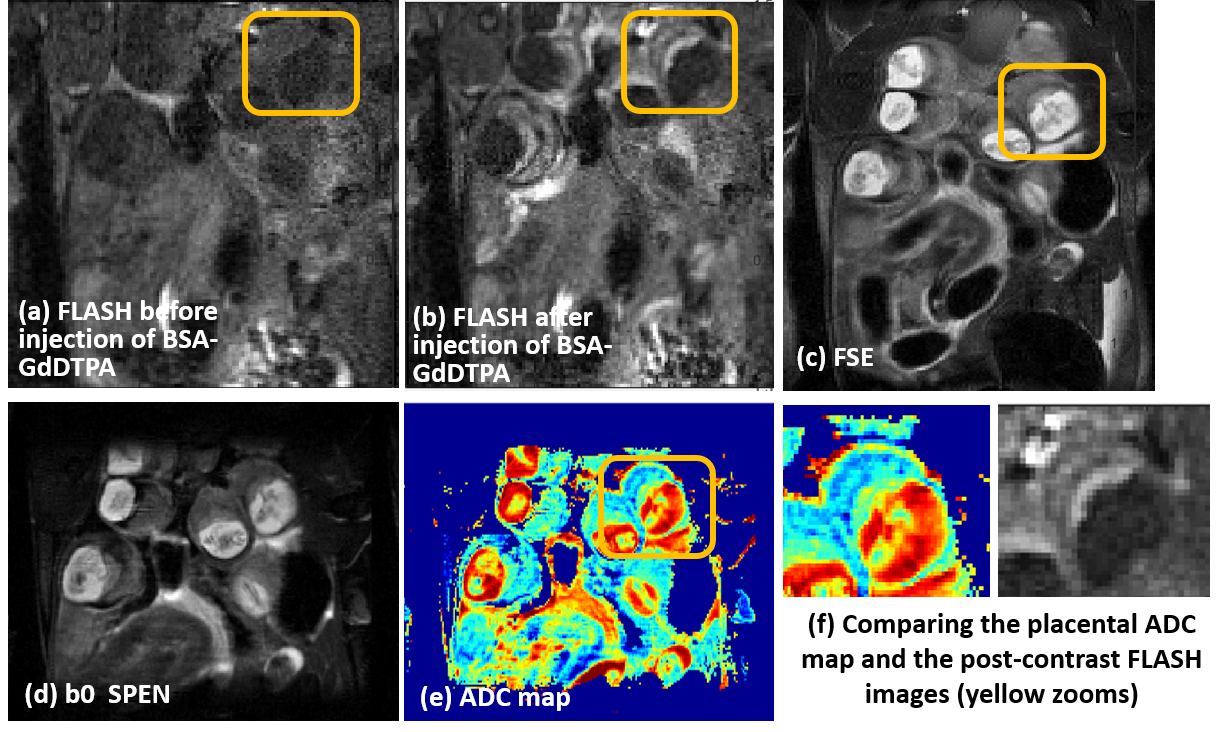
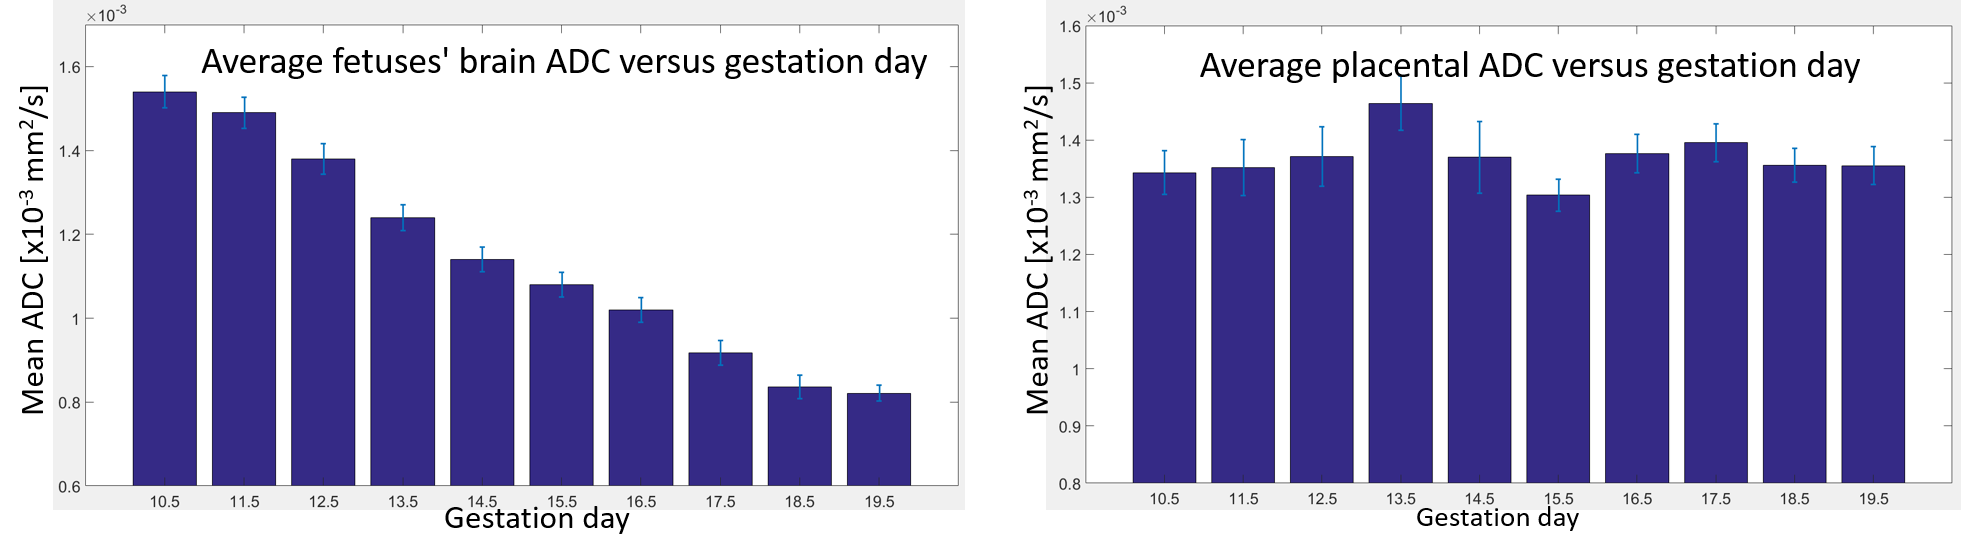
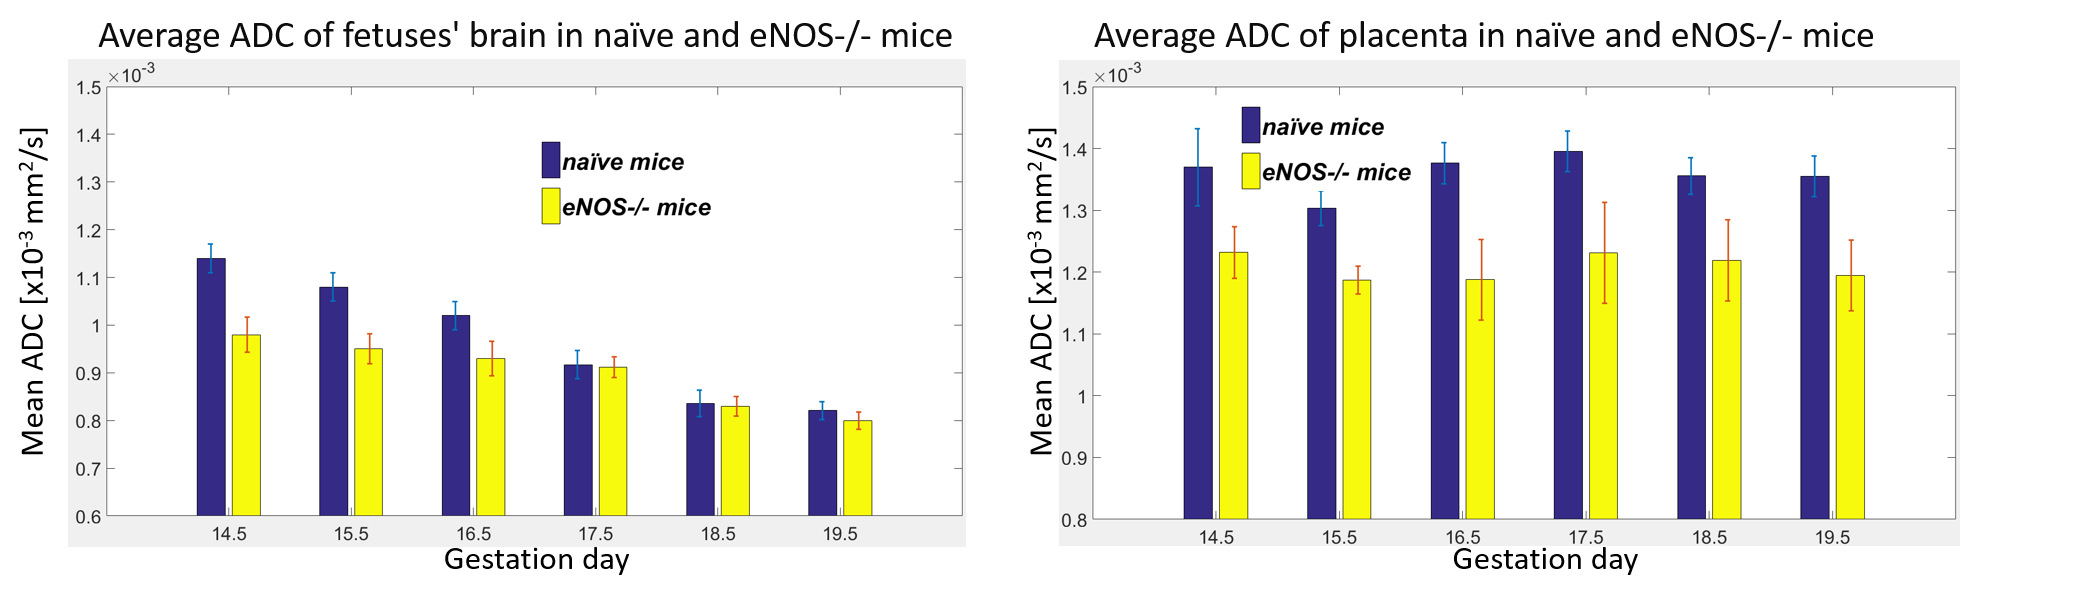
Diffusivity was followed on pregnancy mice from gestation day E10.5 onwards. Figure 1b shows E14.5 SPEN ADC data for full fetoplacental units clearly evidencing the fetal heart, liver, brain and spinal cord in both naïve and diseased mice. Also resolved are three placental layers that had not been observed in earlier mice studies[2]. These layers are also demonstrated by T1-weighted FLASH images upon employing BSA-GdDTPA, a high molecular weight contrast agent. Due to its size BSA-GdDTPA perfuses through the maternal circulation but is unable to cross the placental barrier. Figure 2 compares FLASH images (TR/TE=60/2.6ms, flip angle=75) before/after BSA-GdDTPA, against FSE (RARE) and SPEN b0 images for day E10.5; also shown is a SPEN-derived ADC map. The barely visible placenta becomes clear in FLASH after BSA-GdDTPA’s administration (Figs. 2a, 2b); particularly highlighted then are the maternal labyrinth layer and a pearled giant trophoblast cell structure. The same structures can be adumbrated in the T2-weighted FSE and b0 SPEN images (Figs. 2c and 2d), yet they are best identified in DWI recorded at this high resolution (Figs. 2e, 2f) thanks to the higher ADCs of the maternal-layer circulation and lower ADC values for the trophoblasts. Figures 3 and 4 show further opportunities opened by these measurements, with a systematic analysis on how average placental and fetal brain ADCs change in naïve and in hypertensive mice. While placental ADCs remain relatively constant throughout the last ten days of pregnancies, the fetal brain ADCs consistently decrease with gestational age, from 1.50±0.05x10⁻³ to 0.80±0.03x10⁻³ mm2/s, evidencing the brain’s maturation. Figure 4 compares fetal brain and placental ADC values for the naïve and knockout mice. Despite their similar sizes and layered morphologies (Fig 1b) the eNOS-/- mice show consistently smaller placental ADCs than the normal ones: 1.20±0.05x10⁻³ vs 1.37±0.04x10⁻³ mm2/s. This likely reflects the inappropriate maternal/fetal nutrient transport, a characteristic phenotype for this model of intrauterine growth restriction. By contrast, no statistically significant differences are revealed for the brain’s ADC –consistent with the similar brain volumes shown by naïve and diseased animals.CONCLUSION
SPEN can measure ADC maps of in vivo pregnant mice at unprecedented resolutions. New structures could be thus characterized by DWI, and systematic developmental studies of dam and fetal changes for naïve and diseased mice became feasible. ADCs show a clear evolution in the fetal brain’s maturation; differences in the placental diffusivities of naïve and altered mice were also detected. These results open new vistas into pregnancy physiology, as well as a potential markers for an early detection of pregnancy disorders.Acknowledgements
We are grateful to Dr. Joel Garbow (Washington Univ.) for valuable discussions. Financial support from the NIH human placenta project (R01HD086323), Minerva Foundation (#712277), Kimmel Institute for Magnetic Resonance and the Perlman Family Foundation (Weizmann) are gratefully acknowledged.References
1. Bonel, H.M., et al., Diffusion-weighted MR Imaging of the Placenta in Fetuses with Placental Insufficiency. Radiology, 2010. 257(3): p. 810-819.
2. Solomon, E., et al., Major mouse placental compartments revealed by diffusion-weighted MRI, contrast-enhanced MRI, and fluorescence imaging. Proc Natl Acad Sci U S A, 2014. 111(28): p. 10353-8.
3. Qingjia Bao, G.L., Eddy Solomon,Miki Lustig and Lucio Frydman, Diffusion-weighted in vivo imaging with ≤100 µm resolution: Principles and applications to ADC mapping of pregnant mice. In Proceedings of the 26 annual meeting ISMRM 2018, 2018.
4. Schmidt, R. and L. Frydman, New spatiotemporal approaches for fully refocused, multislice ultrafast 2D MRI. Magn Reson Med, 2014. 71(2): p. 711-22.
5. Schmidt, R., A. Seginer, and L. Frydman, Interleaved multishot imaging by spatiotemporal encoding: A fast, self-referenced method for high-definition diffusion and functional MRI. Magn Reson Med, 2016. 75(5): p. 1935-48.
Figures