1033
OGSE- versus PGSE-derived ADC measurements in patients with liver metastases show reduced hindrance to diffusion at short length scales1CR-UK Cancer Imaging Centre, The Institute of Cancer Research and Royal Marsden Hospital, London, United Kingdom, 2Siemens Healthcare, Erlangen, Germany
Synopsis
The oscillating gradient spin echo (OGSE) diffusion method probes the diffusion spectrum at defined length scales. This comparative study investigates the effect of short diffusion times on apparent diffusion coefficient (ADC) measurements using OGSE and PGSE diffusion sequences in six patients with liver metastases. Similar cohort mean ADC values were reported for all PGSE measurements, while the OGSE-derived ADC was significantly higher (paired t-test p-value=0.029). This increase in OGSE-measured ADC in liver tumours suggests that water molecules suffer less hindrance at shorter diffusion times (as already observed in brain studies) and provides additional information regarding the tissue microstructure.
Introduction
Diffusivity of water molecules within the
microstructure of biological tissues is time dependent. The oscillating gradient spin echo (OGSE) diffusion method probes
the diffusion spectrum at defined frequencies, thus exploring different length
scales1,2. The
OGSE method has previously been tested in human brain showing an
increase in diffusion tensor eigenvalues and a decrease in fractional
anisotropy when compared to a classical pulsed gradient spin echo (PGSE)
diffusion measurement3. In this continuing study we are
investigating the effect of short diffusion times on apparent diffusion coefficient (ADC) measurements
using OGSE and PGSE diffusion sequences in patients with liver metastases.
Patients and methods
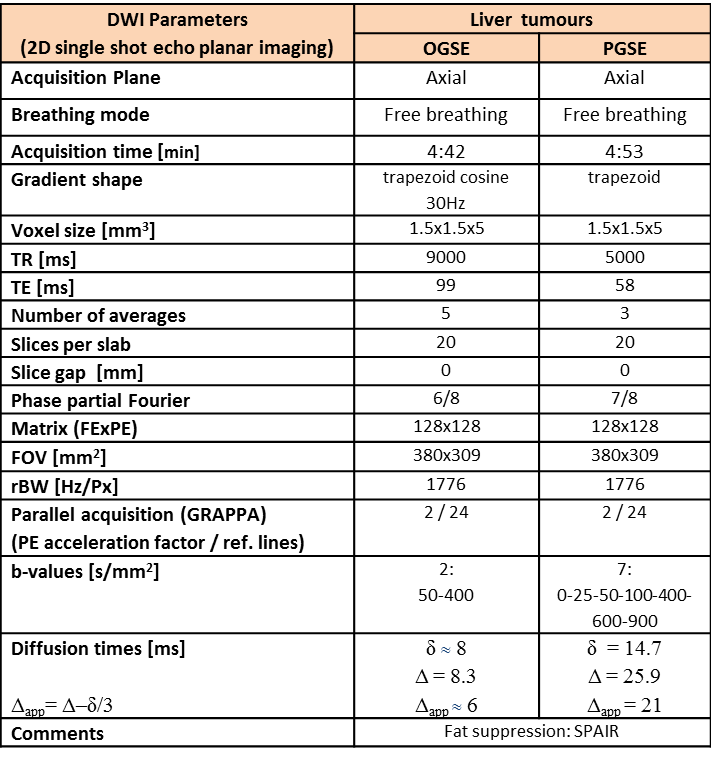
Six patients with liver metastases (5 colorectal and 1 breast primary cancers) were scanned on a 1.5T scanner (MAGNETOM Aera, Siemens Healthcare, Erlangen, Germany). The patients (4 males, 2 females, average age 68.2±16.2 years) were referred for an MR scan for either staging (3 patients) or therapy response assessment (3 patients). The MR protocol employed two OGSE and PGSE prototype sequences with matched resolution and b-values (see Table 1). The OGSE sequence uses a trapezoid cosine diffusion gradient4 at 30 Hz, and 2 b-values of 50 and 400 s/mm2 (maximum obtainable value for the selected echo time TE), while the PGSE sequence uses a range of 7 b-values from 0 to 900 s/mm2. The main interest was to compare the ADC obtained using the two sequences.
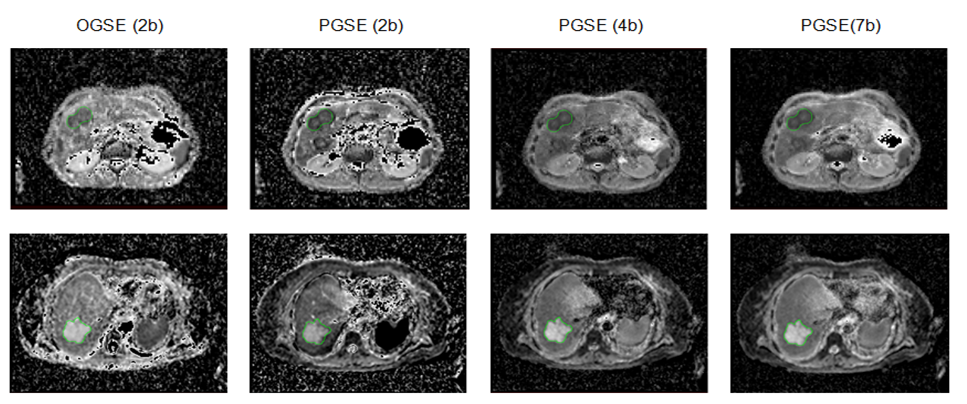
Regions of interest (ROIs) covering three central slices of the target lesion were drawn on high-b-value images (b900, PGSE sequence) and translated on the ADC maps derived from the two sequences. ROIs were carefully defined in order to avoid any visible blood vessels around the tumour. ADC was calculated assuming the classical mono-exponential attenuation5, and pixel-wise analysis was performed for each tumour using in-house software (ADEPT). Three PGSE-derived ADCs were calculated: 1) using the same 2 b-values [PGSE(2b)] for direct comparison with OGSE-derived ADC; 2) using the highest 4 b-values (b≥100 s/mm2) to exclude perfusion effects [PGSE(4b)]; 3) using all 7 b-values [PGSE(7b)]. Median ADC values for each method were reported per patient, and paired t-tests (MATLAB 2016a) compared the reported values.
Results and discussion
Figure 1 presents examples of measured ADC maps for two patients with metastases from colorectal adenocarcinoma (first row) and colorectal mucinous adenocarcinoma (second row) the latter showing higher ADC than is usual for a metastatic lesion. Relatively small tumour volumes were available in this initial cohort of patients: 9.1 mL to 27.6 mL with a mean of 16.8 mL.
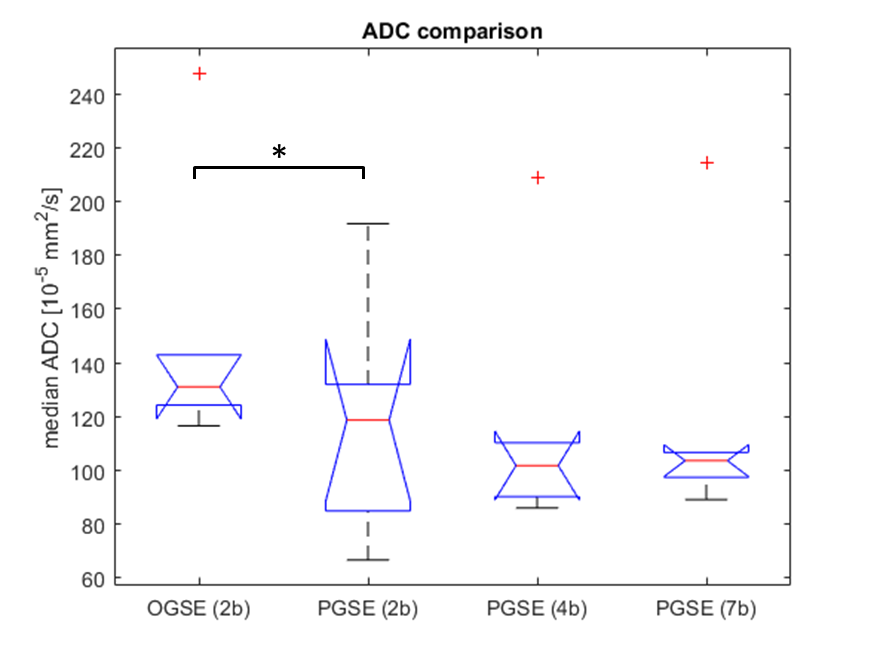
Similar cohort mean ADC values were reported for all PGSE measurements, i.e. 118.9 x 10⁻⁵ mm2/s for PGSE(2b), 116.6 x 10⁻⁵ mm2/s for PGSE(4b), and 119.2 x 10⁻⁵ mm2/s for PGSE(7b), suggesting that there is a limited perfusion effect in these tumours. The OGSE-derived ADC was significantly higher at 149.2 x10⁻⁵ mm2/s with a p-value of 0.029 for the OGSE(2b)/PGSE(2b) paired t-test and even stronger significance (p<0.001) for any comparison between OGSE and the PGSE(4b) or PGSE(7b). The boxplot in Figure 2 demonstrates an overall increase in OGSE-measured ADC in liver tumours suggesting that water molecules suffer less hindrance at shorter diffusion times, as already observed in brain3.
Translating these mean measured ADC values into Einstein`s relation <r2> = 6∙ADC∙Δ (where <r2> = mean square displacement and Δ = diffusion time) for each OGSE/PGSE experiment gives measurable diffusion length scales at ~8.62 μm for OGSE and ~13.59 μm for PGSE. These preliminary results support evidence that whilst the PGSE method measures a hindered diffusion regime at ~13.59 μm (the nominal range for clinical DWI measurements), the OGSE method could assess a less-hindered diffusion regime6, at ~8.62 μm, providing potential improved sensitivity to change in the tumour extracellular matrix.
However, results should be interpreted with care as the cosine-modulated OGSE sequence is intrinsically flow compensated, whilst the PGSE sequence exhibits flow sensitivity. Nevertheless, the observed non-significant difference between the 4b/7b PGSE-derived ADC (p=0.37) suggests that the perfusion effect in these tumours was minimal implying that ADC differences between OGSE and PGSE measurements are largely due to the difference in diffusion times. Further work would benefit from a larger cohort and a direct comparison with a flow-compensated PGSE technique.
Conclusion
Overall, the increased OGSE-derived ADC observed in patients with liver
metastases suggests that the OGSE diffusion method provides additional
information regarding the tissue microstructure.Acknowledgements
CRUK and EPSRC support to the Cancer Imaging Centre at ICR and RMH in association with MRC & Dept of Health C1060/A10334, C1060/A16464 and NHS funding to the NIHR Biomedical Research Centre and the Clinical Research Facility in Imaging. This report is independent research funded partially by the National Institute for Health Research. The views expressed in this publication are those of the author(s) and not necessarily those of the NHS, the National Institute for Health Research or the Department of Health.References
1. Gore JC, Xu J, Colvin DC, Yankeelov TE, Parsons EC, Does MD. Characterization of tissue structure at varying length scales using temporal diffusion spectroscopy. NMR Biomed. 2010; 23: 745–756.
2. Does DD, Parsons EC, Gore J. Oscillating gradient measurements of water diffusion in normal and globally ischemic rat brain. Magn.Reson.Med. 2003; 49: 206-215.
3. Baron CA, Beaulieu C. Oscillating gradient spin-echo (OGSE) diffusion tensor imaging of the human brain. Magn Reson Med. 2014; 72(3): 726-36.
4. Van AT, Holdsworth SJ, Bammer R. In vivo investigation of restricted diffusion in the human brain with optimized oscillating diffusion gradient encoding, Magn.Reson.Med. 2014;71-83.
5. Stejskal EO and Tanner JE. Spin diffusion measurements: spin echoes in the presence of a time‐dependent field gradient. J Chem. Phys, 1965; 42: 288-292.
6. Martin M. Measuring restriction sizes using Diffusion Weighted Magnetic Resonance Imaging: a review, Magn Reson Insights. 2013; 6: 59-64.
Figures