1032
Diffusion-based tractography atlas of the human acoustic radiation1CIMeC Center for Mind/Brain Sciences, Trento, Italy, 2Structural and Functional Connectivity Lab, Div. of Neurosurgery, “S.Chiara Hospital", Trento, Italy
Synopsis
This study presents the first tractography-based atlas of the acoustic radiation from a population of 34 young healthy subjects. The atlas was constructed using high quality MRI data from the Human Connectome Project. The acoustic radiation reconstruction was optimized with a systematic evaluation of MRI acquisition and analysis parameters using as reference reconstructions validated from an ex-vivo dissection study from our group (Maffei et al., 2017). The optimized reconstruction parameters and the atlas may be used in future studies interested in identifying and characterizing the acoustic radiation.
Introduction
Diffusion-based MRI (dMRI) tractography allows in-vivo characterization of white matter architecture, including the localization and description of brain fibre bundles. However, some primary bundles are still only partially reconstructed, or not reconstructed at all. The acoustic radiation (AR) is a primary sensory pathway that has been largely omitted in many tractography studies investigating audition and language, due to its location and anatomical features1 as well as potential limitations in the acquisition and tractography parameters chosen2,3. In this study, we investigated the effects of dMRI acquisition and tractography parameters on the reconstruction of the AR using publicly available Human Connectome Project data. The aims of this study are: i) using a subgroup of subjects and a reference AR for each subject, define an optimum set of MRI acquisition and tractography parameters for AR reconstruction, and ii) use the optimum parameters set on the full group to build a tractography-based atlas of the AR.Methods
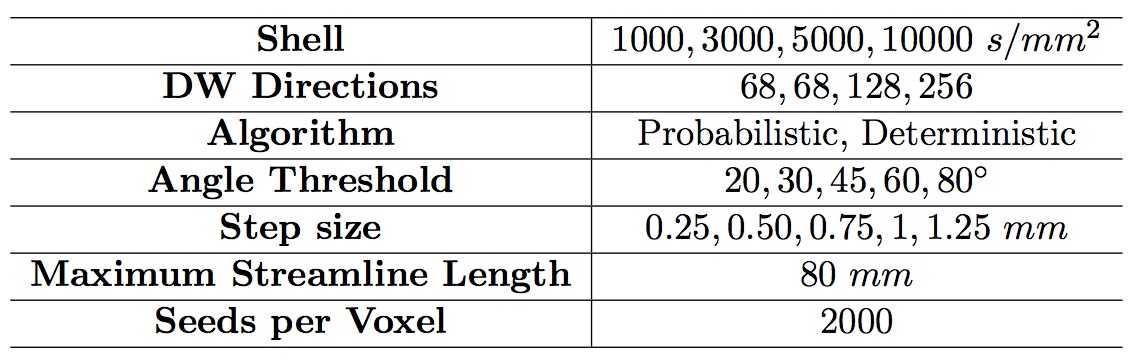
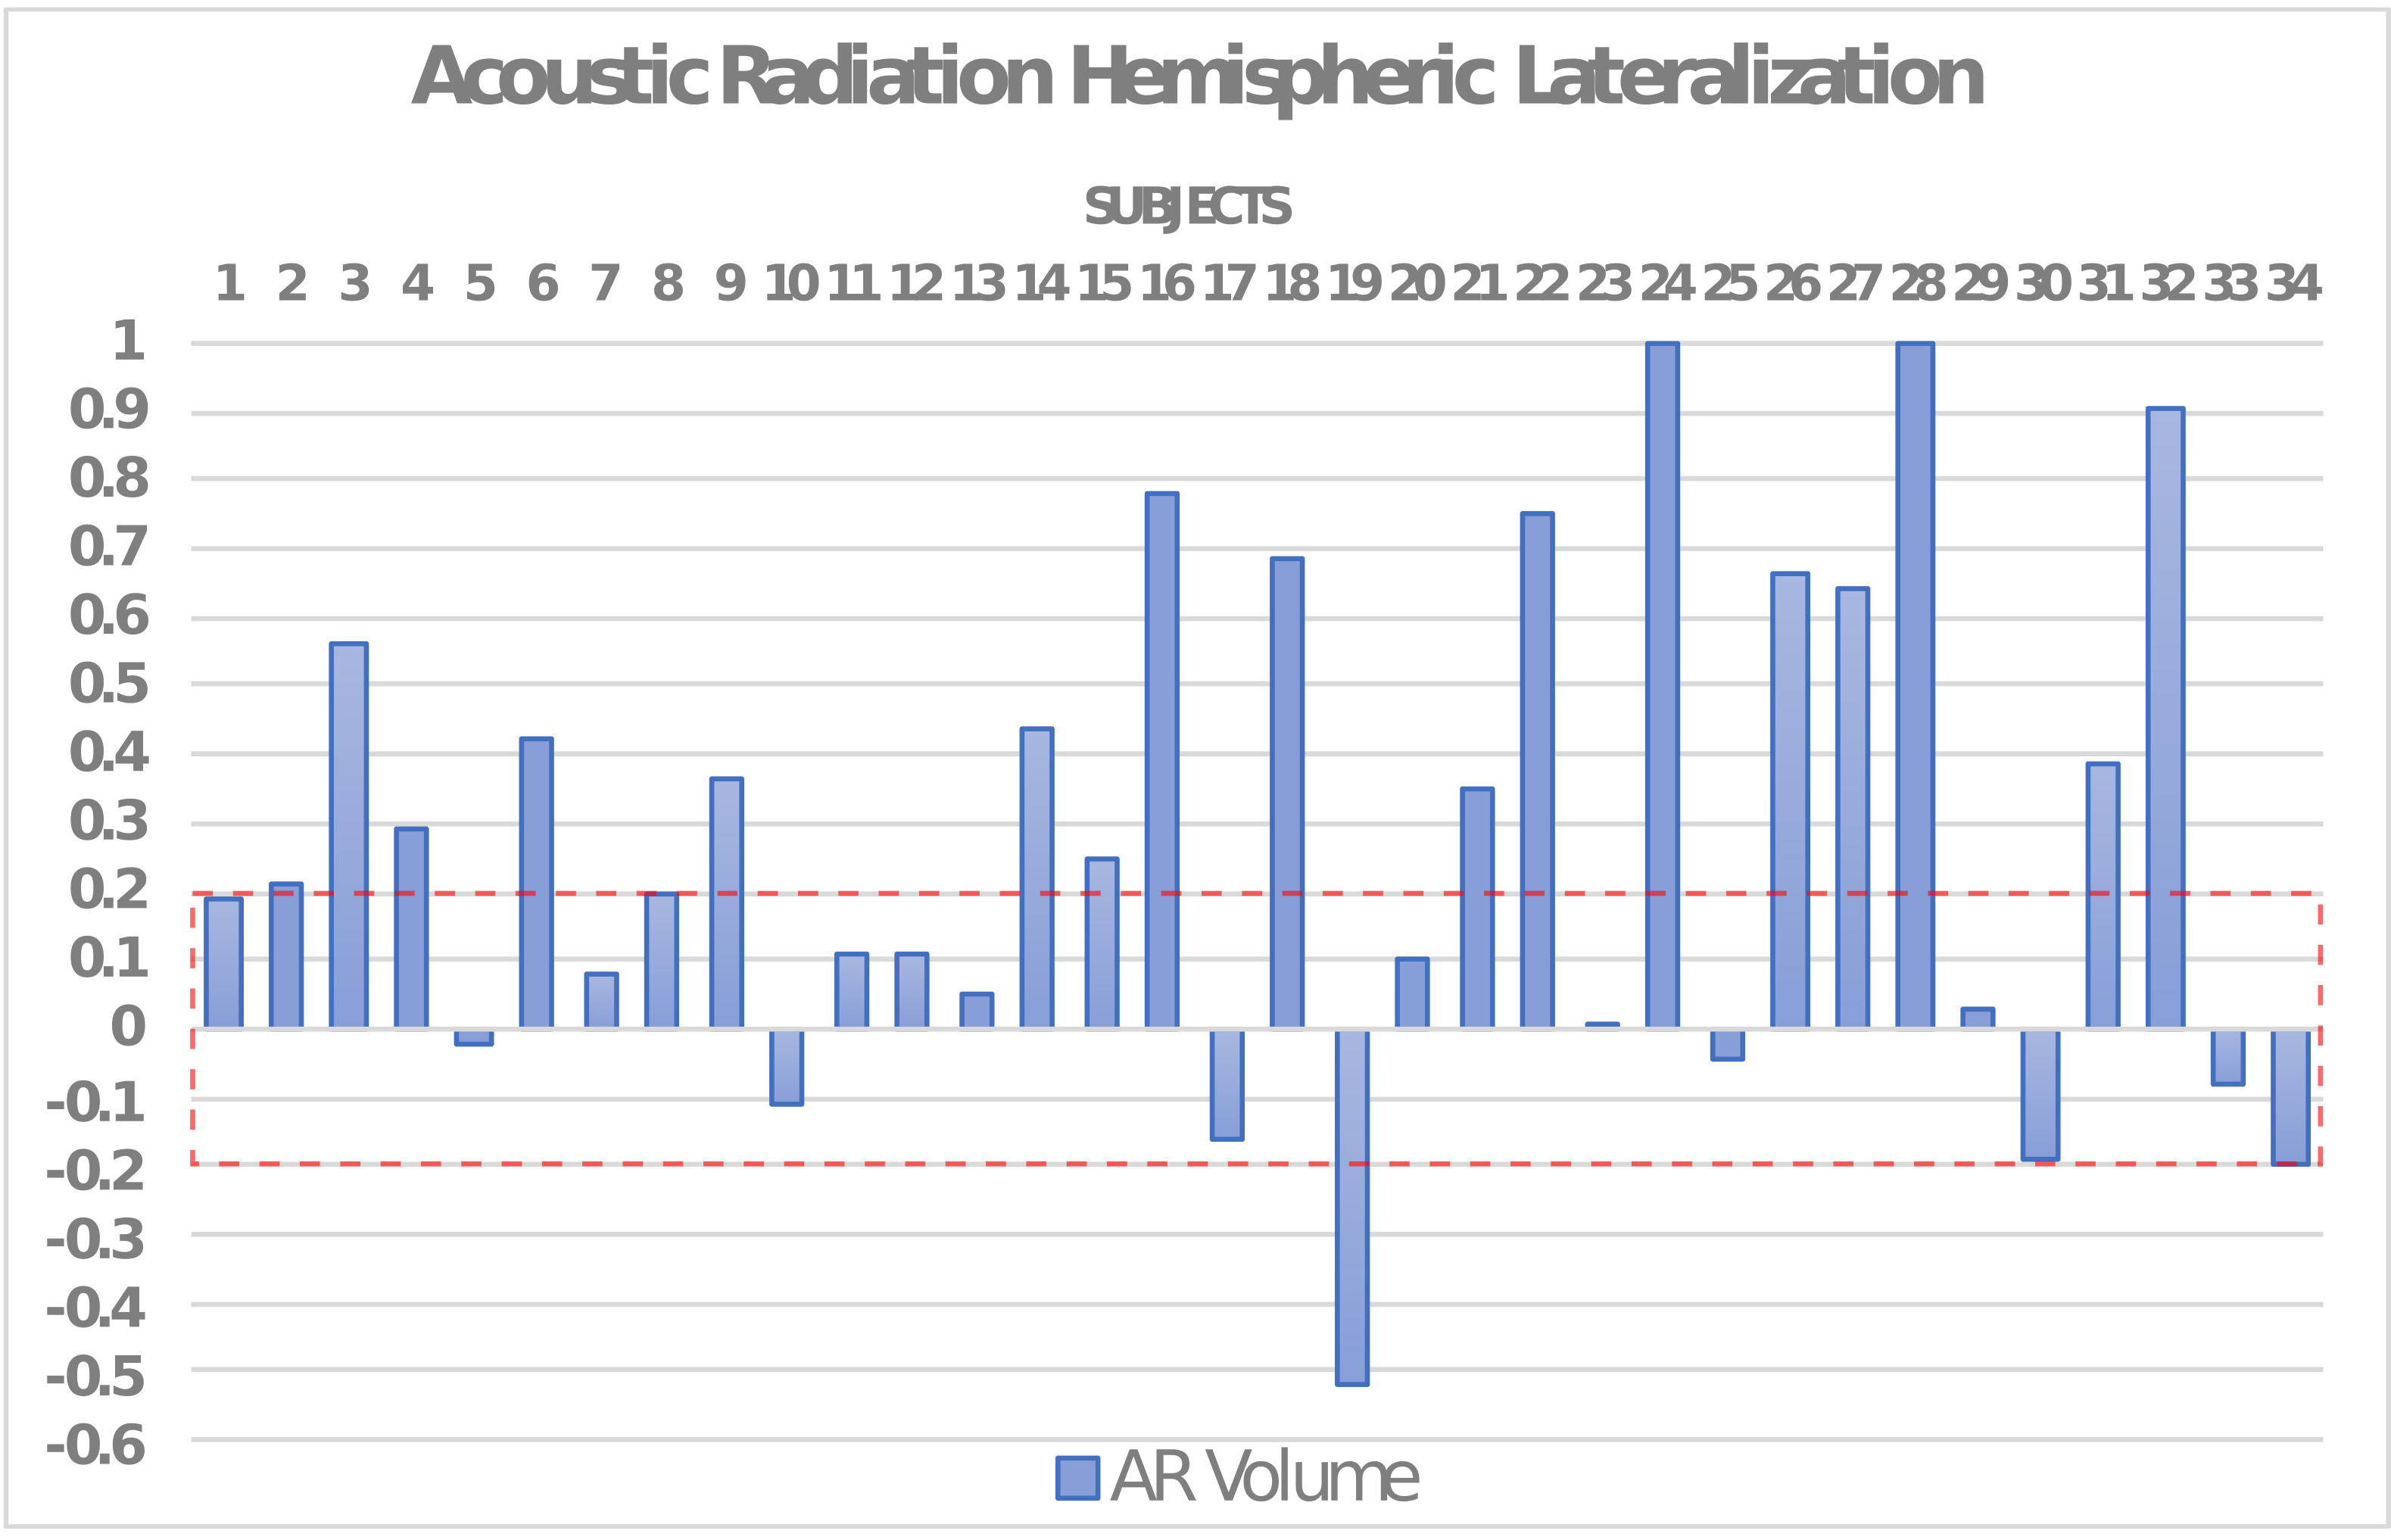
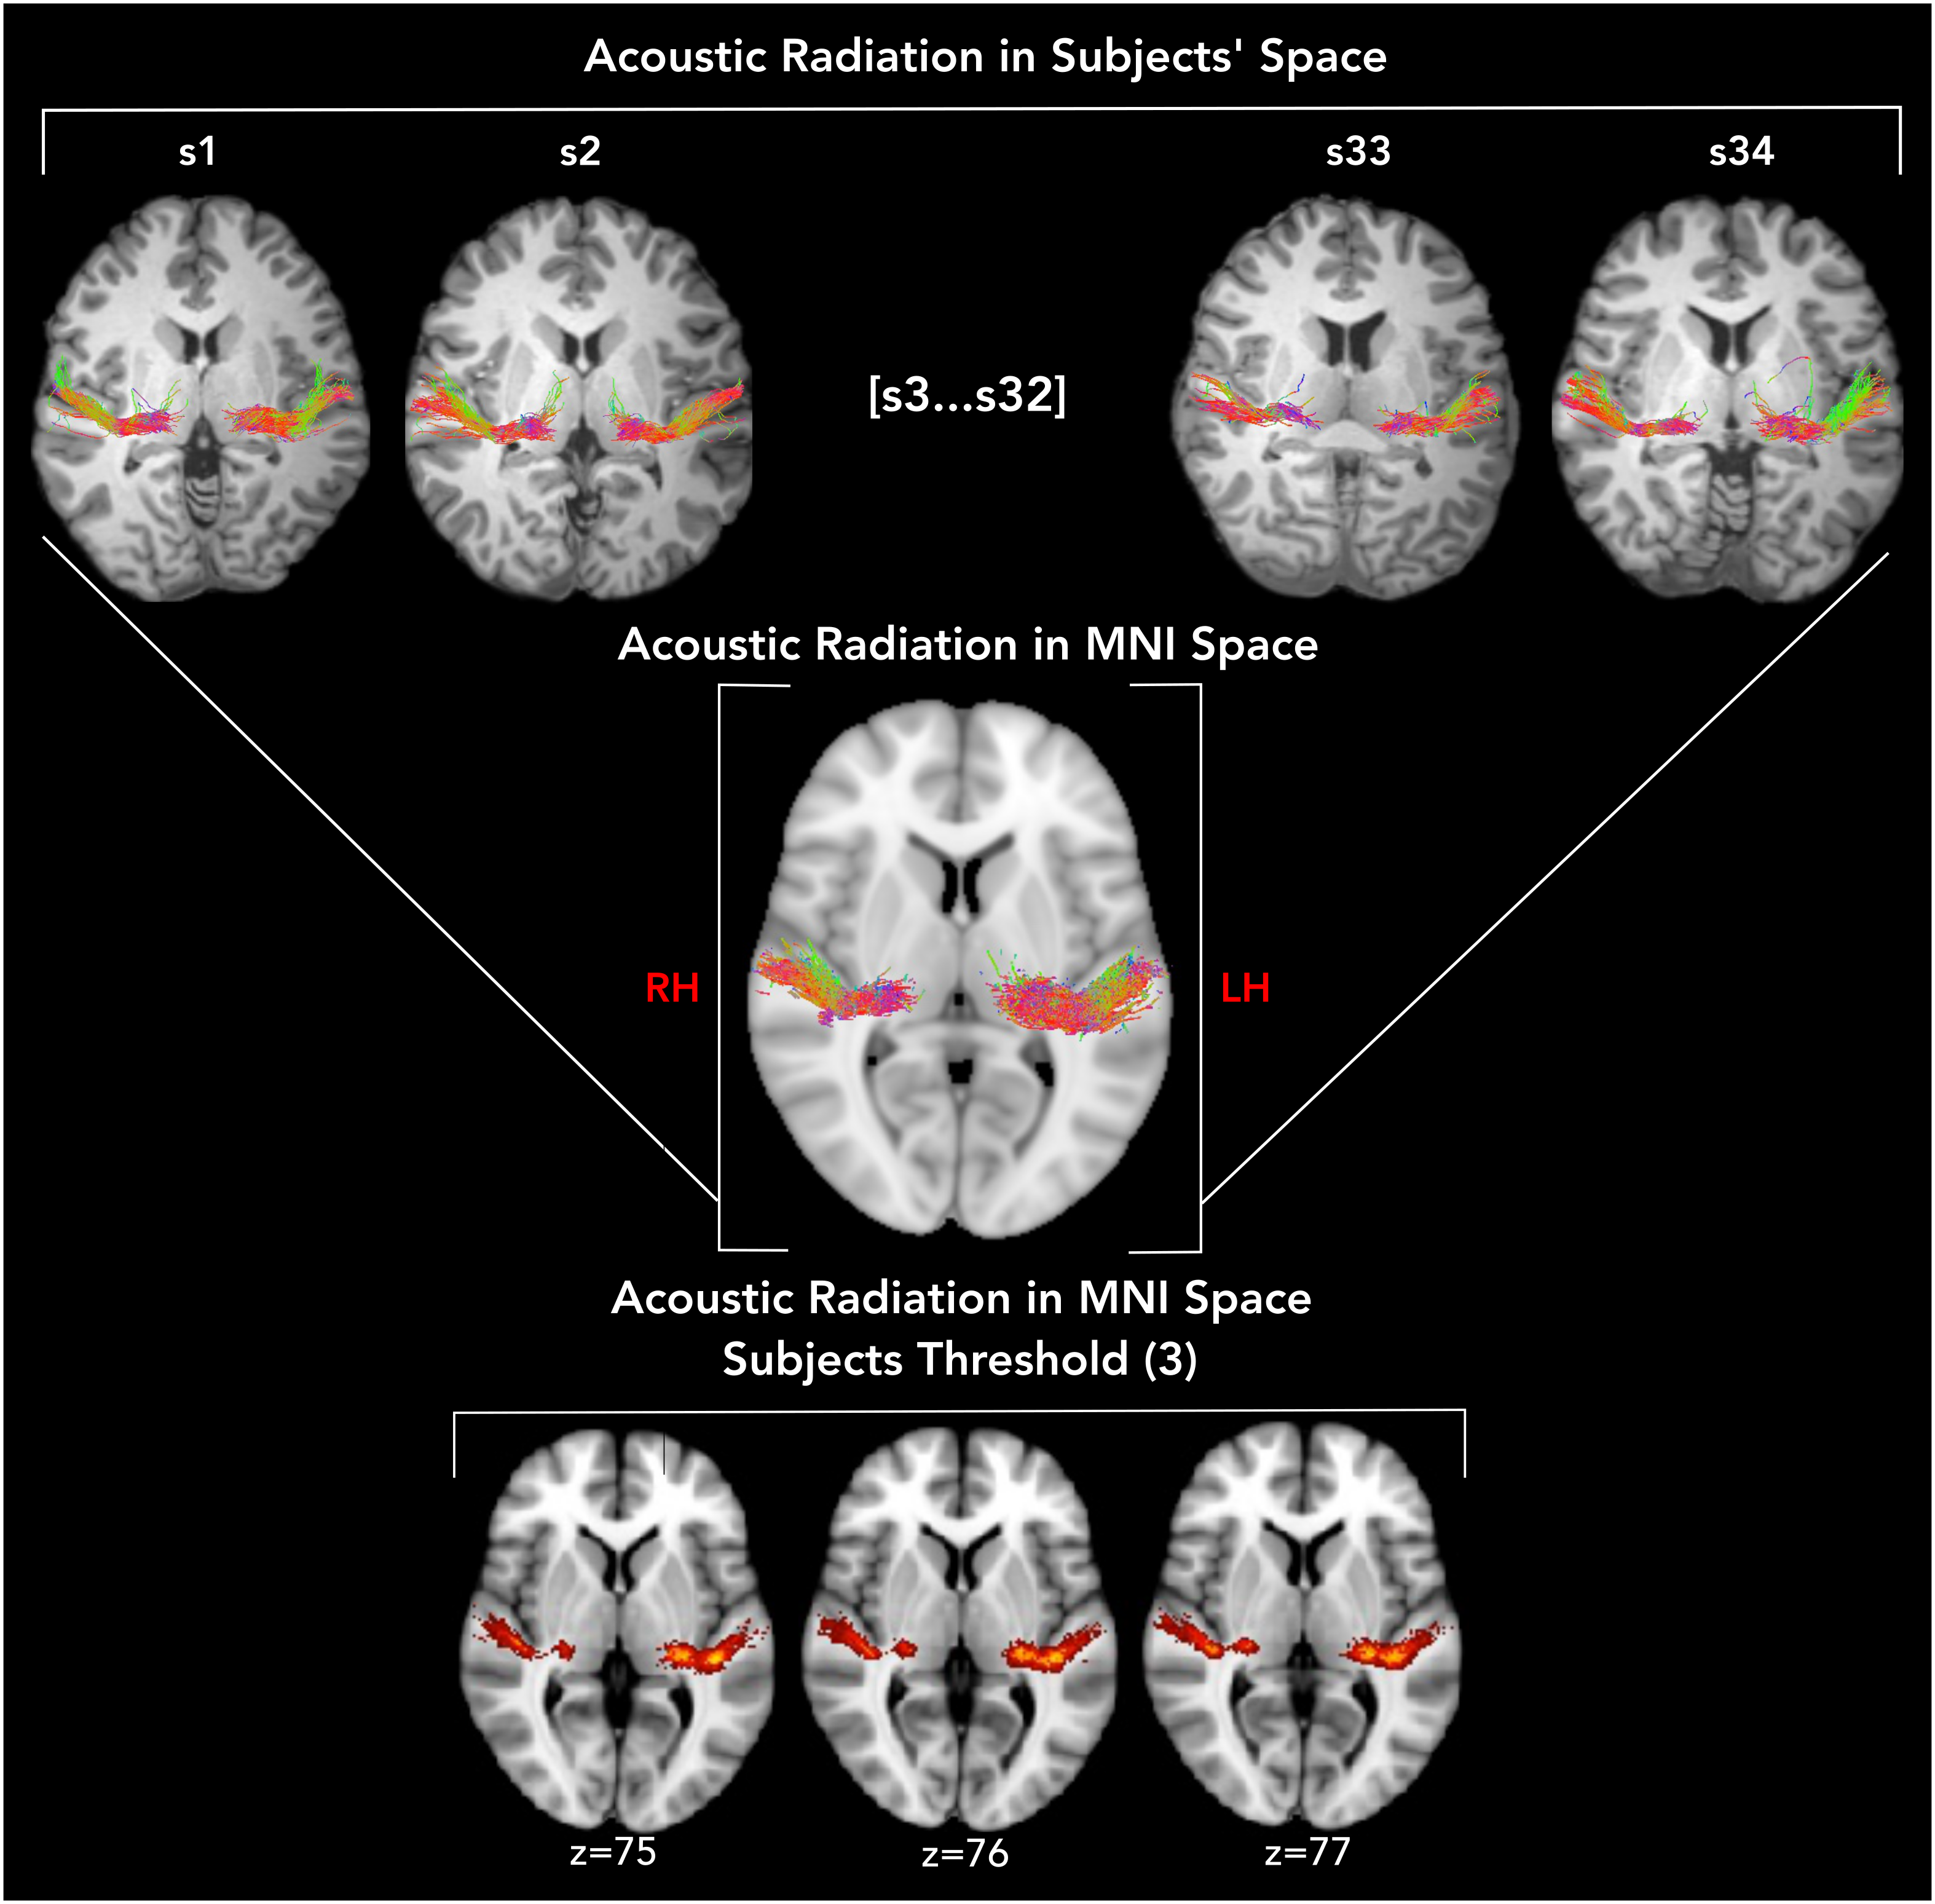
The diffusion dataset is constituted by a multi-shell acquisition (b-factor=1000, 3000, 5000 and 10000 s/mm2) for a total of 552 directions at 1.5 mm isotropic resolution4. In order to investigate acquisition parameters, the four shells were separately analysed in MRTrix35. The constrained spherical-deconvolution-based diffusion profiles (FODs) were reconstructed for each subject from the shell-specific average response function. The thalamus was segmented in FSL (FIRST) for use as seeding ROI to initiate tractography. The Heschl's gyrus was manually segmented in each subject and was used as a target ROI. A 5-subjects subgroup (MGH\_1001, 1002, 1003, 1004, 1005) was used to determine the set of acquisition and tractography parameters that would better reconstruct the AR. For each subject, the left and right AR were reconstructed using one set of acquisition and tractography parameters as defined in Table 1. The parameters effects on AR reconstructions were evaluated by measuring the Dice similarity coefficient6 (0=no overlap, 1=complete overlap) with a reference AR tractogram, reconstructed as in 1, and manually filtered by an expert neuro-surgeon (author S.S). The set of parameters providing the highest overlap was applied to the complete dataset (34 subjects, MGH\_1020 was excluded because of incomplete acquisition). A laterality index was computed (LI = {L - R}/{L + R}) to investigate hemispheric asymmetry of the AR volume. To build the atlas, the tractograms were warped into the standard MNI space through a two step diffeomorphic registration performed in ANTS7 and the MRtrix tcknormalize command. We then computed tract density images (TDI) of each AR tractogram in MNI space and summed the binary images (thr=2) to build the final atlas. In this way, the voxel value represents the number of subjects showing AR streamlines at that location.Results
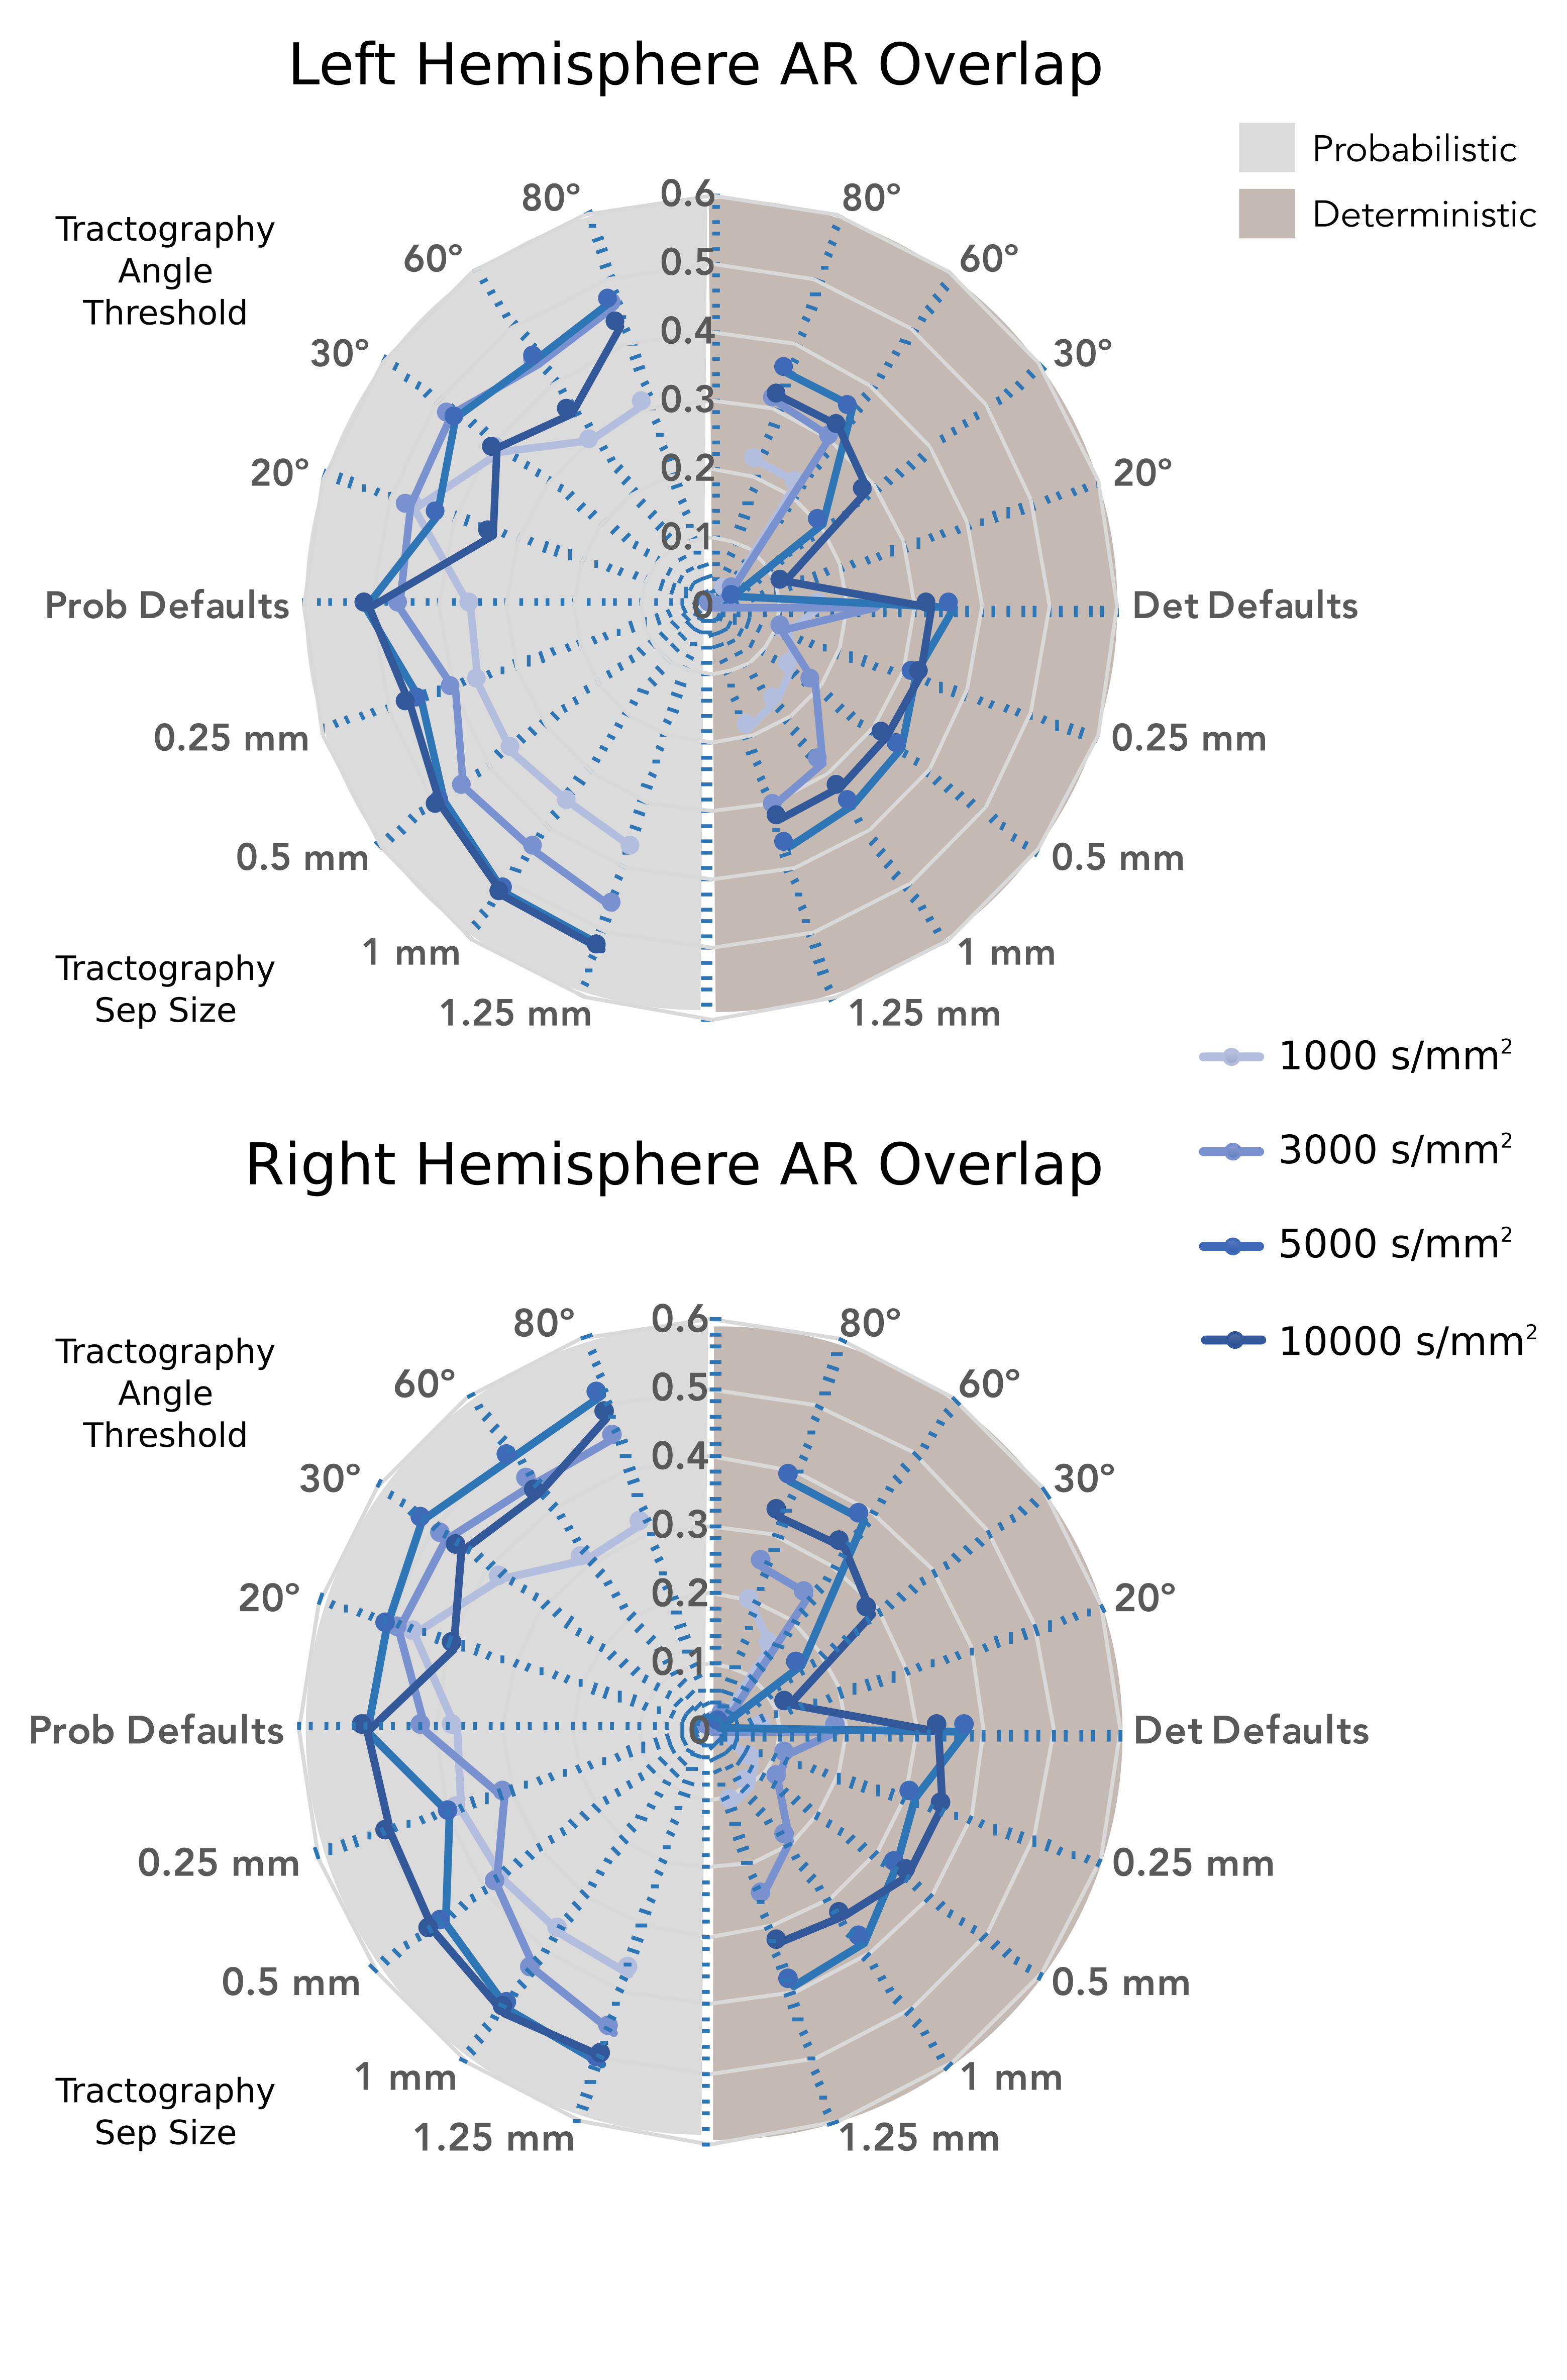
Tractography reconstructions of the AR showed notable differences depending on the choice of shell, tractography algorithm (probabilistic versus deterministic), and tractography parameters. Dice is overall higher for probabilistic reconstructions than for deterministic ones, and higher when using higher b-values. Overall, the default MRTrix tractography parameters seemed to provide the best overlap with the reference AR, even if slightly better results are obtained increasing the step size at higher b-values for probabilistic tractography (Figure 1). Based on this, to reconstruct the AR in the entire dataset (34 subjects) the following parameters were chosen: probabilistic algorithm, b-values=10000 s/mm2, default parameters (step-size=0.75 mm, angle=45º). The AR was successfully reconstructed in most of the subjects, correctly following macro-anatomical landmarks and showing a low number of false positive reconstructions. However, high variability across subjects still emerged (coefficient of variation (CV) of tracts' volume: LH=0.58, RH=0.69, and number of streamlines CV: LH=RH=0.93). Paired t-tests were applied to evaluate the asymmetry of the acoustic radiation volume. Results show a significant degree of left lateralization (p<0.01) (Figure 2). The AR atlas was built from the reconstructions of these 34 subjects (Figure 3).Discussion and Conclusion
Acknowledgements
No acknowledgement found.References
1. Maffei C., Jovicich J., De Benedictis A., Corsini F., Barbareschi M., Chioffi F., Sarubbo S. Topography of the human acoustic radiation as revealed by ex vivo fibers micro-dissection and in vivo diffusion-based tractography. Brain Structure and Function. 2017; 1–11.
2. Thomas C., Ye Frank Q., Irfanoglu M., et al. Anatomical accuracy of brain connections derived from diffusion MRI tractography is inherently limited. Proceedings of the National Academy of Sciences. 2014; 111(46), 16574–16579.
3. Girard G., Whittingstall K., Deriche R., Descoteaux M. Towards quantitative connectivity analysis: reducing tractography biases. NeuroImage. 2014; 98, 266–278.
4. Fan Q., Witzel T., Nummenmaa A., et al. MGH-USH Human Connectome Project datasets with ultra-high b-value diffusion MRI. Neuroimage. 2016; 124(Pt B), 1108-14.
5. Tournier J. D., Calamante F., and Connelly A. MRtrix: Diffusion tractography in crossing fiber regions. Int. J. Imaging Syst. Technol. 2012; 22(1), 53–66.Dice Lee R. Measures of the Amount of Ecologic Association Between Species. Ecology. 1945; 26(3), 297–302.
6. Avants B. B, Epstein C. L., Grossman M., Gee J. C. Symmetric diffeomorphic image registration with cross-correlation: evaluating automated labeling of elderly and neurodegenerative brain. Medical image analysis. 2008; 12(1), 26–41.
Figures