1031
U-fiber, Long-range, and Inter-limbic Tractography Comparison in Epilepsy Patients at 7 Tesla1Translational and Molecular Imaging Institute, Icahn School of Medicine at Mount Sinai, New York, NY, United States, 2Department of Neurology, Icahn School of Medicine at Mount Sinai, New York, NY, United States, 3Department of Radiology, Icahn School of Medicine at Mount Sinai, New York, NY, United States
Synopsis
This study measures alterations in wholebrain connectivity and connectivity of the suspected seizure onset zone (SOZ) in MRI-negative epilepsy patients. Short-range (U-fibers), long-range, and inter-limbic white matter tracts were measured independently in a group of 19 epilepsy subjects and 10 healthy controls using diffusion imaging. Relative wholebrain hypo-connectivity of both U-fibers and inter-limbic fibers was found in epilepsy subjects. Additionally, hyper-connectivity of all 3 fiber types was found in SOZ regions compared with non-SOZ regions. These findings suggest abnormal connectivity in MRI-negative patients may prove useful in SOZ localization and treatment planning.
Introduction
Developing novel methods to localize the seizure onset zone (SOZ) in non-lesional epilepsy patients may offer clinically utility, especially for MRI-negative patients with normal clinical scans (1.5T or 3T). Previous studies of epileptic patients have found both hyper- and hypo-connectivity in the brain, however findings of altered structural connectivity have not yet been established conclusively [1,2]. This study uses 7T MRI to elucidate connectomic changes that occur in epilepsy patients by comparing U-fibers, long range fibers, and inter-limbic fibers in 19 epilepsy patients and 10 healthy controls. We hypothesized that epilepsy patients exhibit reduced counts of inhibitory U-fibers but increased counts of long range and inter-limbic fibers.Methods
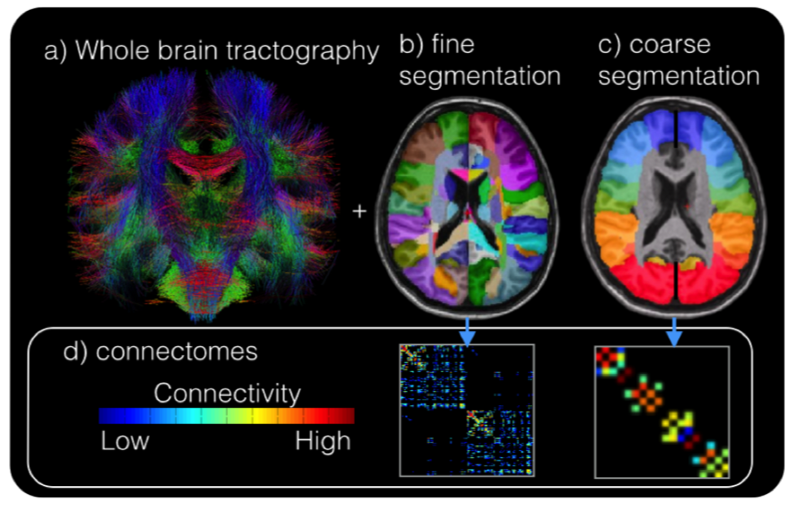
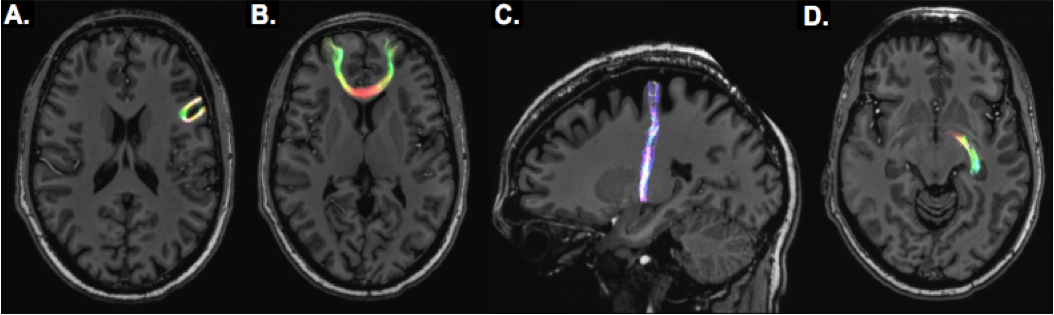
Eighteen epilepsy patients (17 MRI-negative for focal epilepsy) and 10 healthy control subjects were scanned under an IRB-approved protocol using a 7T whole body scanner (Siemens Magnetom). The scanning protocol included a T1-weighted MP2RAGE sequence (0.7 mm isotropic resolution) and high-angular-resolved diffusion-weighted dMRI (1.05 mm isotropic resolution, 68 directions). Diffusion-weighted images were corrected for distortions and registered to T1-weighted images. Cortical and subcortical segmentations were obtained using FreeSurfer software (http://freesurfer.net/). Wholebrain tractography (Figure 1a) was achieved using spherical deconvolution and the iFOD2 [4] algorithm and SIFT in MRTRIX3 to define 10,000,000 fibers. Structural connectivity matrices were calculated by counting tracks connecting each region in the FreeSurfer segmentation (Figure 1b). Because suspected SOZ in MRI-negative patients is often localized on a very gross scale (often by lobe), the structural connectivity matrix (Figure 1d) was collapsed onto a coarser segmentation (Figure 1c) consisting of the following 18 cortical regions (9 per hemisphere): Superior Frontal, Mid-Frontal, Inferior Frontal, Pre-central, Post-central, Superior Parietal, Temporal-Parietal, Temporal, and Occipital. Limbic regions were segmented as well: hippocampus, amygdala, nucleus accumbens, thalamus, caudate, putamen, and pallidum. Fibers connecting adjacent segmentations were classified as U-fibers, non-adjacent and cortico-limbic fibers were considered long-range, and fibers connecting limbic structures were inter-limbic (Figure 2). For epilepsy subjects, suspected SOZ (sSOZ) was determined by experienced neurologists. To compare connections in the sSOZ for each subject, regions in the sSOZ were grouped together and compared to non-implicated regions. Whole-brain connectivity was measured by quantifying the number of short-range and long-range streamlines associated with each brain region. For each subject, a z-score was calculated for every short-range, long-range, and inter-limbic fiber in the brain. Z-scores were then averaged across patients and controls. Significance was determined by a two-tailed t-test. Next, an sSOZ analysis was performed on the patient group. Z-scores for the 3 fiber types were calculated for each region of the brain and two-tailed t-tests were performed to compare the sSOZ z-scores to non-sSOZ z-scores.Results
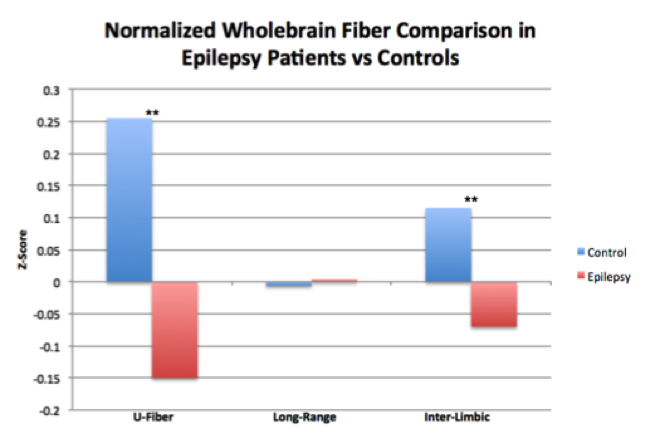
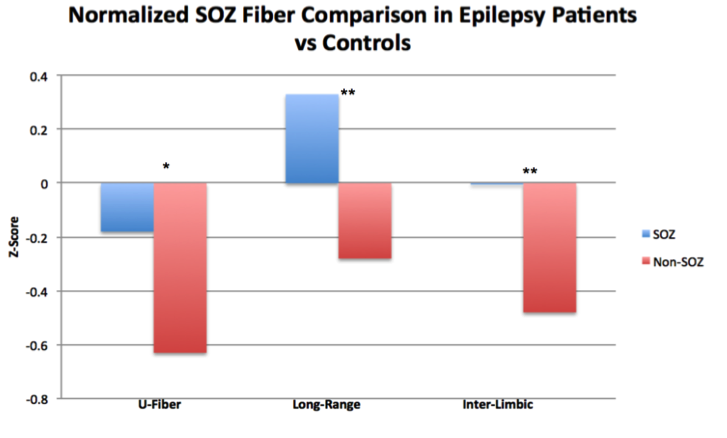
Wholebrain analysis revealed significant reductions of U-fibers in epileptic patients (t =4.95, p<0.001) and of inter-limbic fibers (t=4.77, p<0.001). While long range fibers were increased in patients, this finding was not significant (Figure 3). The sSOZ analysis confirmed that all 3 fiber types were increased in sSOZ nodes compared to non-sSOZ nodes (Figure 4). However, only the long-range fibers were higher in the sSOZ compared with the corresponding nodes in healthy controls.Discussion
This is the first study to compare wholebrain connectivity in MRI-negative focal epilepsy patients with healthy controls. In non-lesional epilepsy patients, U-fibers appear diminished throughout the entire brain. This is concordant with previous work suggesting short range inhibitory U-fibers could suppress seizure activity [1]. Inter-limbic fibers were also diminished throughout the brain in epilepsy patients, concordant with other studies showing damaged limbic axonal bundles in epilepsy patients [5]. The sSOZ analysis confirmed that all 3 fiber types were increased in the sSOZ nodes compared with non-implicated nodes. Interestingly, only SOZ long-range fibers are also increased compared with healthy controls. Increased long-range and inter-limbic connectivity of these nodes could contribute to seizure onset in the sSOZ and facilitate seizure propagation to subsequent nodes. Increased U-fibers in the sSOZ are somewhat contradictory to the initial hypothesis but they could reflect a mechanism for compensatory seizure suppression in the sSOZ. Our findings may have implications for diagnosing and treating patients with MRI-negative epilepsy, especially those refractory to pharmacological intervention. Future work will involve a subset analysis of patients with very localizable SOZs in an attempt to quantify SOZ connectivity on a more granular scale.Acknowledgements
NIH R00 NS070821
NIH R01 MH109544
Icahn School of Medicine Capital Campaign
Translational and Molecular Imaging Institute
References
1. O’Halloran, R., Feldman, R., Marcuse, L., Fields, M., Delman, B., Frangou, S., & Balchandani, P. (2017). A method for u-fiber quantification from 7 T diffusion-weighted MRI data tested in patients with nonlesional focal epilepsy. NeuroReport, 28(8), 457-461.
2. Rutland, J., Feldman, R., Marcuse, M., Fields, L., Delman, B., Balchandani, P. , O'Halloran, R. Hyper-connectivity of the Seizure Onset Zone: A Potential Epilepsy Biomarker at 7T. ISMRM 25th Scientific Meeting, Honolulu, Hawaii. April 2017; #6577.
3. Goc J, Hartl E, Noachtar S, et al. DTI Analysis of U-fibre density images localises the epileptogenic zone better than FA or MD. In Proceedings of Annual Meeting of OHBM 2016; p. 3166.
4. Tournier J, Calamante F, Connelly A. Improved probabilistic streamlines tractography by 2nd order integration over fibre orientation distributions. In: Proc. 18th Annual Meeting of the Intl. Soc. Mag. Reson. Med.(ISMRM) 2010. P.1670.
5. Bonilha, L., Nesland, T., Martz, G. U., Joseph, J. E., Spampinato, M. V., Edwards, J. C., & Tabesh, A. (2012). Medial temporal lobe epilepsy is associated with neuronal fibre loss and paradoxical increase in structural connectivity of limbic structures. Journal of Neurology, Neurosurgery & Psychiatry, 83(9), 903-909.
Figures