1030
The connectivity fingerprint of the fusiform gyrus predicts the Autism Observation Scale for Infants (AOSI) in Tuberous Sclerosis Complex1Radiology, Boston Children's Hospital, Harvard Medical School, Boston, MA, United States, 2Neurology, Boston Children's Hospital, Harvard Medical School, Boston, MA, United States, 3Pediatrics, Cincinnati Children's Hospital Medical Center, Cincinnati, OH, United States
Synopsis
Autism spectrum disorder is characterized by severe deficits in face processing. We achieved MR diffusion imaging of 27 infants (~2yo) with Tuberous Sclerosis Complex, a population at risk of autism, and assessed whether the structural connectivity fingerprint of their fusiform gyrus, a central region in face perception, can predict the Autism Observation Scale for Infants total score. We found that the diffusion tensor imaging connectivity fingerprint had poor prediction capabilities. In contrast, a diffusion compartment imaging, fixel-based fingerprint captured the structure of the abnormal connectivity in infants at risk of ASD and allowed in-sample prediction with a correlation of 0.97.
Introduction
Tuberous Sclerosis Complex (TSC) is a genetic disorder associated with a high prevalence of autism spectrum disorder (ASD) (up to 50% [1]). It is generally diagnosed within the first year of life [2] which makes it unique to study the early neural development of autism before neuropsychiatric symptoms become evident. A common hypothesis is that the development of ASD in TSC patients is a consequence of abnormal white-matter development and maturation. This is supported by numerous findings of aberrant axonal migration and hypomyelination in animal models of TSC [3] and by various diffusion MRI studies identifying white-matter abnormalities in patients with TSC and ASD [4]. Most studies to date, however, have focused on children, adolescents and adults. The development of biomarkers that allow early prediction of ASD is critical to 1) better understand the development of ASD and 2) administer therapies [5,6] when they are the most effective, i.e. early in life.
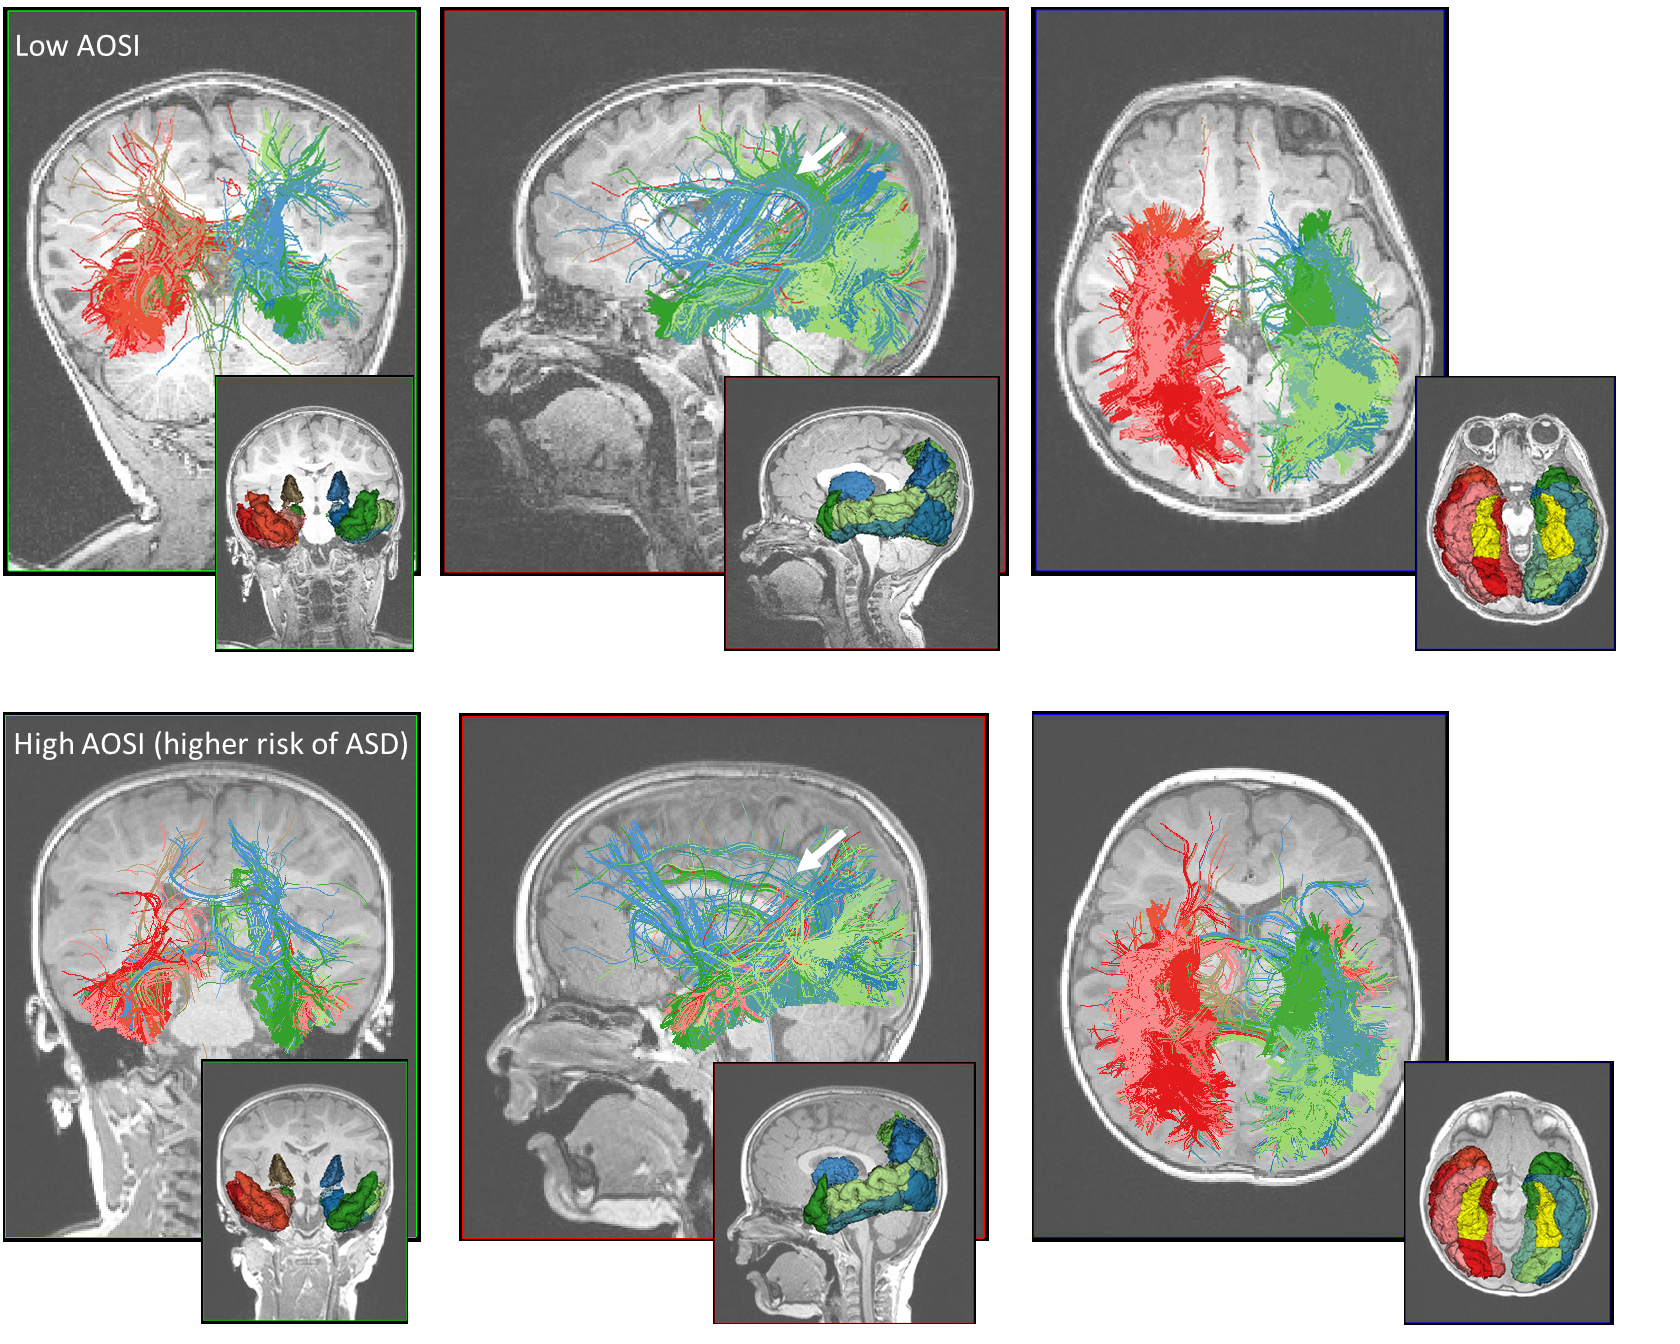
In this work we aimed to predict the Autism Observation Scale for Infants (AOSI) [7], a continuous behavioral measure of autism, from brain connectivity patterns derived from diffusion MRI at 2yo. Given the well documented deficit in face processing in ASD [8] we focused on assessing the connectivity patterns of the fusiform gyrus (FUSG), a key region in face perception [9]. Specifically, we computed its connectivity fingerprint [10] which describes how a structure is connected to all other structures in the brain. We evaluated the connectivity fingerprint derived from diffusion tensor imaging (DTI) [11] and from diffusion compartment imaging (DCI) [12] and tested whether they allow prediction of the AOSI total score.
Methods
Enrollment and imaging. This research was conducted under a prospective, ongoing, multisite TSC Autism Center for Excellence Network (TACERN) study. We included 27 infants scanned between 1.8-2.5yo (mean=2.1, std=0.16) who had their AOSI score assessed. 3T Brain MRI was acquired using routine clinical imaging for TSC extended with diffusion MRI with multiple non-zero b-values (90 gradients 500<b<3000s/mm2) and b=0 images with reversed phase-encoding directions for distortion compensation. All study procedures were approved by the Institutional Review Board.
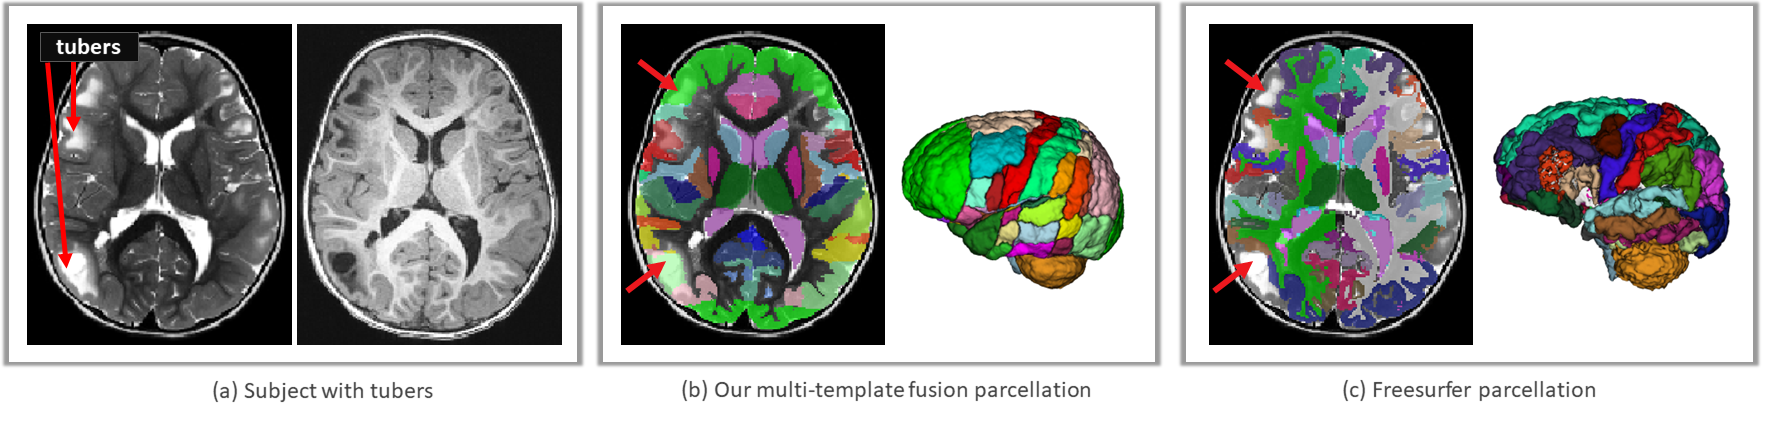
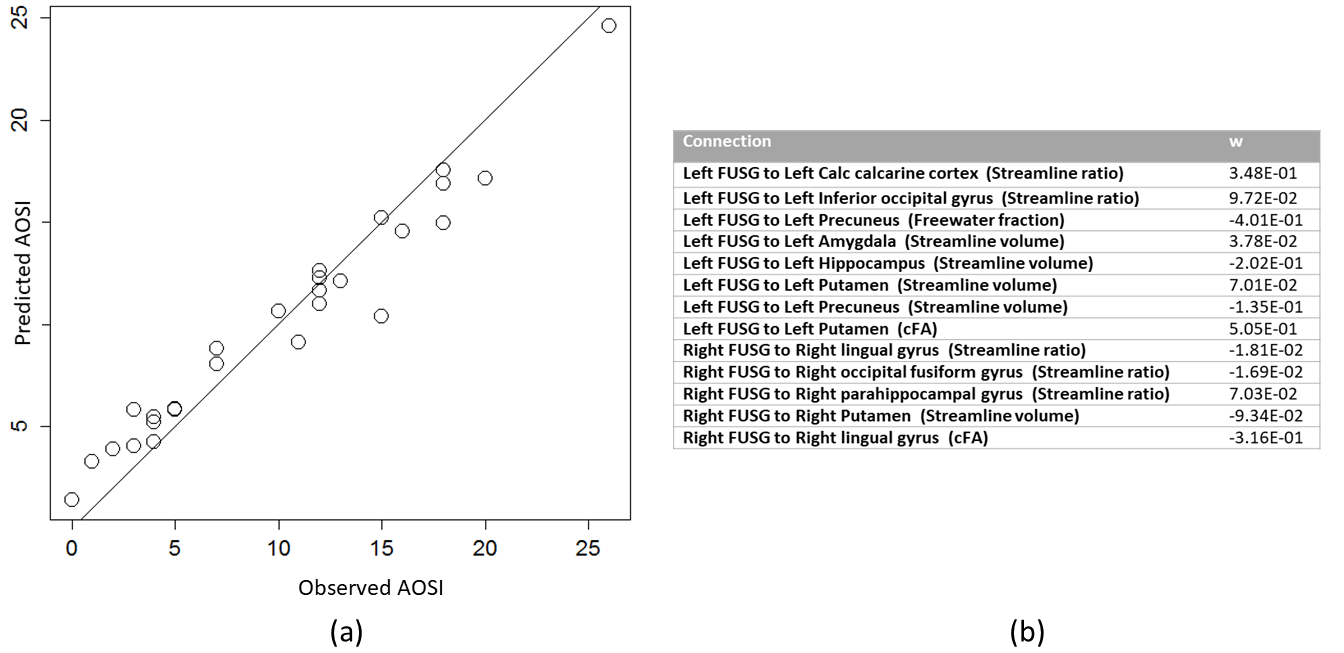
Connectivity fingerprint analysis. The DW images were corrected for distortion using topup and aligned to the 1x1x1mm3 T1-weighted MPRAGE. The intracranial cavity was segmented using [13] and the brain GM parcellated in 114 cortical and subcortical regions using a multiple-templates fusion approach more robust to brain lesions than Freesurfer (Fig.1). Diffusion compartment imaging (DCI) was computed at each voxel using [12]. DCI, unlike DTI, allows disentanglement of the free water component and of each fascicle in which voxel. This enables independent characterization of each fascicle in regions of crossings, also known as fixel-based analysis [14]. Whole brain single-peak (DTI) and multi-peak (DCI) tractography were performed. The fingerprint connectivity of FUSG was then computed by creating 113-sized vectors that synthetize how the left and right FUSG are connected to the 113 remaining brain parcels (Fig.2). The DCI fingerprint was built using four connectivity measures for each connection: the streamline ratio, the volume occupied by the streamlines (in mm3), the free water fraction and the compartment FA (cFA) along the streamlines. The DTI fingerprint included the streamline ratio, the streamline volume and the voxel-wise FA.
Statistical analysis. We focused on the larger connections by filtering the fingerprint vectors (Fig.2). The outcome AOSI total score and the connectivity parameters were standardized in order to remove scaling effect of the predictors. We developed prediction models using penalized linear regression modeling approach with LASSO and Elastic-net penalties. We used leave-one-out cross-validation to select the tuning parameters in each model, effectively estimating the amount of regularization from the data. We ultimately chose the model with smallest AIC and estimated the in-sample predictive performance using mean square error.
Results
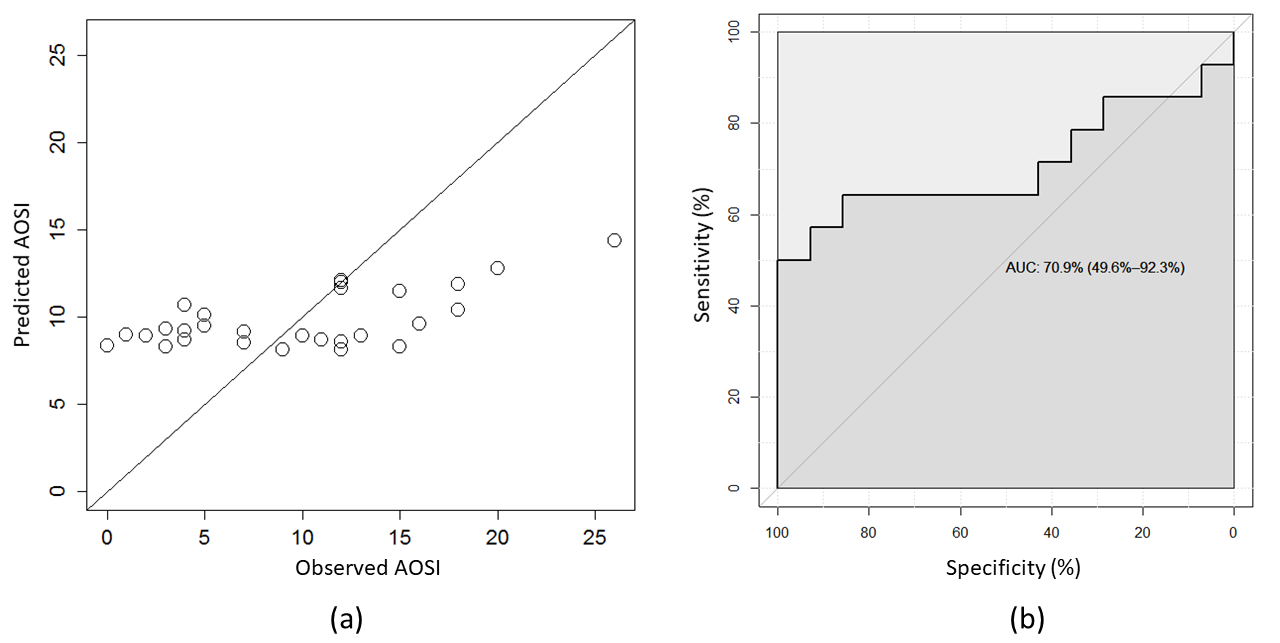
The connectivity fingerprint computed from DTI had poor score prediction capabilities (Fig.3). In contrast, the DCI connectivity fingerprint allowed direct, in-sample prediction of AOSI with a correlation of 0.97 (Fig4).Conclusion
The DCI fingerprint of FUSG (but not the DTI one) was able to capture the underlying structure of abnormal connectivity in infants at risk of ASD. This shows the improved specificity and sensitivity of the fixel-based DCI analysis, i.e. the benefits of separately characterizing fascicles and free water. More importantly, this shows that the AOSI can be predicted from neuroimaging data early in life.
Future work will focus on enrolling and imaging more subjects to increase sample size and evaluate the generalization capability of the approach (out-of-sample prediction). We will also evaluate whether the connectivity pattern of FUSG allows prediction of AOSI at an earlier age, before even any sign of autistic behavior are apparent through AOSI.
Acknowledgements
This investigation was supported in part by the National Institutes of Health (NIH) grants U01 NS082320, R01 NS 079788, R01 EB019483, R01 EB013248, U01 NS082320, U54 NS092090, and U54 HD090255. B. Scherrer was also supported by Boston Children's Hospital Translational Research Program / Innovator Award.References
1.Jeste, S.S., J.Y. Wu, D. Senturk, K. Varcin, J. Ko, B. McCarthy, C. Shimizu, K. Dies, V. Vogel-Farley, M. Sahin, and C.A. Nelson, 3rd, Early developmental trajectories associated with ASD in infants with tuberous sclerosis complex. Neurology, 2014. 83(2): p. 160-8.
2.Datta, A.N., C.D. Hahn, and M. Sahin, Clinical presentation and diagnosis of tuberous sclerosis complex in infancy. J Child Neurol, 2008. 23(3): p. 268-73.
3.Nie, D., A. Di Nardo, J.M. Han, H. Baharanyi, I. Kramvis, T. Huynh, S. Dabora, S. Codeluppi, P.P. Pandolfi, E.B. Pasquale, and M. Sahin, Tsc2-Rheb signaling regulates EphA-mediated axon guidance. Nat Neurosci, 2010.
4.Lewis, W.W., M. Sahin, B. Scherrer, J.M. Peters, R.O. Suarez, V.K. Vogel-Farley, S.S. Jeste, M.C. Gregas, S.P. Prabhu, C.A. Nelson, 3rd, and S.K. Warfield, Impaired Language Pathways in Tuberous Sclerosis Complex Patients with Autism Spectrum Disorders. Cereb Cortex, 2012.
5.Ehninger, D. and A.J. Silva, Rapamycin for treating Tuberous sclerosis and Autism spectrum disorders. Trends Mol Med, 2011. 17(2): p. 78-87.
6.Davis, P.E., J.M. Peters, D.A. Krueger, and M. Sahin, Tuberous Sclerosis: A New Frontier in Targeted Treatment of Autism. Neurotherapeutics, 2015. 12(3): p. 572-83.
7.Bryson, S.E., L. Zwaigenbaum, C. McDermott, V. Rombough, and J. Brian, The Autism Observation Scale for Infants: scale development and reliability data. J Autism Dev Disord, 2008. 38(4): p. 731-8.
8.Pelphrey, K., R. Adolphs, and J.P. Morris, Neuroanatomical substrates of social cognition dysfunction in autism. Ment Retard Dev Disabil Res Rev, 2004. 10(4): p. 259-71.
9.Kanwisher, N. and G. Yovel, The fusiform face area: a cortical region specialized for the perception of faces. Philos Trans R Soc Lond B Biol Sci, 2006. 361(1476): p. 2109-28.
10.Saygin, Z.M., D.E. Osher, K. Koldewyn, G. Reynolds, J.D. Gabrieli, and R.R. Saxe, Anatomical connectivity patterns predict face selectivity in the fusiform gyrus. Nat Neurosci, 2011. 15(2): p. 321-7.
11.Basser, P.J., J. Mattiello, and D. LeBihan, Estimation of the effective self-diffusion tensor from the NMR spin echo. J Magn Reson B, 1994. 103(3): p. 247-54.
12.Scherrer, B., A. Schwartzman, M. Taquet, M. Sahin, S.P. Prabhu, and S.K. Warfield, Characterizing brain tissue by assessment of the distribution of anisotropic microstructural environments in diffusion-compartment imaging (DIAMOND). Magn Reson Med, 2016. 76(3): p. 963-977.
13.Weisenfeld, N.I. and S.K. Warfield, Automatic segmentation of newborn brain MRI. Neuroimage, 2009. 47(2): p. 564-72.
14.Raffelt, D.A., R.E. Smith, G.R. Ridgway, J.D. Tournier, D.N. Vaughan, S. Rose, R. Henderson, and A. Connelly, Connectivity-based fixel enhancement: Whole-brain statistical analysis of diffusion MRI measures in the presence of crossing fibres. Neuroimage, 2015. 117: p. 40-55.
Figures