1029
Gaze Evoked Changes in Diffusion Characteristics of Human Optic Nerve1Biomedical Engineering, Stony Brook University, Stony Brook, NY, United States, 2Radiology, Stony Brook University Hospital, Stony Brook, NY, United States, 3Ophthalmology, Stony Brook University Hospital, Stony Brook, NY, United States
Synopsis
Disorders of the optic nerve (ON) are both life and sight threatening. Although disorders such as papilledema and ischemic optic neuropathy cause deformation of the peripapillary basement membrane layer, earlier pathological changes to the ON may occur further away from the eye. In this study a novel zoom-RESOLVE DTI method was developed for in vivo human ON imaging. Significant changes were observed in diffusion characteristics when comparing adduction, primary position and abduction. Gaze evoked changes in diffusion characteristics have the potential to assess diseases that affect the optic nerve before manifestation of ocular anatomical changes observed in OCT.
Introduction:
Several disorders affect the optic nerve (ON) that are potentially life- and sight threatening1. Disorders such as papilledema and ischemic optic neuropathy result in changes to the peripapillary basement membrane caused by ON abnormalities; changes are known to vary with eye position2. Diffusion tensor imaging (DTI) allows for non-invasive in vivo assessment of ON structural integrity3, which may provide useful information in the manifestation, progression and recovery of several disorders. This information may detect pathological changes earlier than established methods such as optical coherence tomography (OCT). In this study a novel zoom-RESOLVE DTI method was developed for in vivo human ON imaging. The capability and sensitivity of this method was demonstrated in this study to detect changes in the diffusion characteristics of the nerve during adduction, primary gaze and abduction.Methods:
Eight healthy participants were recruited for this IRB approved study on a Siemens Prisma 3T magnet using a single channel loop coil placed over the left eye. A novel zoom-RESOLVE DTI acquisition was developed to image the ON. Parallel transmission was utilized for 2D spatially-selective excitation pulse4 and standard Siemens RESOLVE was used for readout5. To reduce partial volume artifacts, diffusion-weighted images were acquired approximately perpendicular to the ON. The pulse sequence parameters were: FOV of 194×30mm2; in-plane resolution of 1.15×1.15mm2; 7 oblique coronal slices with thickness of 3 mm and 50% separation; TR/TE of 2200/66ms; readout segmentation factor of 7 with echo spacing of 0.3 ms; b-values of 0 and 800s/mm2. The total acquisition time was ~2 min for 20 diffusion directions. Each subject was imaged with visual fixation at three locations; primary position, ~20° abduction and ~20° adduction. Three repetitions were acquired at each gaze with ~30 sec rest between scans. Structural bSSFP images with 0.8 mm3 isotropic resolution were acquired at each visual fixation for planning of each DTI acquisition.
DTI data was processed using DSI studio (http://dsi-studio.labsolver.org) to calculate RD, AD and FA maps. ON regions of interest (ROIs) were manually drawn for each DTI acquisition using the average diffusion weighted image. To mitigate partial volume effects and CSF contamination, a FA threshold of 0.4 was used and any spurious voxels were removed to generate the ON mask used for AD, RD and FA quantification.
Results:
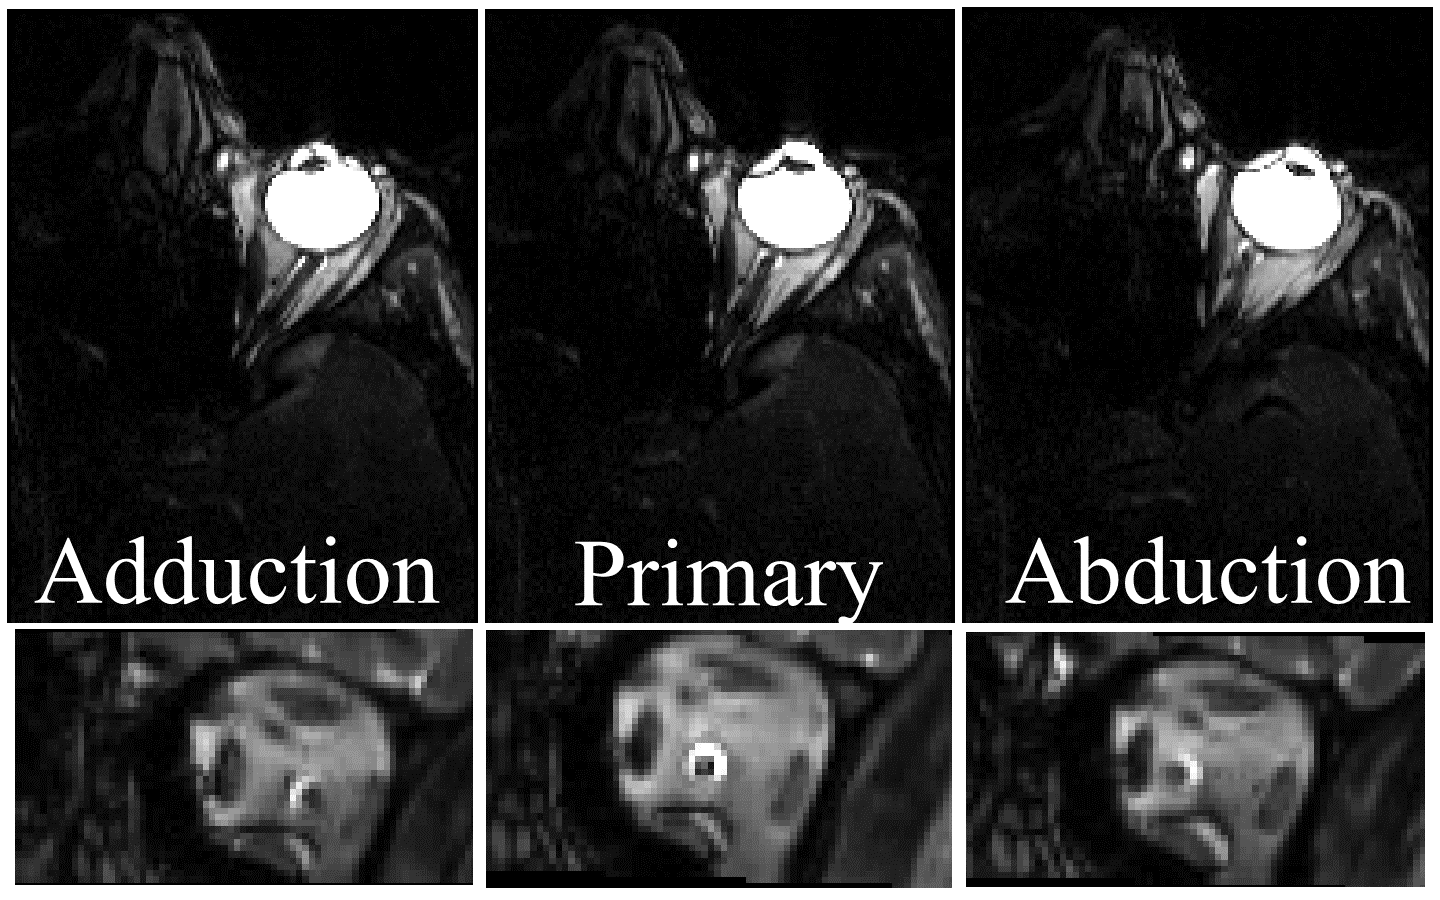
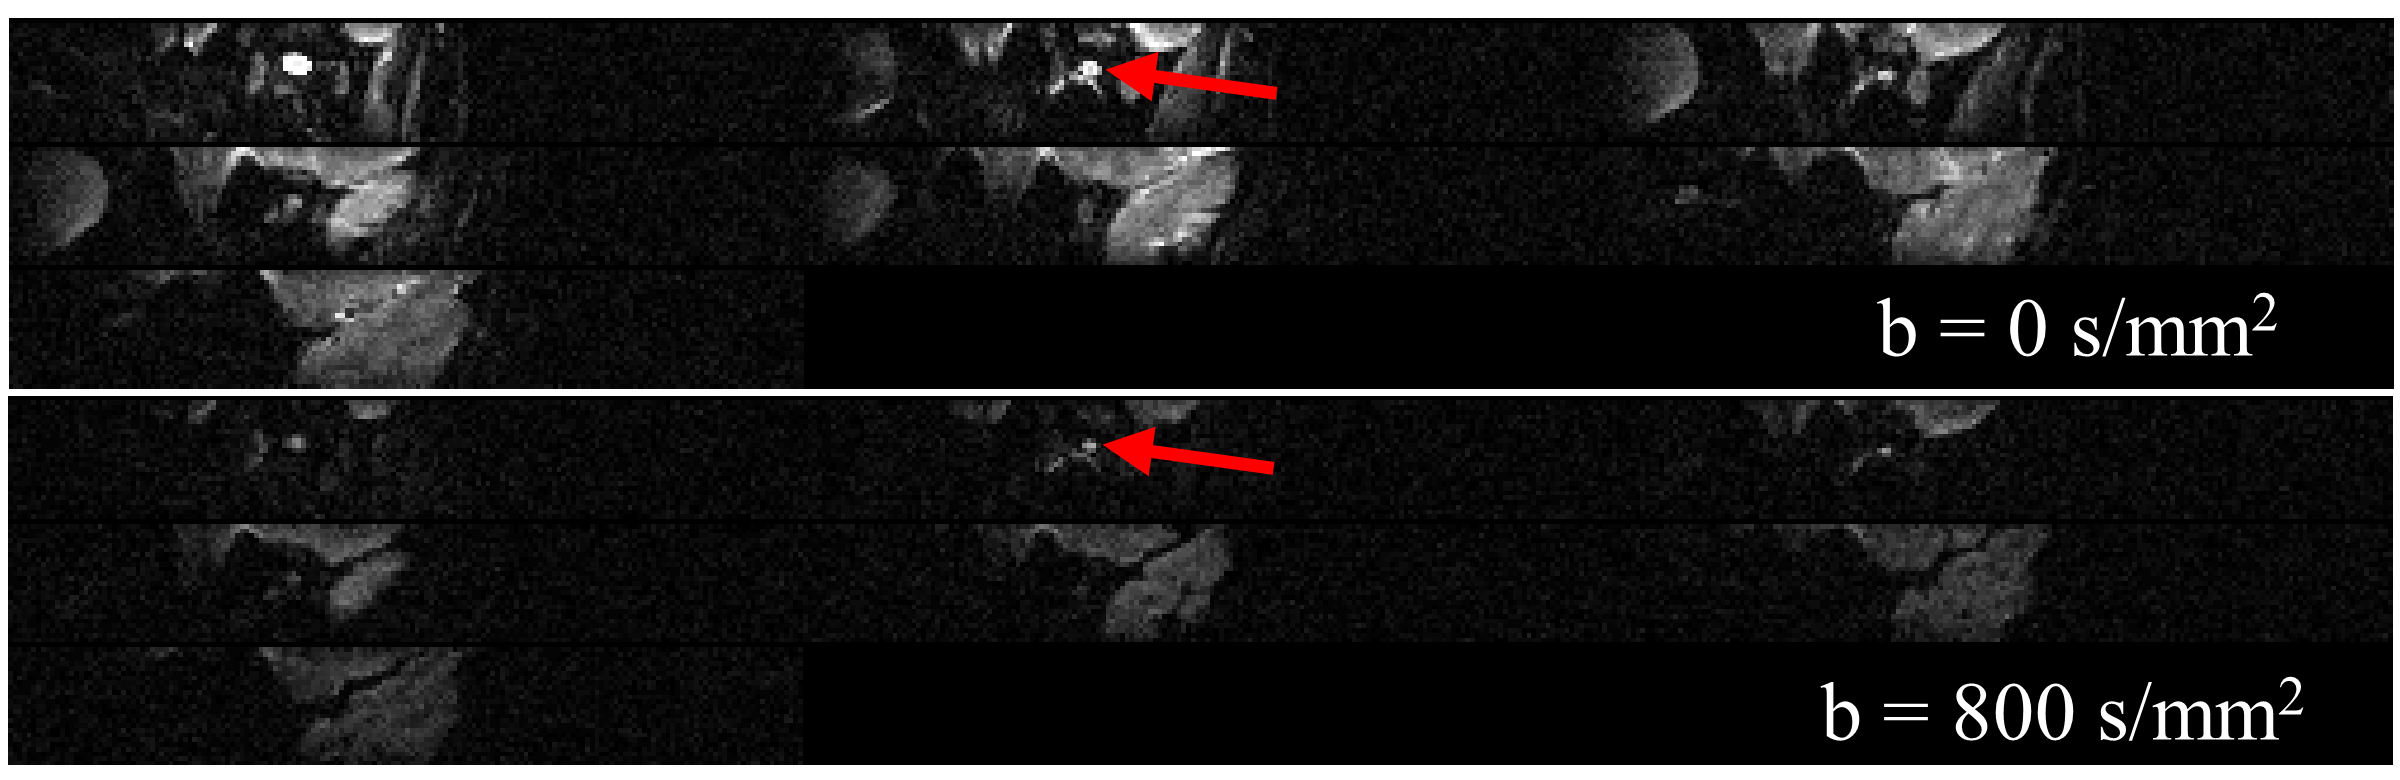
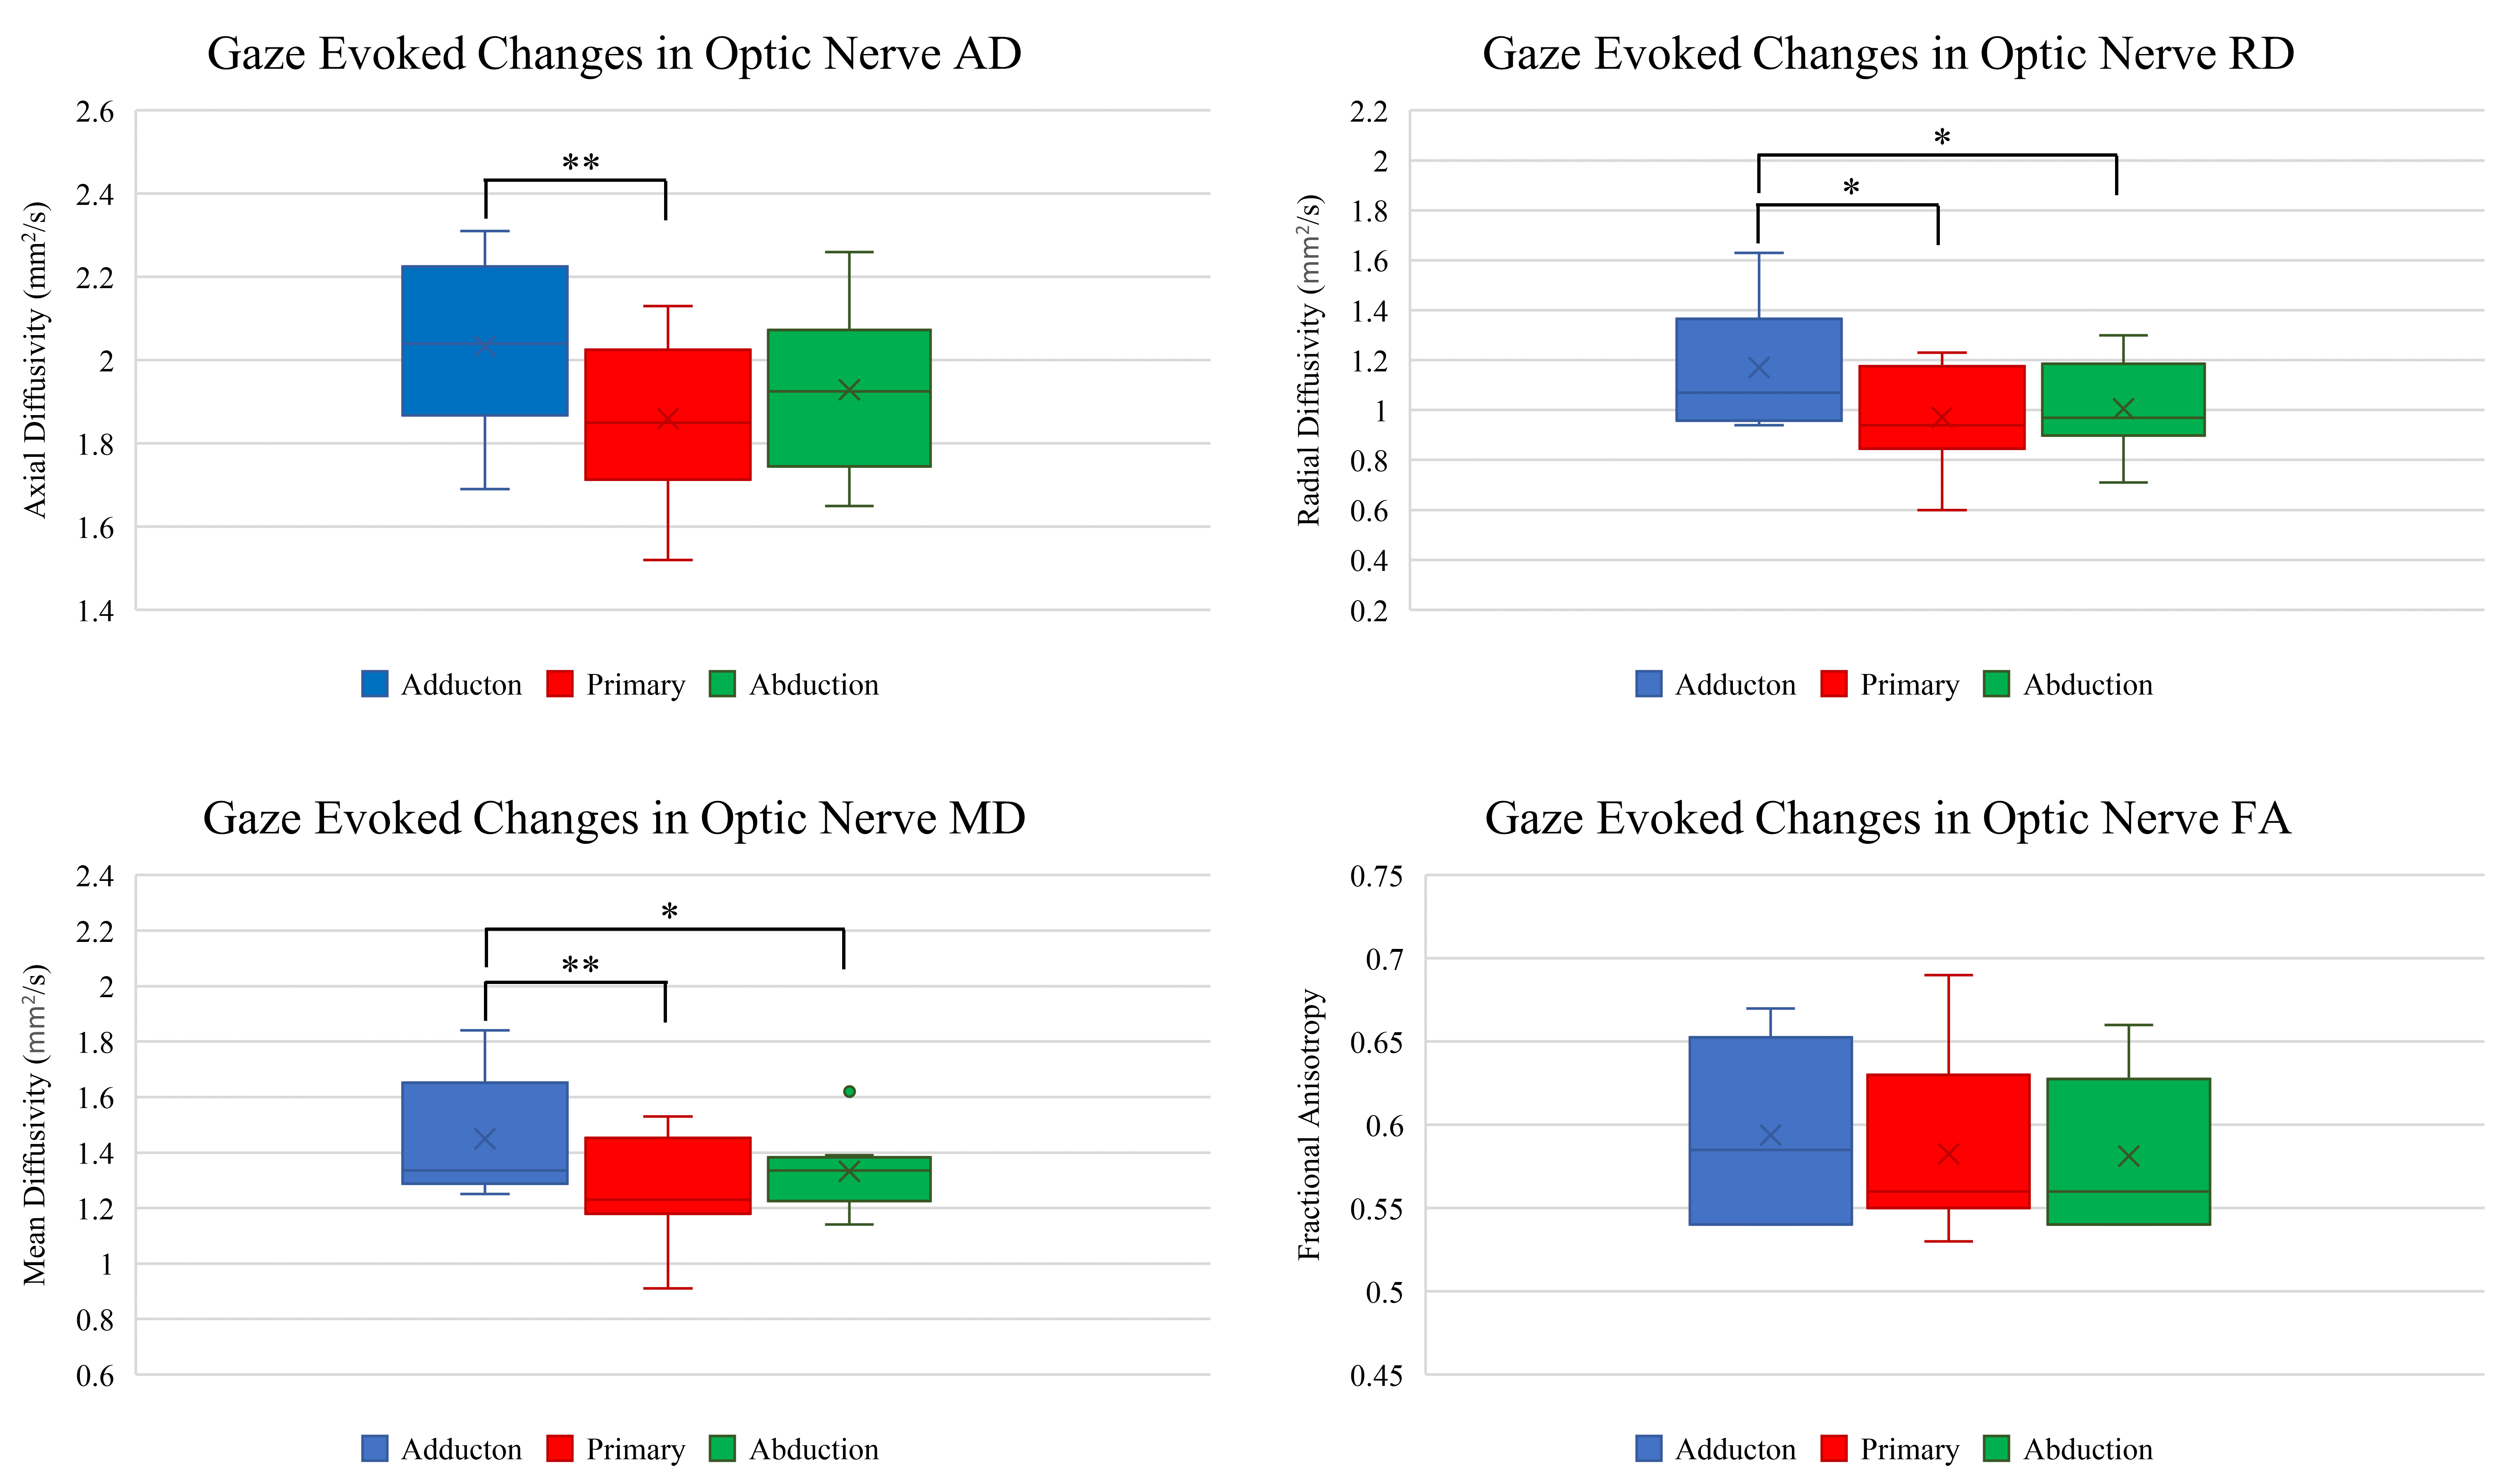
Figure 1 displays the bSSFP images of the ON at three gaze fixations for a representative subject. Adduction causes the ON to stretch while adduction causes the ON to compress into an “S” shape. The zoom-RESOLVE DTI images from a representative subject under primary gaze are shown in Fig. 2. CSF-induced hyperintensity surrounding the ON at b-value of 0 is suppressed at b value of 800s/mm2. Box plots of RD, AD, MD and FA values for all participants at three eye positions (adduction, primary and abduction) are displayed in Fig 3. Significant changes in ON diffusion characteristics were observed when comparing both adduction and abduction to primary position. Compared to primary, abduction resulted in 17.7%, 8.9%, 14.3% and 2.4% increases in RD, AD, MD and FA respectively. Adduction compared to primary position resulted in 6.2%, 4.6%, 9.0% and 0% increases in RD, AD, MD and FA respectively. Compared to abduction, adduction resulted in 10.9%, 4.0%, 4.9% and 2.4% increases in RD, AD, MD and FA respectively.Discussion:
To the best of our knowledge, this is the first in vivo assessment of gaze evoked changes in diffusion characteristics of the human ON. A robust investigation of ON diffusion was achieved with a novel zoom-RESOLVE DTI method. Compared with published human ON DTI studies acquired with axial orientation with slice thickness close to ON diameter, thus potential significant partial volume contamination, our DTI results demonstrated higher FA, lower AD and RD values6,7. Greatest changes in diffusion characteristics were observed in adduction. As demonstrated in Fig. 1, adduction causes the ON to stretch which may lead to greater coherence of fiber orientation (higher FA and AD), and reduced extracellular spacing and/or fiber diameter (higher RD). In contrast, the ON appears to be laxer in abduction which may explain the observed diffusion characteristics. Previous MRI of the ON suggested that the ON sheath is the principal load bearing structure in adduction8. This study suggests that some of this strain is also transferred to the ON itself.Conclusion:
A novel zoom-RESOLVE DTI method was used to investigate gaze evoked changes in ON DTI parameters. Gaze evoked changes in diffusion characteristics have the potential to assess diseases that affect the ON before manifestation of ocular anatomical changes observed in OCT.Acknowledgements
No acknowledgement found.References
1. Riordan-Eva P. Clinical assessment of optic nerve disorders. Eye. 2004;18(11):1161-1168.
2. Sibony PA. Gaze Evoked Deformations of the Peripapillary Retina in Papilledema and Ischemic Optic Neuropathy. Investigative Ophthalmology & Visual Science. 2016;57(11):4979-4987.
3. Basser PJ, Mattiello J, LeBihan D. MR diffusion tensor spectroscopy and imaging. Biophysical journal. 1994;66(1):259-267.
4. Rieseberg S, Frahm J, Finsterbusch J. Two‐dimensional spatially‐selective RF excitation pulses in echo‐planar imaging. Magnetic resonance in medicine. 2002;47(6):1186-1193.
5. Porter DA, Heidemann RM. High resolution diffusion‐weighted imaging using readout‐segmented echo‐planar imaging, parallel imaging and a two‐dimensional navigator‐based reacquisition. Magnetic resonance in medicine. 2009;62(2):468-475.
6. Gerlach DA, Marshall-Goebel K, Hasan KM, Kramer LA, Alperin N, Rittweger J. MRI-derived diffusion parameters in the human optic nerve and its surrounding sheath during head-down tilt. npj Microgravity. 2017;3(1):18.
7. Zhang Y, Guo X, Wang M, et al. Reduced field-of-view diffusion tensor imaging of the optic nerve in retinitis pigmentosa at 3T. American Journal of Neuroradiology. 2016;37(8):1510-1515.
8. Demer JL. Optic nerve sheath as a novel mechanical load on the globe in ocular ductionoptic nerve sheath constrains duction. Investigative ophthalmology & visual science. 2016;57(4):1826-1838.
Figures