1026
Quantitative Ultrashort Echo Time (UTE) Magnetic Resonance Imaging of Knee Osteoarthritis (OA)1University of California, San Diego, San Diego, CA, United States, 2VA San Diego Healthcare System, San Diego, CA, United States
Synopsis
In this study we aimed to develop a comprehensive quantitative UTE imaging package including UTE-Cones actual flip angle imaging (UTE-Cones-AFI) for accurate B1 mapping, UTE-Cones variable flip angle (UTE-Cones-VFA) for T1 mapping, 3D UTE-Cones-MT for MT modeling, UTE-Cones-AdiabT1rho for T1r mapping, and multi-echo UTE-Cones for T2* mapping. The techniques were evaluated on cadaveric human knee joints.
Introduction
Osteoarthritis (OA) is a “whole organ” disease involving multiple joint tissues, many of which including deep cartilage, menisci, ligaments, tendons and bone have short T2 and are “invisible” with conventional MR imaging sequences. Extensive research in OA has focused on two particular biomarkers: T2 and T1rho which are both sensitive to the magic angle effect 1-3. Two novel approaches, magnetization transfer (MT) imaging and signal modeling, and adiabatic inversion pulses based T1rho (AdiabT1rho), have recently been shown to be less sensitive to the magic angle effect 4. Meanwhile, ultrashort echo time (UTE) Cones sequences allow fast volumetric imaging of short T2 tissues 5. Therefore, the combination of the 3D UTE Cones sequence with MT (3D UTE-Cones-MT) and AdiabT1rho (3D UTE-Cones-AdiabT1rho) may be able to evaluate all major knee joint tissues with less sensitivity to fiber orientation 6,7. In this study we aimed to develop a comprehensive quantitative UTE imaging package including UTE-Cones actual flip angle imaging (UTE-Cones-AFI) for accurate B1 mapping 8, UTE-Cones variable flip angle (UTE-Cones-VFA) for T1 mapping, 3D UTE-Cones-MT for MT modeling, UTE-Cones-AdiabT1rho for T1rho mapping, and multi-echo UTE-Cones for T2* mapping. The techniques were evaluated on cadaveric human knee joints.Method
Six human knee joint samples from six donors (average age=52.5 y, 5 females and 1 male) were scanned on a clinical 3T MRI scanner (GE Healthcare) with an eight-channel knee coil for both signal transmission and receive. Clinical T2-weighted and PD-weighted images were used to identify osteoarthritis (OA) (Kellgren-Lawrence (KL) grade >1).
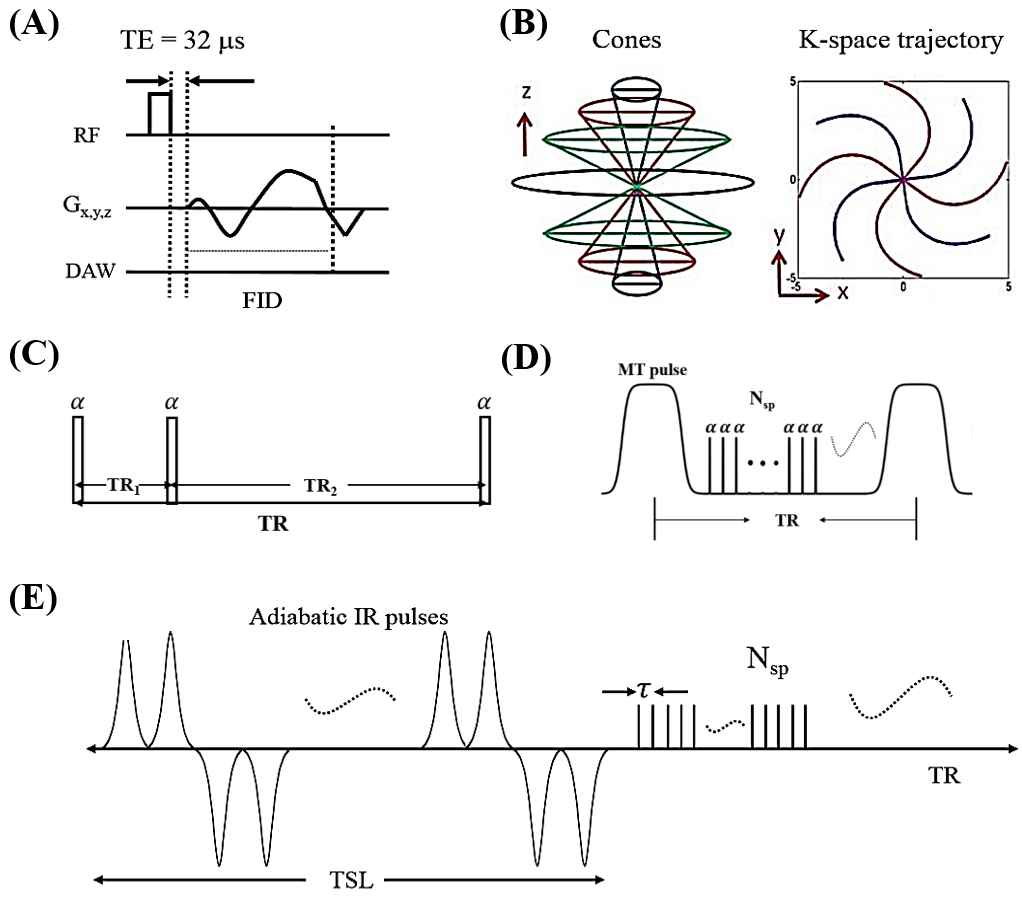
Quantitative MRI methods including CPMG-T2, UTE-Cones-MT modeling, UTE-Cones AdiabT1rho and UTE-Cones T2* were used to compare between the normal and OA groups. The conventional 3D UTE-Cones sequence (Figs. 1A and 1B) with a short rectangular pulse (duration of 26 to 52 µs) was used for non-selective signal excitation followed by 3D spiral trajectories with conical view ordering. 3D UTE-Cones-AFI was used for B1 mapping (Figs. 1C). The 3D UTE-Cones-MT (Figs. 1D) and UTE-Cones-AdiabT1rho (Figs. 1E) sequences were used for MT modeling and T1rho measurements, respectively.
The quantitative sequence parameters were shown as follows: A) 2D CMPG T2 measurement (TE=6.3, 12.7, 19.0, 25.4, 31.7, 38.0, 44.4, 50.8, 57.1, 63.4, 69.8, 76.1ms); B) 3D UTE-Cones-AFI: TR = 20/100 ms and flip angle = 45°; C) 3D UTE-Cones-VFA for T1 measurement: TR = 24 ms, flip angle = 4°, 8°, 16°, 24°, 32°; B) 3D UTE-Cones-MT with three saturation pulse powers (500°, 1000°, and 1500°) and five frequency offsets (2, 5, 10, 20 and 50 kHz), TR=102ms, flip angle=7°, number of spoke per-preparation (Nsp) = 9; C) 3D UTE-Cones-AdiabT1rho: spin-locking time (TSL) = 0, 6, 12, 24, 36, 48, 72 and 96 ms, TR=500ms, flip angle=10°, Nsp = 21; D) 3D UTE-Cones T2*: TE = 4, 8, 12, 16 and 20ms. Other imaging parameters included: FOV = 13×13×12 cm3, matrix=256×256×60. The measured B1 map will be used for both T1 and MT modeling correction. The derived T1 values were used for both MT modeling and AdiabT1rho calculation.
Results and Discussion
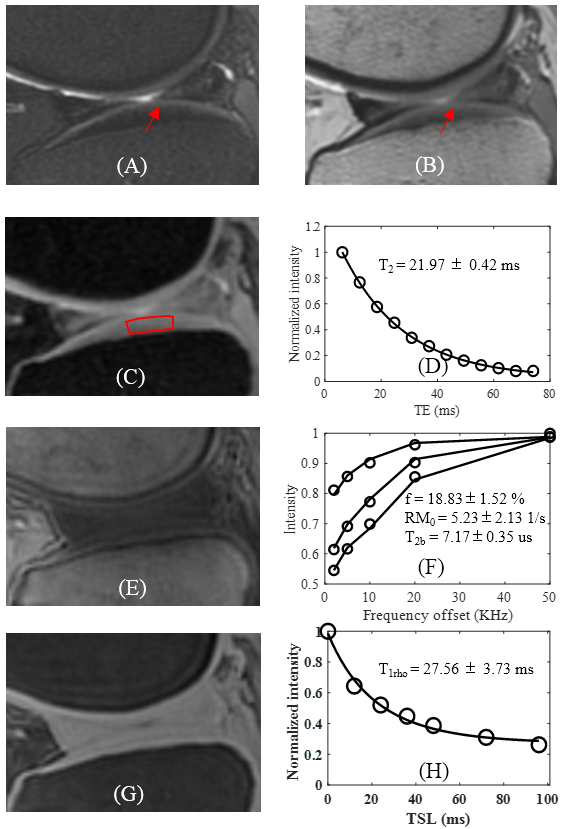
Figure 2 shows the quantitative results of a representative normal knee cartilage slice with T2 = 21.97±0.42 ms, T1rho= 27.56±3.73 ms and MT modeling: macromolecular proton fraction f = 18.83±1.52 %, proton exchange rate = 5.23±2.13 s-1 and macromolecular proton T2: T2b = 7.17±0.35 us.
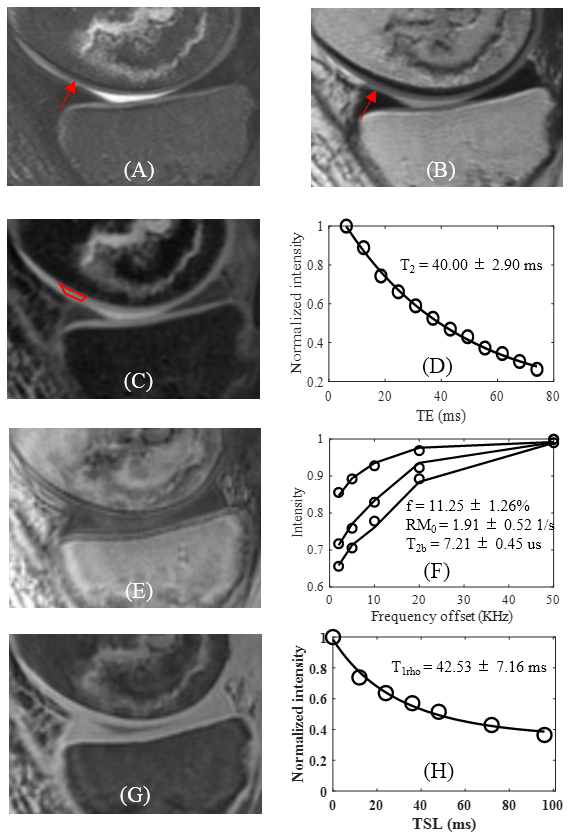
Figure 3 shows the quantitative results of a representative OA knee cartilage slice with T2 = 40.00±2.90 ms, T1rho= 42.53±7.16 ms and MT modeling: macromolecular proton fraction f = 11.25±1.26%, proton exchange rate = 1.91±0.52 s-1 and T2b = 7.21±0.45 us.
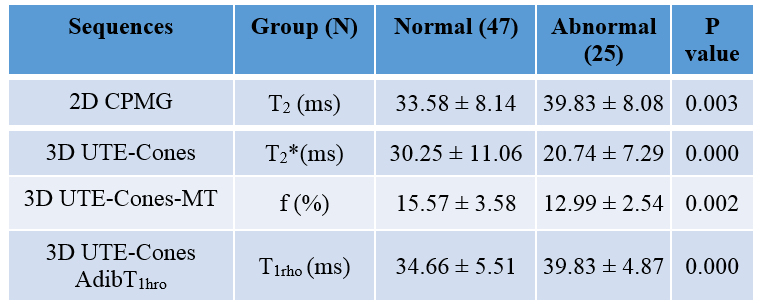
Table 1 summarizes the T2,T2*, f and T1rho values between normal and abnormal groups of knee slices of the six ex vivo knees. Significant increase in AdiabT1rho (P=0.002) and T2 (P=0.003) and decrease in T2* (P=0.000) and macromolecular fraction f (P=0.000) are observed for the abnormal group. The increase in AdiabT1rho and decrease in macromolecular fraction reflect the loss of proteoglycan and collagen in advanced OA. The decrease in T2* might be related to chondrocalcinosis, although further research is needed.
Conclusion
Both the 3D UTE-Cones MT modeling and UTE-Cones-AdiabT1rho biomarkers show significant differences between normal and OA knee slices.Acknowledgements
The authors acknowledge grant support from NIH (1R01 AR062581 and 1R01 AR068987), VA Clinical Science Research & Development Service (1I01CX001388), and GE Healthcare.References
1. Li X, Ma B, Link TM, et al. In vivo T1ρ and T2 mapping of articular cartilage in osteoarthritis of the knee using 3 T MRI. Osteoarthritis Cartilage 2007;15:789-797.
2. Du J, Statum S, Znamirowski R, Bydder GM, Chung CB. Ultrashort TE T1ρ magic angle imaging. Magn Reson Med 2013;1:69(3):682-7.
3. Shao H, Pauli C, Li S, Ma Y, Tadros AS, Kavanaugh A, Chang EY, Tang G, Du J. Magic angle efect plays a major role in both T1rho and T2 relaxation in articular cartilage. Osteoarthritis Cartilage 2017;doi:10.1016/j.joca.2017.01.013.
4. Hänninen N, Rautiainen J, Rieppo L, Saarakkala S, Nissi MJ. Orientation anisotropy of quantitative MRI relaxation parameters in ordered tissue. Scientific Reports 2017;doi: 10.1038/s41598-017-10053-2.
5. Carl M, Bydder GM, Du J. UTE imaging with simultaneous water and fat signal suppression using a time-efficient multispoke inversion recovery pulse sequence. Magn Reson Med 2016;76:577–582.
6. Ma YJ, Shao H, Du J, Chang EY. Ultrashort echo time magnetization transfer (UTE-MT) imaging and modeling: magic angle independent biomarkers of tissue properties. NMR Biomed. 2016;29(11):1546-52.
7. Ma YJ, Chang EY, Carl M, Du J. Quantitative magnetization transfer ultrashort echo time imaging using a time-efficient 3D multispoke Cones sequence. Magn Reson Med 2017;doi:10.1002/mrm.26716.
8. Ma Y, Lu X, Carl M, Zhu Y, Chang EY, Du J. Accurate T1 mapping for Short T2 Tissues using 3D Ultrashort Echo Time Cones Actual Flip Angle-Variable TR Method. ISMRM Workshop: Advanced Musculoskeletal MRI: Arthritis & Beyond 2017, Hangzhou, China.
Figures