1025
Musculoskeletal MR Fingerprinting with dictionary-based fat and water separation1Department of Physics, University of Pisa, Pisa, Italy, 2IMAGO7 Foundation, Pisa, Italy, 3Laboratory of Medical Physics and Magnetic Resonance, IRCCS Fondazione Stella Maris, Pisa, Italy, 4Department of Radiology, University of Cambridge, Cambridge, United Kingdom, 5GE Healthcare, Munich, Germany
Synopsis
The purpose of this work is to obtain quantitative MRI maps of fat and water with a fast acquisition using MR Fingerprinting (MRF). The major advantage of MRF is its intrinsic multicomponent quantification capability, which overcomes the limitations of traditional separation techniques. Previous methods using MRF have repeated the same acquisitions for multiple echo times in order to obtain fat fraction maps. Here, variable echo times within a single MRF acquisition are used, in order to estimate T1 and PD of water and fat. We demonstrate quantitative maps in 16s per slice and improved delineation of anatomy in human knees.
Introduction
In musculoskeletal MR imaging, robust fat/water separation methods are key to improve the conspicuity of important anatomy and pathology. Due to its short T1, fat appears brighter than water, hiding important anatomic details; moreover, fat-water chemical shift causes blurring which further degrades the quality of the images. In conventional imaging, several techniques to avoid these problems exist1-4. The aim of this work was to obtain separate fat and water T1 maps as well as a fat-fraction map within a Magnetic Resonance Fingerprinting (MRF) framework. Previous methods using MRF have repeated the same acquisitions for multiple echo times in order to obtain fat fraction maps5,6. Here, we use variable echo times within a single MRF acquisition in order to estimate T1 and PD of water and fat.Methods
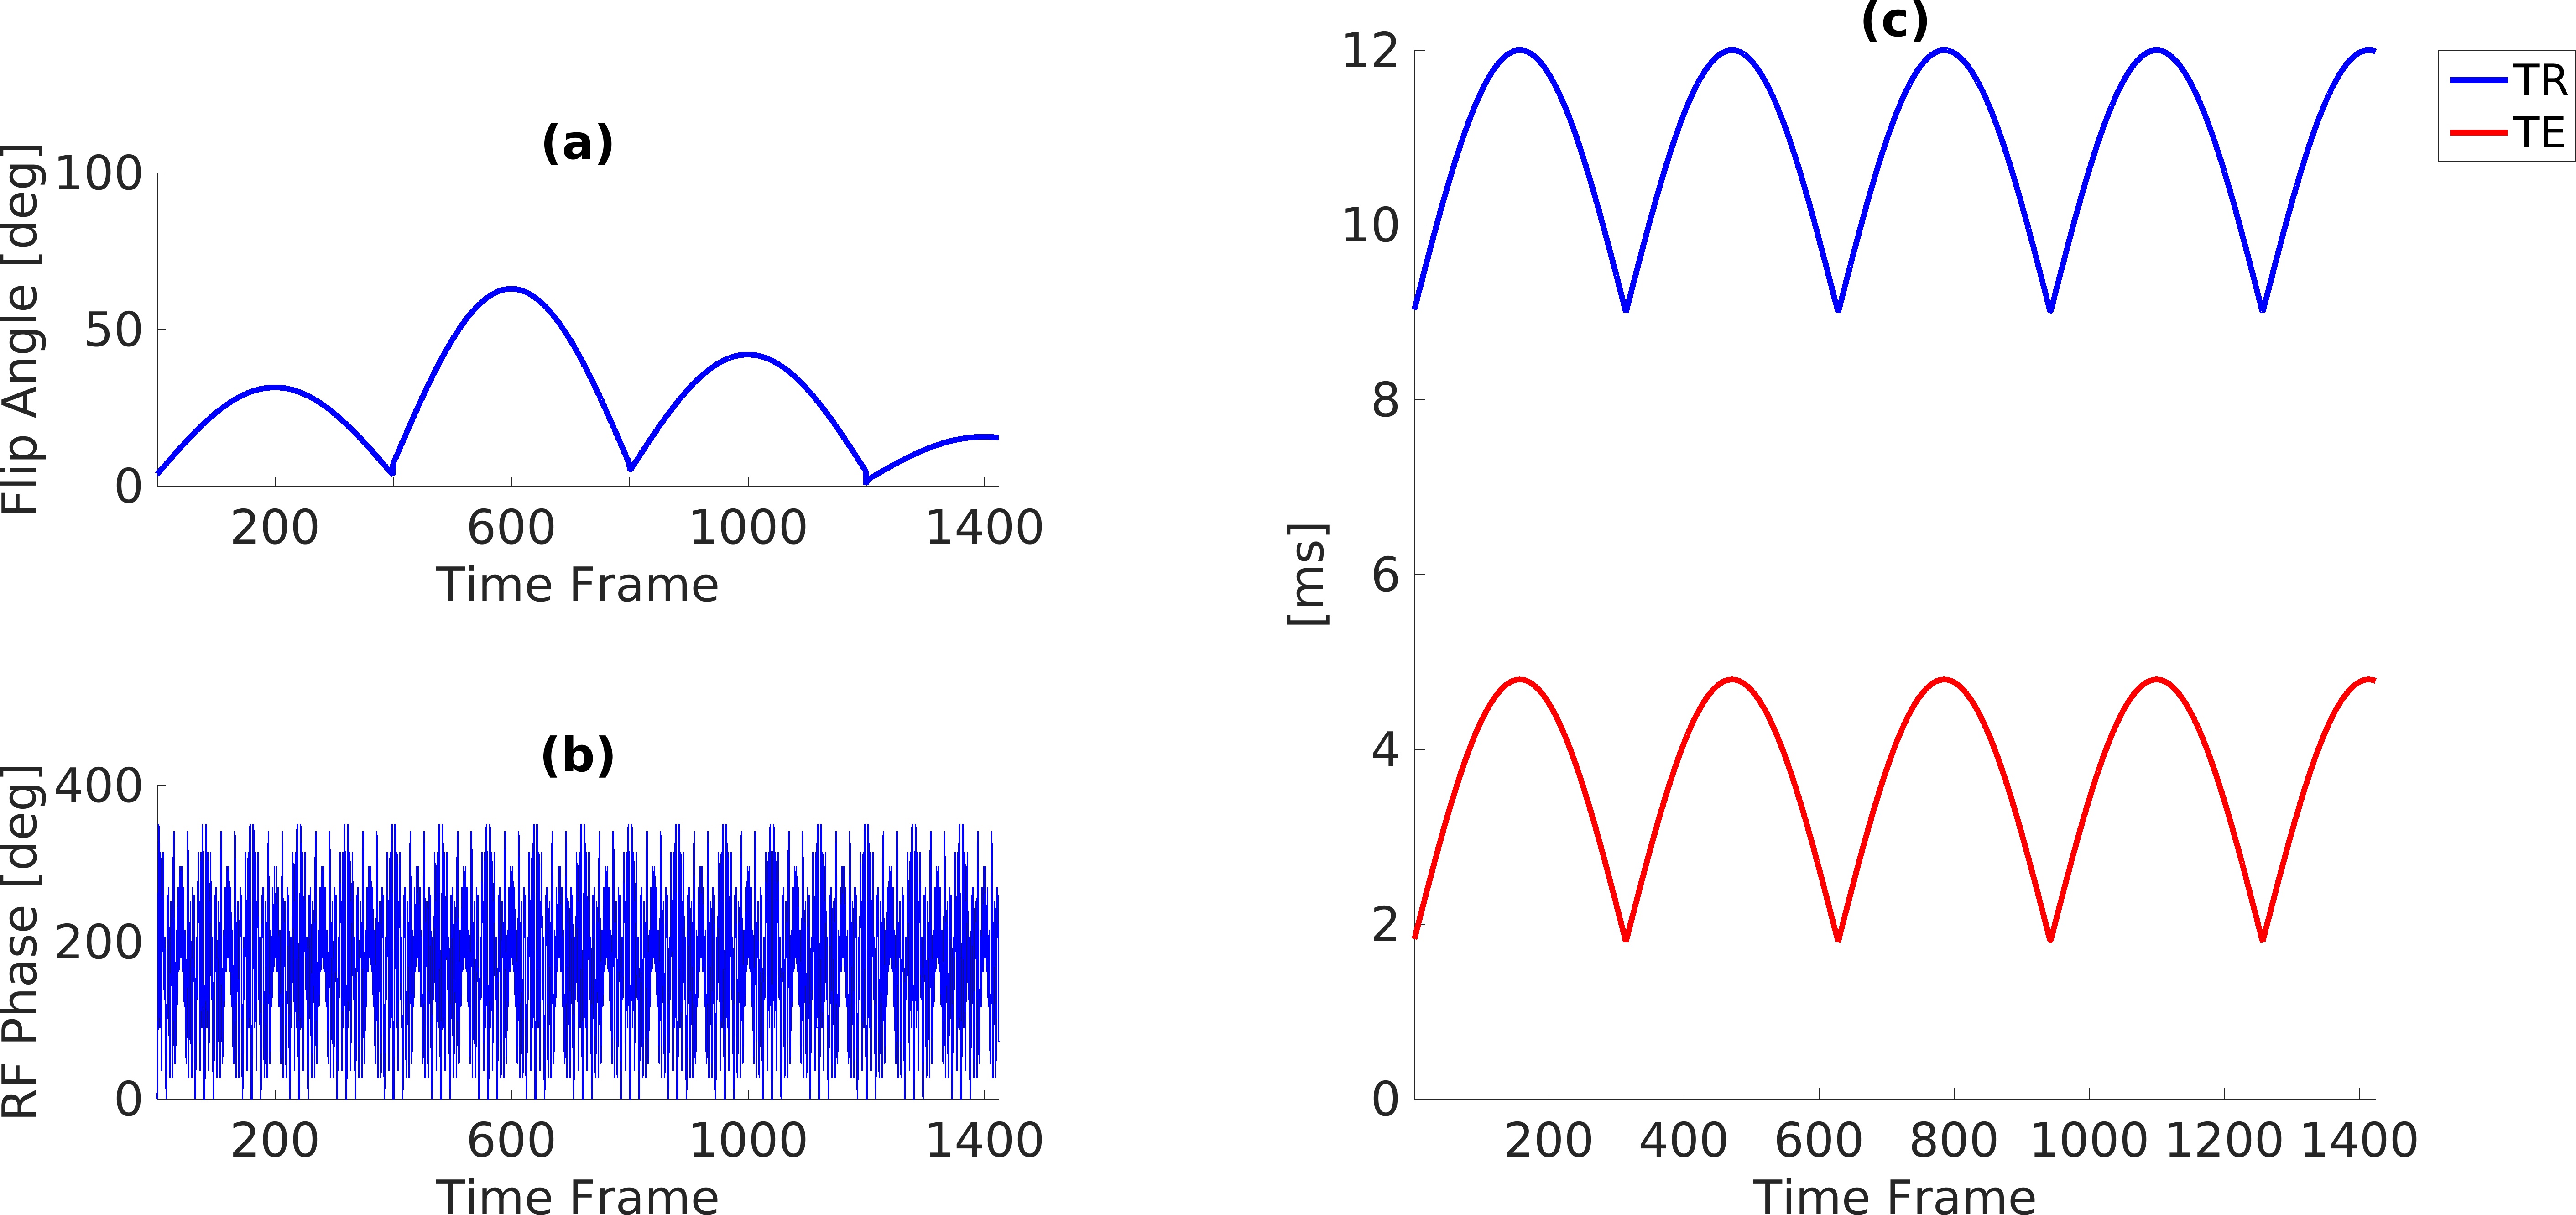
Acquisition All the acquisitions were performed on a GE HDxt 1.5T scanner, using an 8ch receiver coil for in-vitro acquisition and a quadrature transmit-receive birdcage coil for in-vivo knee acquisitions. Variable density spiral trajectories (FOV=22.5cm, matrix=192x192) with golden-angle rotation between each TR were used7. The sampling trajectories were followed by a spoiler gradient achieving an 8π dephasing across a 5mm slice. Acquisition schemes for our technique are shown in Figure 1. RF spoiling was included to reduce the T2 dependence of the signal, while a variable TR/TE pattern was used to sensitize the signal to the off-resonance shifts.
Dictionary Given a set of fat fraction values $$$f$$$, the dictionary for the dictionary-based fat/water separation (DBFW) method was created with a two-component model: $$$D = (1-f)D_w + f D_f$$$ , combining a pure water dictionary $$$D_w$$$ depending on water T1, B1 and B0 and a pure fat dictionary $$$D_f$$$ depending on fat T1, B1 and B0. B0 values for the fat dictionary were shifted by 220Hz. B1 values were scaling factors to the nominal flip angle. All the dictionaries were computed using Extended Phase Graphs formalism8. Randomized SVD with rank k=30 was used9. MRF maps were obtained by inner-product pattern matching method.
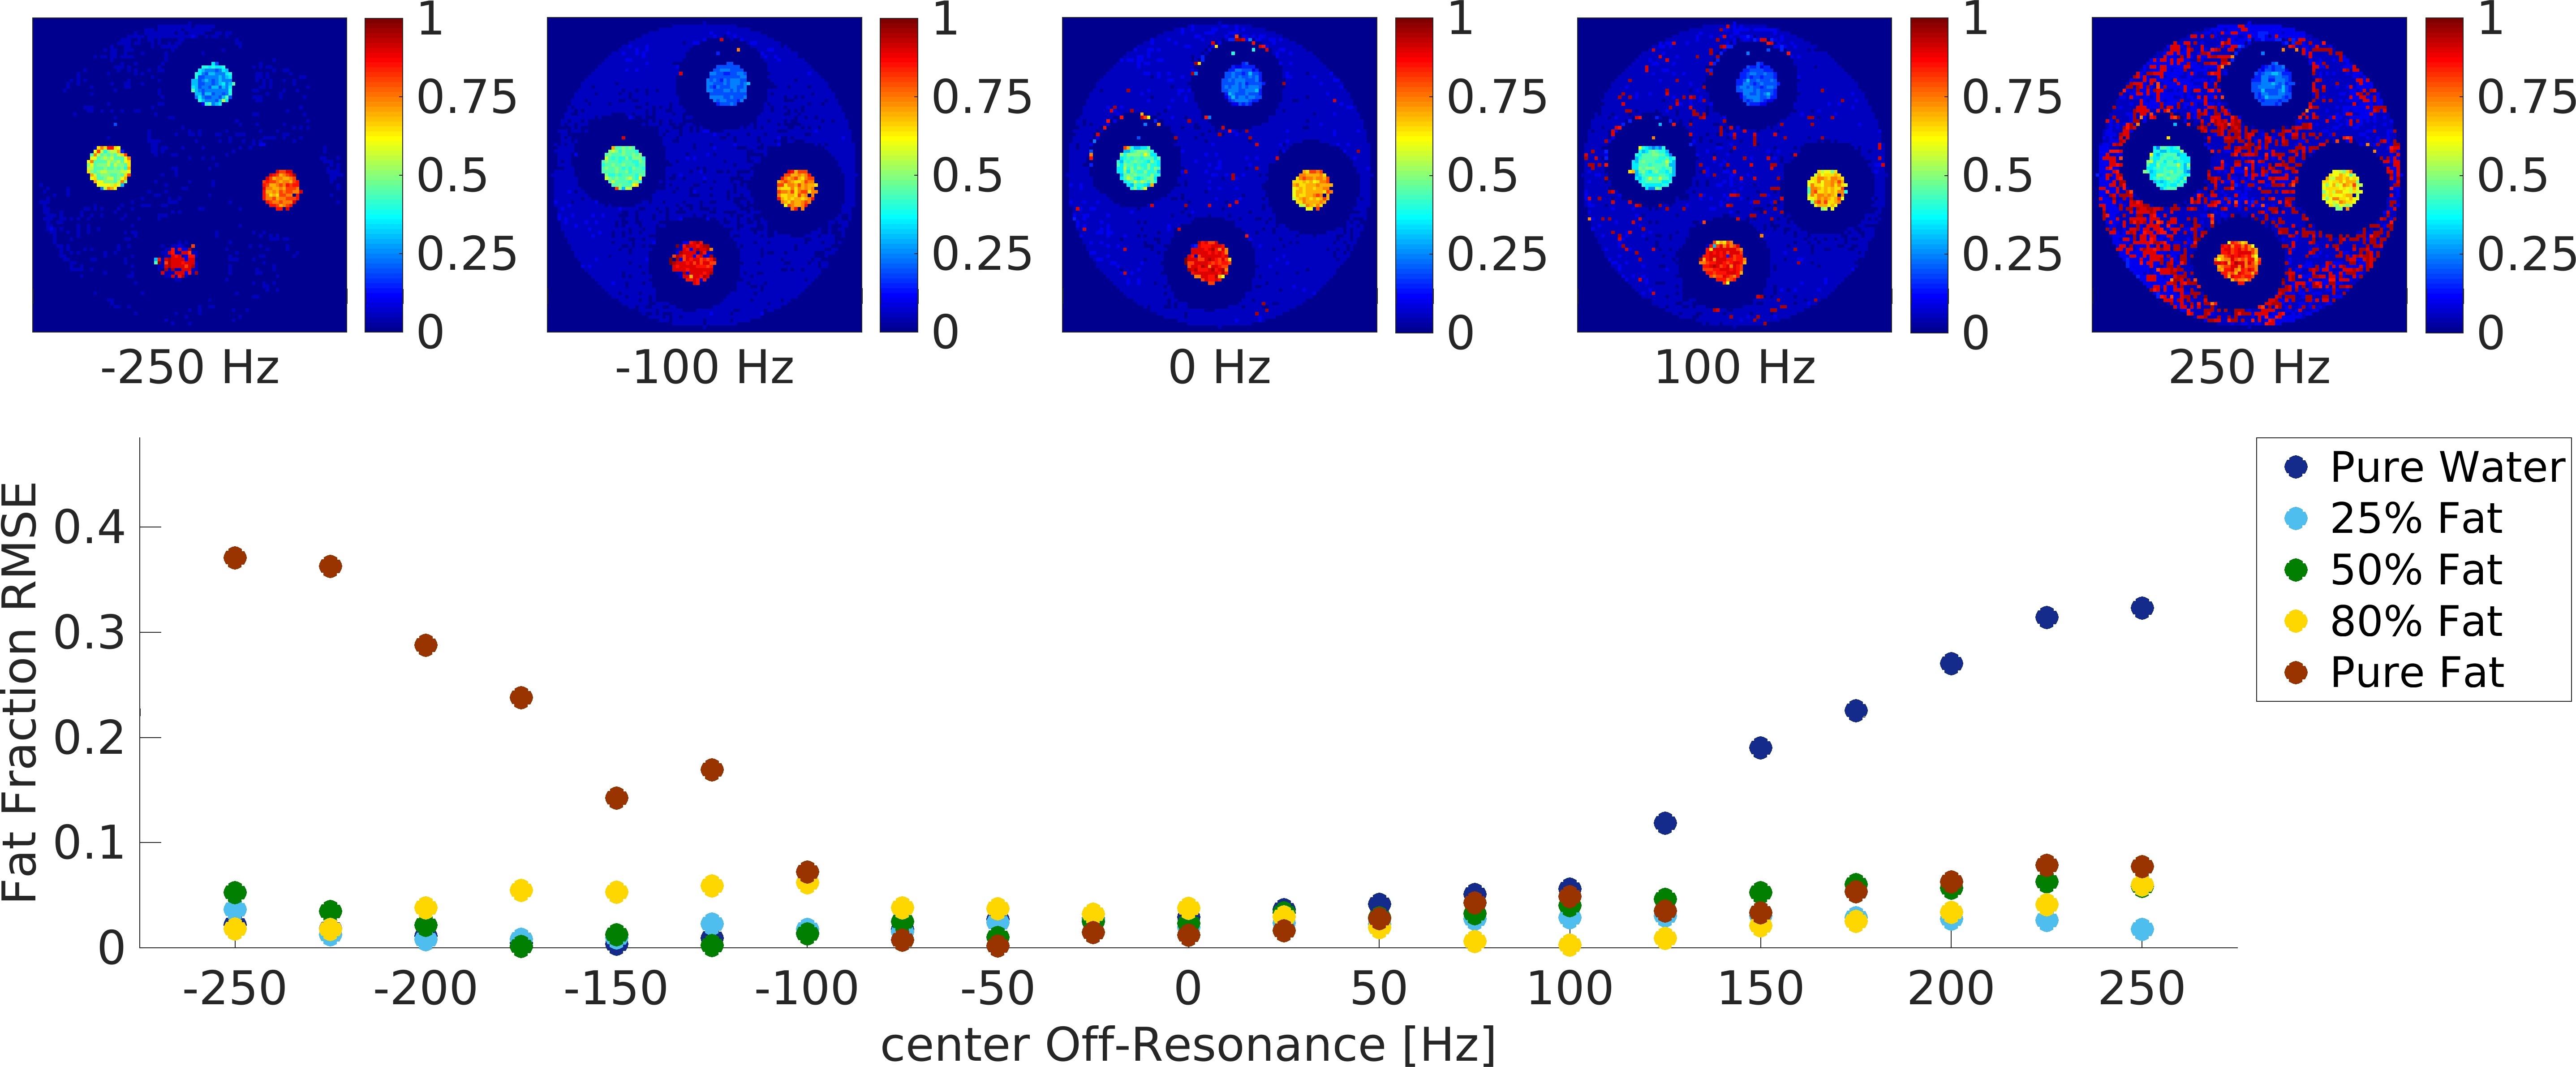
In vitro experiments A set of vials filled with different fat-water mixtures (0%, 25%, 50%, 80%, 100%) were scanned to test the fat-water separation capability of the technique. Fat-free vials with different concentrations of agar were included to verify the T1 quantification accuracy. The acquisition was repeated setting different central frequencies (± 250Hz) to assess its robustness in presence of field inhomogeneities. Reference values were based on three MRF datasets acquired with constant TR=15ms, TE=4.4/6.6/8.8ms and flip angle (FA) and radiofrequency (RF) phase pattern as shown in Figure 1a,b. Pure water and pure fat signal evolutions were obtained combining B0-corrected signals of the different TEs5. Each signal was matched to a separate fat or water dictionary.
In vivo experiments The knee joint of a healthy human volunteer was scanned to provide a performance assessment of the musculoskeletal imaging technique. Here, reference T1 values were obtained using a FISP MRF7 acquisition with no radiofrequency spoiling (FA pattern shown in Figure 1a, constant TR/TE=9/1.8ms). Reference B0 and fat fraction were obtained from three-point Dixon images acquired with spiral FISP with constant FA=5°, TR=15ms and TE=4.4/6.6/8.8ms.
Analysis We calculated the two-way mixed-average Intraclass Correlation Coefficient (ICC) for fat fraction and T1. To assess the robustness of the DBFW technique to off-resonance, the root-mean squared error (RMSE) of DBFW fat fraction values was calculated with respect to the Dixon values.
Results
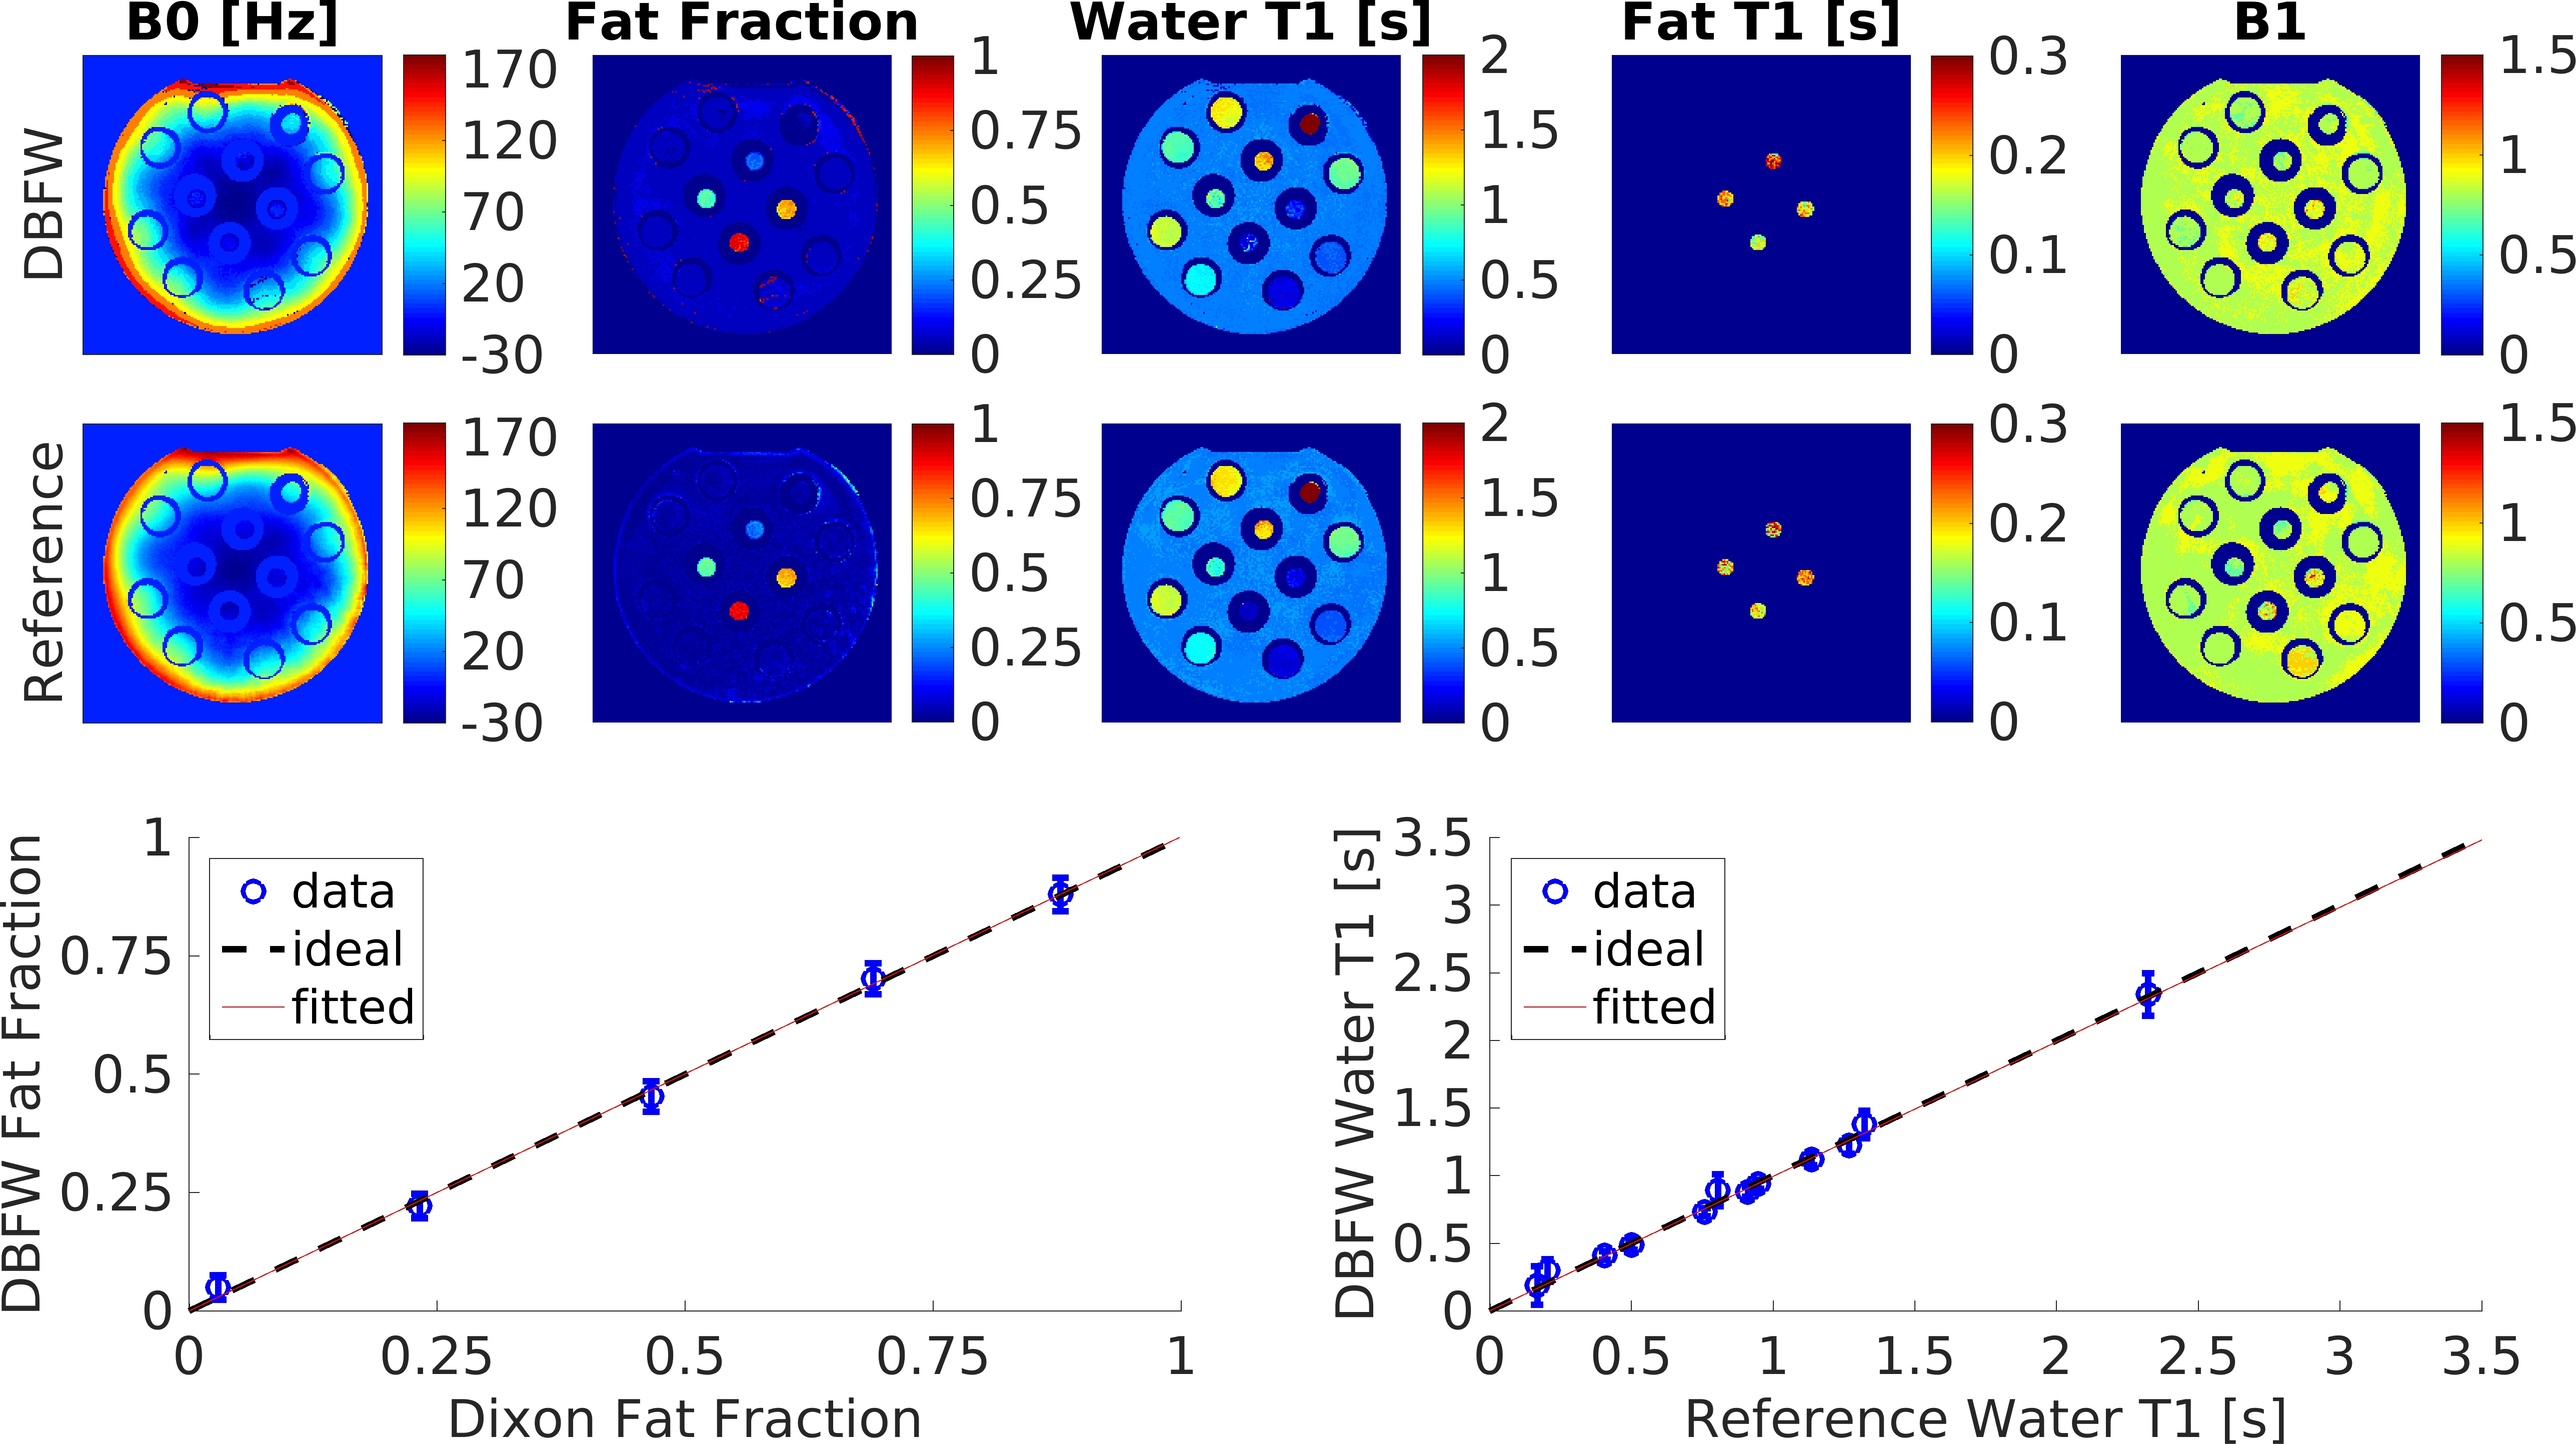
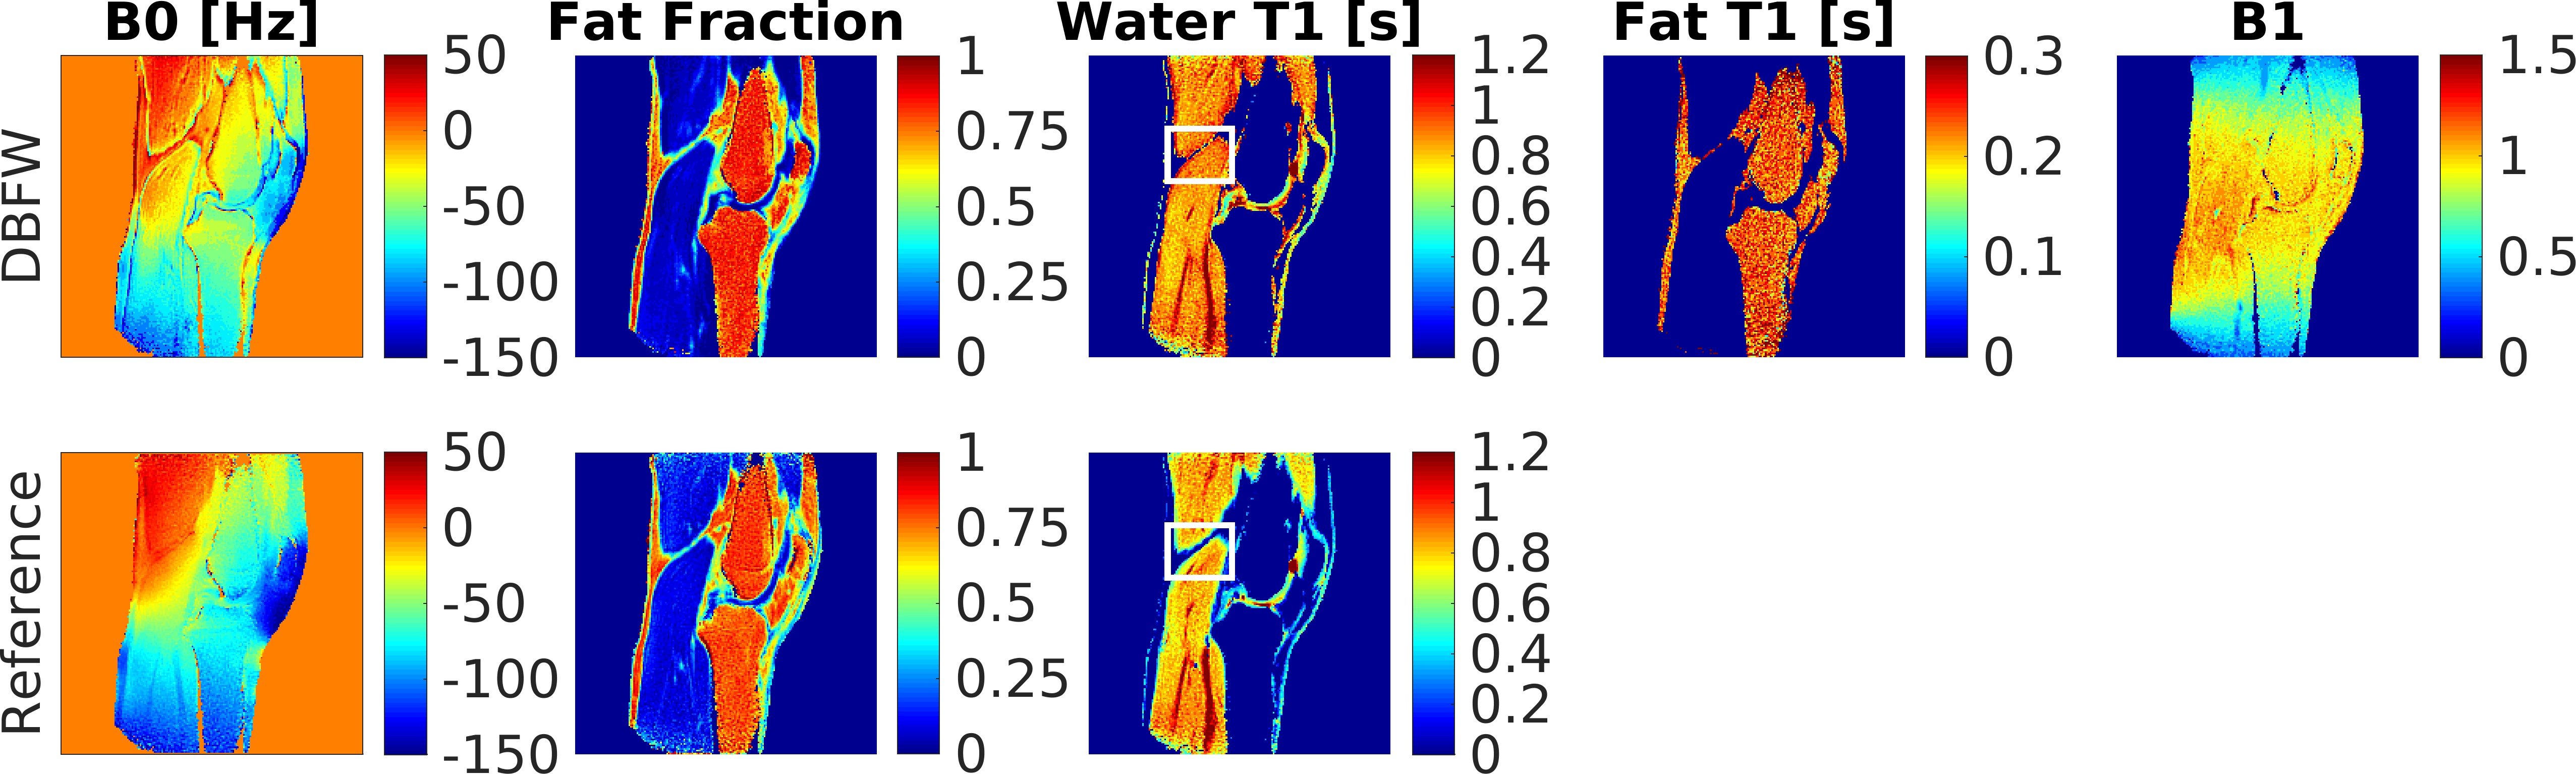
Acquisition time was 16s per slice using DBFW, compared to 13s for SSFP MRF and one minute when using three-point Dixon MRF. Figure 2 shows the good agreement between DBFW and Dixon MRF (ICC=0.99 for both fat fraction and T1). Figure 3 shows that the quantification is unbiased when the field inhomogeneities are less than half of the fat-water chemical shift. Figure 4 shows the in-vivo experiments. In addition to a good agreement with the reference techniques, DBFW technique provides sharper images with respect to standard FISP MRF.Discussion
The phantom experiment proved that the DBFW method successfully provides Fat Fraction and T1 maps in a reasonable scan time. The in-vivo experiment showed reduced blurring caused by fat chemical shift in water T1 map, when compared to standard FISP MRF. Moreover, the consistency of the B1 map suggest the potential extension of the method to higher field strengths.Conclusion
The technique here demonstrated can be used for fast and quantitative musculoskeletal imaging. Acquisition time was 3x faster compared to the corresponding MRF three-point Dixon acquisition. With respect to FISP MRF, our method achieves sharper delineation of anatomy due to the estimation and elimination of off-resonant fat signal.Acknowledgements
No acknowledgement found.References
1. Dixon, W. T. (1984). Simple proton spectroscopic imaging. Radiology, 153(1), 189-194.
2. Glover, G. H. and Schneider, E. (1991), Three-point dixon technique for true water/fat decomposition with B0 inhomogeneity correction. Magn. Reson. Med., 18: 371–383. doi:10.1002/mrm.1910180211
3. Haase, A., Frahm, J., Hanicke, W., & Matthaei, D. (1985). 1H NMR chemical shift selective (CHESS) imaging. Physics in medicine and biology, 30(4), 341.
4. Reeder, S. B., Pineda, A. R., Wen, Z., Shimakawa, A., Yu, H., Brittain, J. H., Gold, G. E., Beaulieu, C. H. and Pelc, N. J. (2005), Iterative decomposition of water and fat with echo asymmetry and least-squares estimation (IDEAL): Application with fast spin-echo imaging. Magn. Reson. Med., 54: 636–644. doi:10.1002/mrm.20624
5. Cloos MA, Knoll F, Zhao T, Block KT, Bruno M, Wiggins GC, et al. Multiparametric imaging with heterogeneous radiofrequency fields. Nat Commun 2016;7:12445. doi:10.1038/ncomms12445.
6. J. Ostenson, B.Welch, Fat Signal Fraction Determination Using MR Fingerprinting ISMRM 2017.
7. Jiang, Y., Ma, D., Seiberlich, N., Gulani, V., & Griswold, M. A. (2015). MR fingerprinting using fast imaging with steady state precession (FISP) with spiral readout. Magnetic resonance in medicine, 74(6), 1621-1631.
8. Weigel, M. (2015). Extended phase graphs: dephasing, RF pulses, and echoes‐pure and simple. Journal of Magnetic Resonance Imaging, 41(2), 266-295.
9. Yang, M., Ma, D., Jiang, Y., Hamilton, J., Seiberlich, N., Griswold, M. A. and McGivney, D. (2017), Low rank approximation methods for MR fingerprinting with large scale dictionaries. Magn. Reson. Med. doi:10.1002/mrm.26867
Figures