1023
Simultaneous quantification of T1, T2 and Apparent Diffusion Coefficient using Magnetic Resonance Fingerprinting based on Echo Planar Imaging1Computer Assisted Clinical Medicine, Heidelberg University, Mannheim, Germany, 2Electrical and Computer Engineering, University of Minnesota, Minneapolis, MN, United States, 3Center for Magnetic Resonance Research, University of Minnesota, Minneapolis, MN, United States, 4Heidelberg University, Mannheim, Germany
Synopsis
In this study we propose to integrate diffusion imaging into magnetic resonance fingerprinting, a method that has shown promise for time-efficient simultaneous quantification of multiple tissue parameters. The proposed sequence for quantitative T1, T2 and the apparent diffusion coefficient (ADC) is based on using Cartesian EPI readout. The contrast is generated using spin-echo EPI and gradient spoiling with diffusion gradients of varying moment and varying TR and TE. Joint T1, T2 and ADC parameter-maps acquired in phantoms are in good agreement with reference measurements and demonstrate high quality in-vivo maps, within a scan time of 28 seconds per slice.
Introduction
The apparent diffusion coefficient (ADC) is a standard imaging tool in clinical neurology, with particular importance for acute stroke and neurological disorders1. Magnetic resonance fingerprinting (MRF) has been introduced as a promising method for fast simultaneous quantification of multiple tissue parameters such as T1, T2 and T2* 2,3. First implementations have shown the possibility of integrating diffusion with MRF, though with prolonged measurement times4. In this study, we present a rapid sequence for acquiring T1, T2 and ADC maps with a volumetric MRF sequence based on spoiled echo planar imaging (EPI) readout, with spin-echo refocusing.Methods
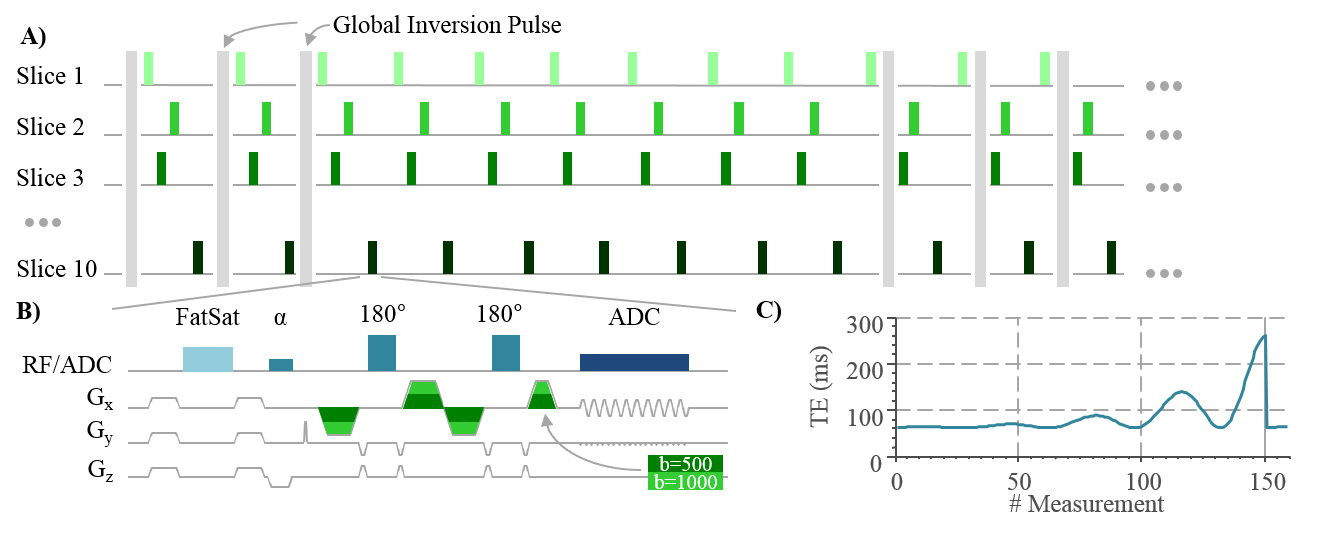
The proposed MRF sequence (Diff-MRF) is based on the slice-interleaved acquisition of a series of EPI images (Figure 1a). A total of 53 measurements are acquired, each consisting of three EPI-Diffusion readouts per slice with three different b-values (0/500/1000s/mm2). Global inversion pulses are applied every third measurement with varying time onset of relative to the slice-acquisition to increase T1 sensitivity of the sequence. Each EPI-Diffusion readout (Figure 1b) consists of a fat suppression with gradient spoiling, an excitation pulse, two refocusing pulses with bipolar diffusion gradients in readout direction followed by the EPI readout train. TE is varied throughout the measurement to foster T2 variation (Figure 1c), TR is minimized to shorten overall measurement time. The MRF dictionary was generated by simulating the evolution of the magnetization based on Bloch-equation simulations for a variety of T1, T2 and ADC values. Dictionary matching was performed by minimizing the inner product between the magnitude of the measured signal and the dictionary entries. To correct for flip angle errors and improve accuracy of the T1 and T2 maps, B1+ maps were acquired prior to the Diff-MRF measurement with the double angle method and integrated into the dictionary simulation. The proposed method was tested in phantom and in-vivo scans on a 3T scanner (Siemens Prisma) with a 64-channel head coil, with the following image parameters: interleaved-slices=10, TE/TR=62-262ms/1500-3370ms, flip angle=30°, voxel-size=1.9x1.9x5mm3, BW=1562Hz/pixel, partial-Fourier=5/8, parallel imaging factor=5 with GRAPPA reconstruction, reference lines=30, frames=159 per slice, total acquisition time=4:42min. The quantification accuracy of the Diff-MRF was validated in phantom experiments compared with an IR-TSE (TR=10s,TI=23-7440ms) for T1, a SE (TR=10s,TE=12-993ms) sequence for T2 and bipolar diffusion EPI sequence (b-values=0/500/1000s/mm2 in readout direction, 5 averages) for ADC maps. All reference measurement had the same voxel size and number of slices as the Diff-MRF. The phantom consisted of compartments doped with varying concentration of gadoterate-meglumine (Dotarem; Guerbet), sucrose and cupric sulfate.Results
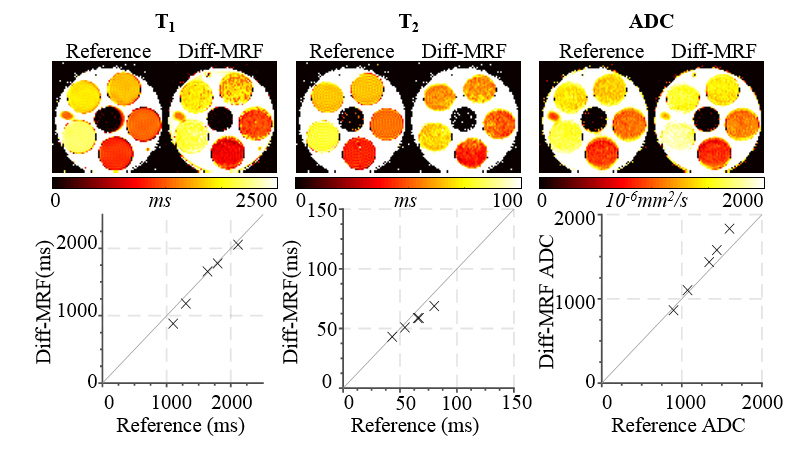
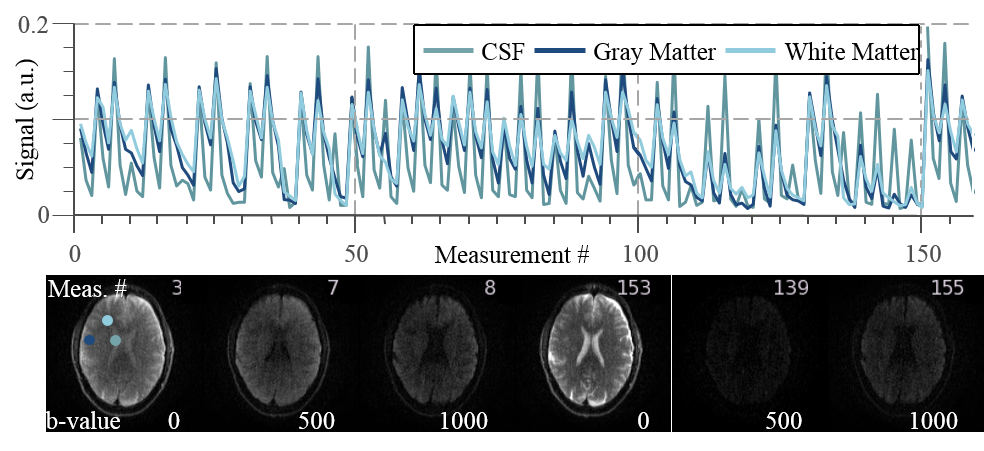
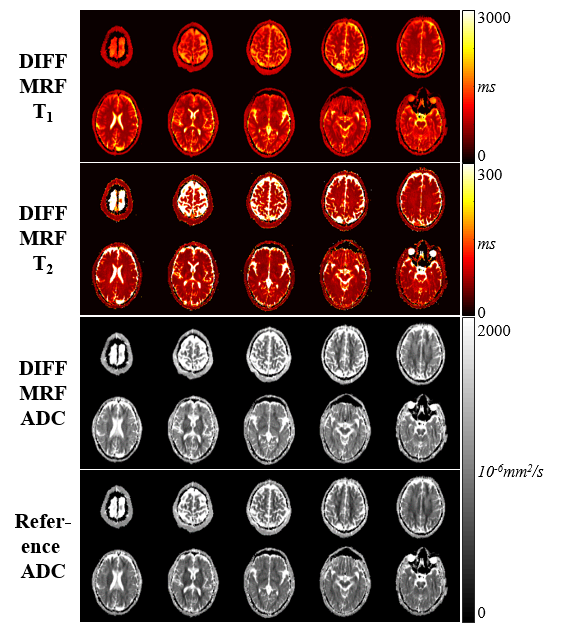
The Diff-MRF method yields homogeneous T1, T2 and ADC estimates within the phantoms (Figure 2) and quantitatively shows good agreement with the reference measurements (deviation: T1/T2/ADC: -6±8%/-8±6%/6±7%). Figure 3 shows exemplary fingerprints of three different tissues of a healthy subject volunteer with distinctly different signal paths. The baseline images depict the varying contrast through the measurement induced by the diffusion gradients, TE variations and the timing of the inversion pulses. Figure 4 shows maps of the 10 slices of the Diff-MRF and the reference diffusion in-vivo measurements. T1 and T2 maps show no visual artifacts, and offer high image quality. ADC maps of the Diff-MRF are visually comparable to the reference measurements, while quantitatively slightly overestimating (Diff-MRF / referemce: gray matter 2637/2263mm2/s, white matter 856/757mm2/s, CSF 1842/1368mm2/s ).Discussion
The proposed method for simultaneous T1, T2 and ADC quantification demonstrates high accuracy compared to reference measurements. Artifact-free parameter maps were acquired in-vivo within 4:42 minutes for 10 slices, resulting in an affective scan time of 28 second per slice. Using an EPI-based MRF design for the generation of ADC maps promotes comparability of these in clinical routine, as clinical diffusion imaging sequences are nearly exclusively based on EPI readout. Very high ADC and low T1 values are slightly over- and underestimated, respectively. This might be caused by an increased noise-floor due to the non-zero mean noise in the MRI magnitude images, inducing a bias when using inner-product minimization. This may be mitigated by integrating Rician noise characteristics in the matching procedure and will be the subject of future research.Conclusion
In this study we have shown the feasibility of combining diffusion imaging with MRF based on EPI readout. Simultaneous T1, T2 and ADC maps were acquired in phantoms and in-vivo within an effective scan time of 28 seconds per slice.Acknowledgements
No acknowledgement found.References
1. Bihan DL, Iima M. Diffusion Magnetic Resonance Imaging: What Water Tells Us about Biological Tissues. PLOS Biol. 2015;13:e1002203. doi: 10.1371/journal.pbio.1002203.
2. Ma D, Gulani V, Seiberlich N, Liu K, Sunshine JL, Duerk JL, Griswold MA. Magnetic resonance fingerprinting. Nature 2013;495:187–192. doi: 10.1038/nature11971.
3. Rieger B, Zimmer F, Zapp J, Weingärtner S, Schad LR. Magnetic resonance fingerprinting using echo-planar imaging: Joint quantification of T1 and T2∗ relaxation times. Magn. Reson. Med. 2016:n/a-n/a. doi: 10.1002/mrm.26561.
4. Jiang Y, Hamilton JI, Lo W-C, Wright KL, Ma D, Coristine AJ, Seiberlich N, Gulani V, Griswold MA. Simultaneous T1, T2 and Diffusion Quantification using Multiple Contrast Prepared Magnetic Resonance Fingerprinting. In: Proceeding 25th Annu Meet ISMRM. Hawaii, USA; p. 1171.
Figures