1016
Validating the detection of slow BOLD changes with multi-echo fMRI denoised data using simultaneous EEG1ETPB/NIMH, NIH, Bethesda, MD, United States, 2NINDS, NIH, Bethesda, MD, United States, 3NIMH, NIH, Bethesda, MD, United States, 4NIH, NIH, Bethesda, MD, United States, 5Mount Sinai, New York, NY, United States
Synopsis
In this study we use simultaneous electroencephalography (EEG) and multi-echo functional magnetic resonance imaging (ME-fMRI) to demonstrate the ability of ME-ICA denoising to resolve slow changes without need for baseline models. We use a visual flickering checkerboard with varying contrast to elicit a response measurable by fMRI and also EEG. We find that the ME-denoised data improves the fMRI timeseries correlation with the ideal task without removing the task signature that is shown to exist in the EEG data.
Introduction
Ultraslow fMRI fluctuations are often attributed to instrumental drift and because they are inseparable from BOLD changes in standard single echo fMRI they are therefore typically removed before further analysis in both resting-state and task paradigms (Smith,1999). However, some part of these fluctuations may be of neuronal origin, as neural activity can indeed fluctuate in the scale of several minutes or even longer, such as in after the administration of drugs (Wise,2004) or the ultradian rhythms (Horovitz, 2009). It has previously shown that it is possible to separate the slow BOLD and non-BOLD drifts using multi-echo (ME) fMRI and ME-ICA denoising (Evans,2015). Here we validate that the detected BOLD signals with simultaneously acquired electroencephalography (EEG). We used a continuously flickering checkerboard with slowly changing contrast to elicit steady-state visual evoked potentials (SSVEPs). This stimulus that provided a measurable response in both BOLD and EEG data. We show that the slow BOLD changes from this stimulus can be detected using ME-ICA denoised data and are in fact neural response as measured by the simultaneously acquired EEG signals.Methods
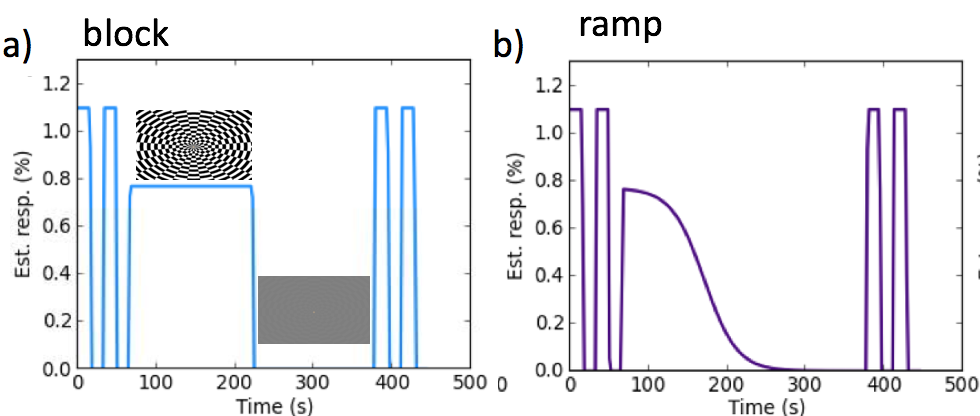
6 healthy subjects (2 male, ages 22-36) were scanned on a Siemens Skyra 3T scanner using a 20 channel coil with MPRAGE (res: 0.9mm) and multi-echo fMRI EPI scans (res: 3.5mm,TR 2 s, TEs: 14, 23,43 ms). EEG data was acquired using a 31-channel MR-compatible cap (BrainCap MR), with international 10/20 montage and one unipolar ECG and recorded using BrainVision Recorder (BrainProducts). A whole field flashing checkerboard reversing at 7.8 Hz with a central fixation cross was used with slow sigmoid varying contrast as illustrated in Figure 1. A 10 minute resting state scan with the subject fixating on a cross was also acquired.
The ME fMRI data was processed using ME-ICA (Kundu, 2012) and AFNI (Cox, 1996). The data was first preprocessed (despiking, slice timing correction, motion realignment, MNI 152 spatial normalization) and then passed to the ME-ICA algorithm where the BOLD and non-BOLD components are decomposed based on a test of linear TE-dependence. Removing all non TE-dependent components specifically removed non-BOLD drifts while preserving BOLD baseline signal changes. ME denoised data (medn) and standard preprocessed data (tsoc) were used in the analyses. The visual cortex region of interest (ROI) was defined as Brodmann areas 17 and 18 and used to generate average subject level timeseries of the stimulus response. Group level timeseries were calculated from the average of the subject responses. Spatial maps were calculated using the task regressors in Figure 1. No higher order detrending was applied for the medn BOLD components but first order detrending was used for the tsoc data (dtr_tsoc). Group maps were created for each task type (3dttest) and thresholded at family wise error corrected p<0.05.
EEG artifacts from MRI gradient switching and cardiac pulsation were removed by using a MATLAB-based toolbox (Liu,2009). The EEG signals were then lowpass filtered from 0.5 to 40 Hz and down-sampled to 250 Hz. A spectrogram of the cleaned EEG data was calculated and the power at the task frequency of 7.8 Hz was extracted and used for comparison with the fMRI timeseries in MNE python (Gramfort,2014).
Results and Discussion
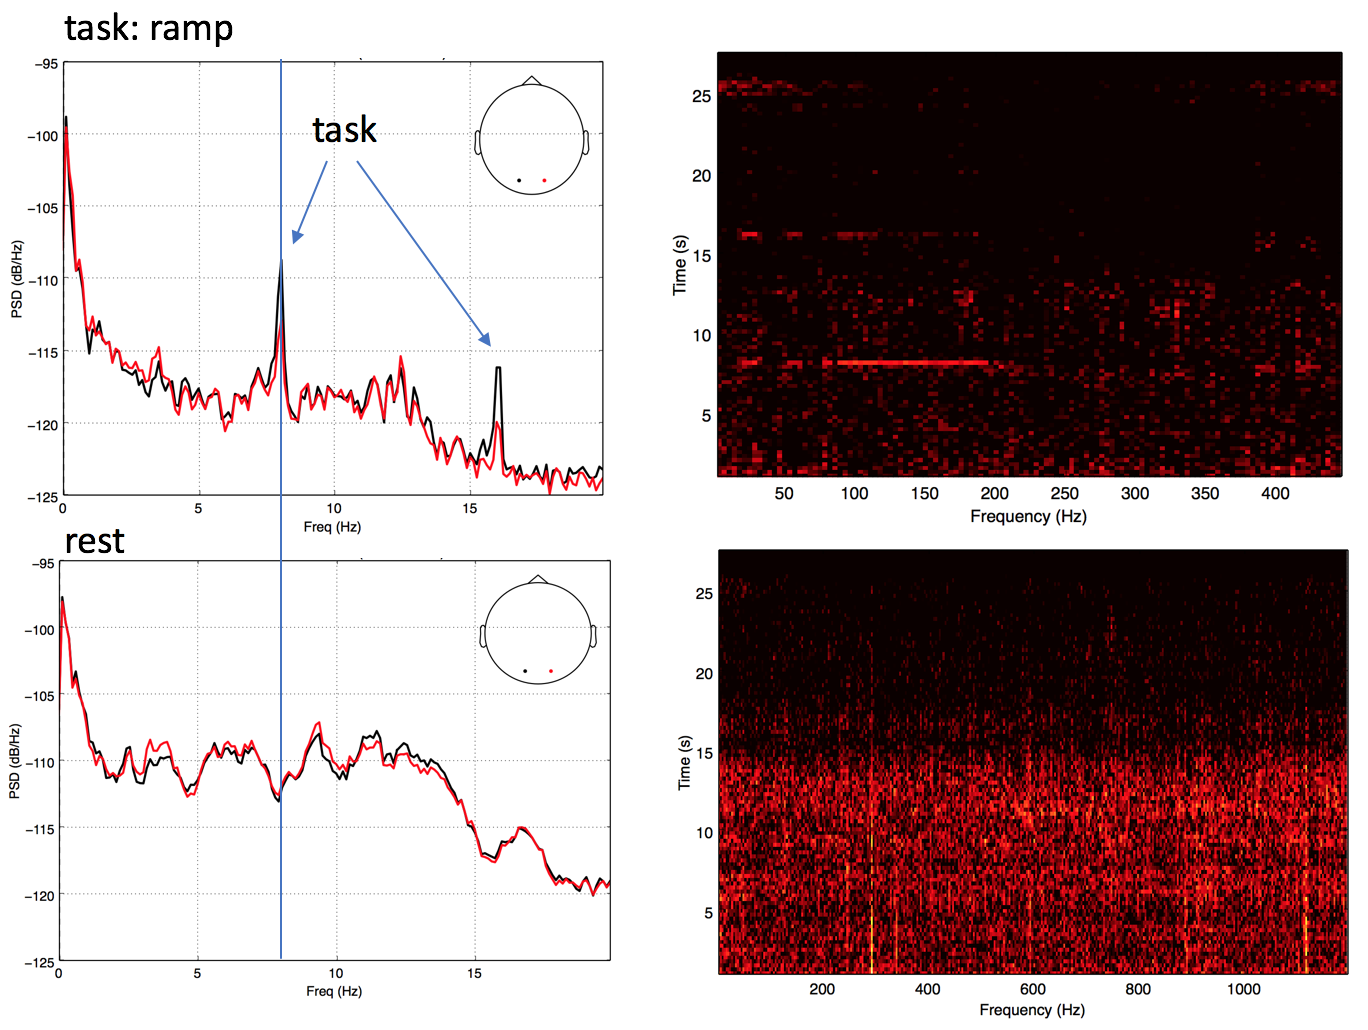
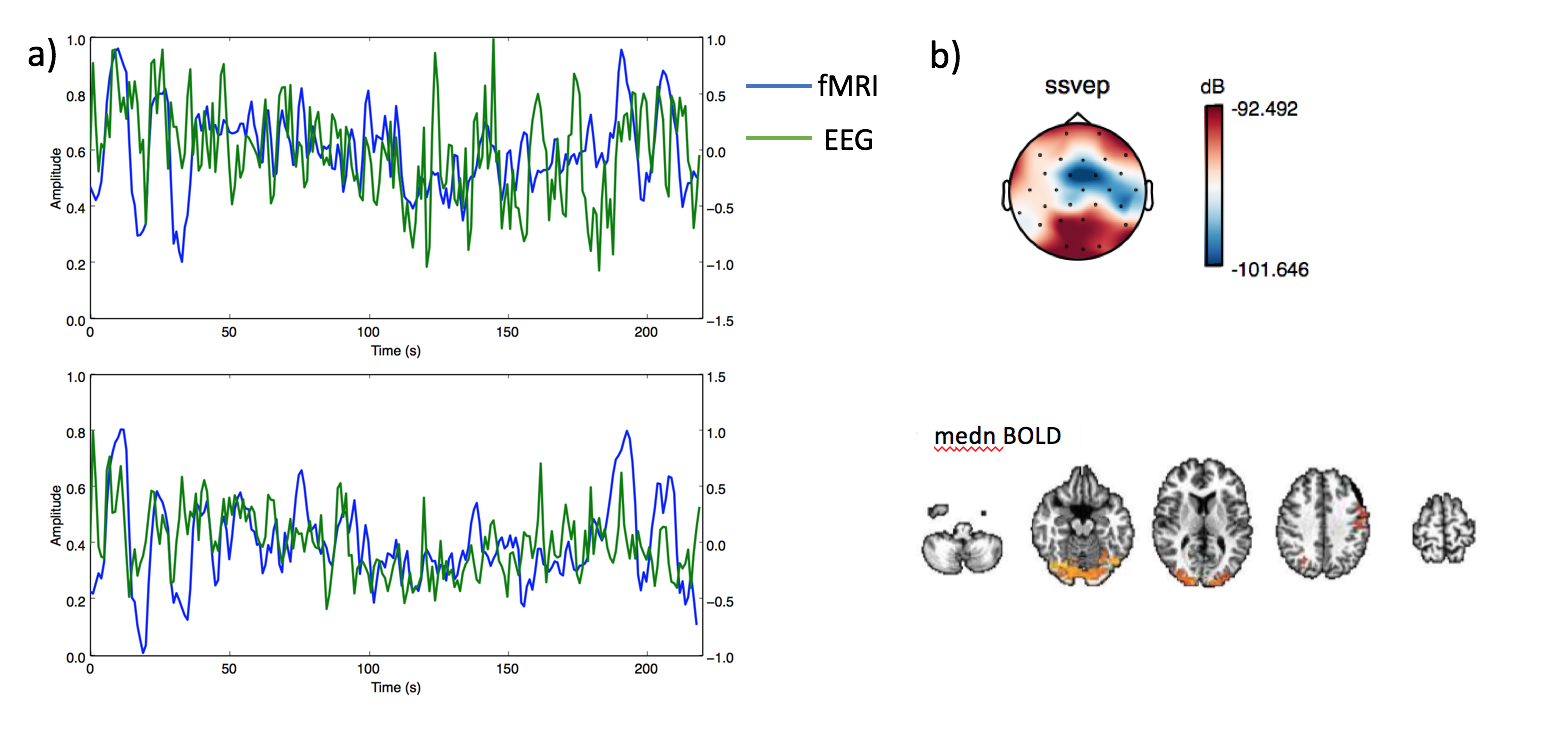
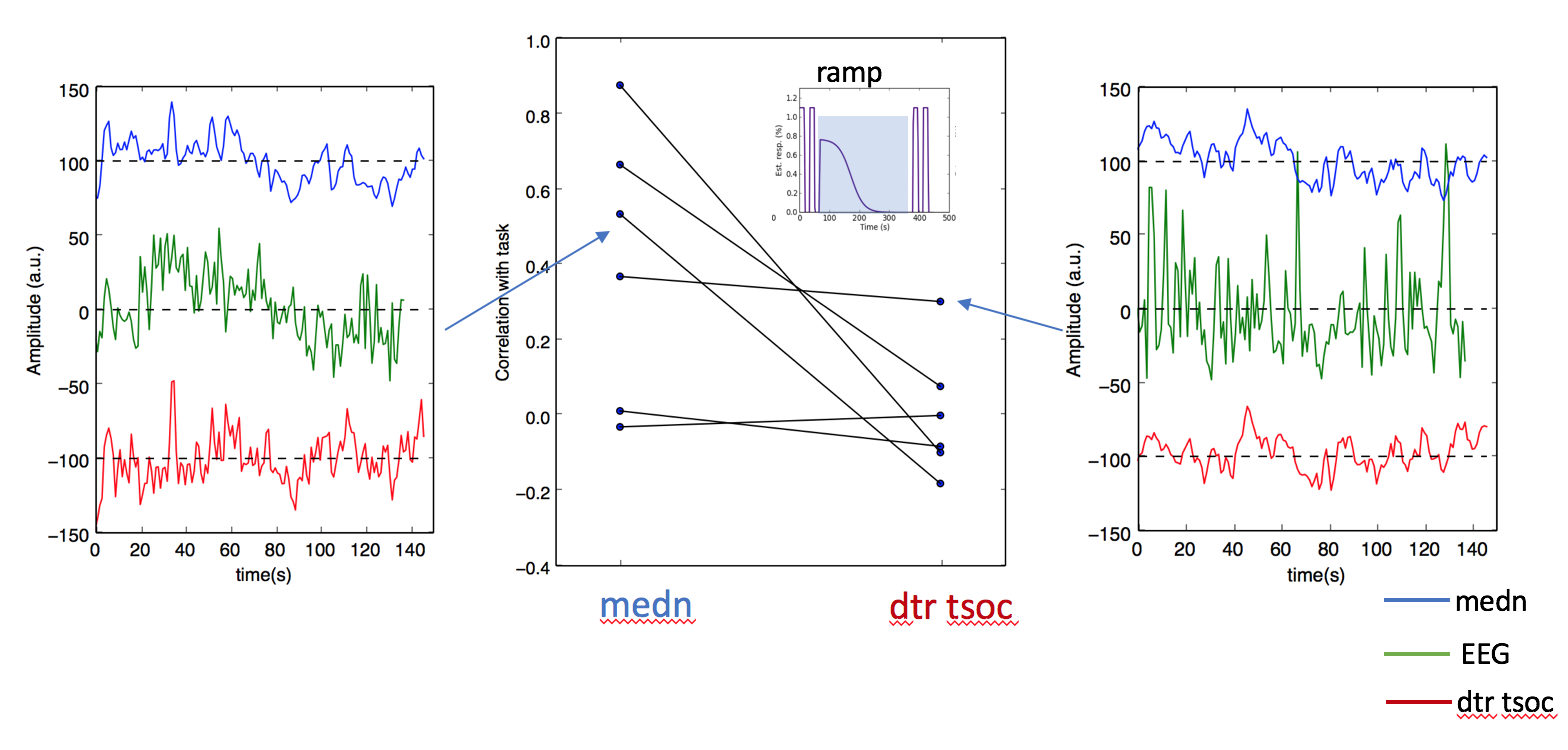
Figure 2 shows a representative spectrogram power spectrum (a) and spectrogram (b) illustrating a strong task frequency peak and temporal response of the EEG signal during the visual task which is absent during a similar period of rest. Figure 3a shows the overall group EEG and medn fMRI timeseries data. Figure 3b shows example spatial map for each modality illustrating the specificity of the response to the visual cortex. Figure 4 shows improvements to the fMRI timeseries correlation to the ideal task for the medn data compared to the regular processed data (dtr_tsoc) at the subject level.
There is good correlation between the group average EEG power at the task frequency for the occipital electrodes with the denoised BOLD timeseries from the visual cortex. The changes to the fMRI task response using ME-ICA denoising varies per subject however it preserves the task signature which is visible in the EEG data. Comparatively, residual trends still remain in the dtr_tsoc data which degrades the appearance of the task.
Conclusion
We conclude that ME-ICA can be used to extract ultraslow fMRI fluctuations of neuronal origin, while excluding confounds due to scanner drift. This work can be extended to applications of modulations of resting state vigilance, sleep staging or drug response.Acknowledgements
No acknowledgement found.References
Cox RW. et al. (1996) Comput Biomed Res. 29(3):162-173.
Evans JW. et al. (2015) Neuroimage. 105:189-97
Gramfort et al (2013) Frontiers in Neuroscience 7:1662-453X
Horovitz S.et al. (2008) Hum Brain Mapp. 29(6):671-82.
Kundu, P. et al., (2012) Neuroimage 60(3):17591770
Liu ZM (2012) Neuroimage 59(3):207-387
Smith AM (1999) Neuroimage 9:526–533
Vialatte FB et (2010) Progress in Neurobiology 90(4): 418–438
Wise RG et al. (2004) Neuropsychopharmacology.29:626–635
Figures