1013
Focused Ultrasound Induced Opening of the Blood-Brain Barrier Disrupts Inter-Hemispheric Resting State Functional Connectivity in the Rat Brain1Brigham and Women's Hospital, Boston, MA, United States, 2Harvard Medical School, Boston, MA, United States, 3Boston Children's Hospital, Boston, MA, United States
Synopsis
Focused ultrasound can be used as a non-invasive method to disrupt the blood-brain barrier in a targeted, localized, and safe manner. This technology allows for targeted delivery of drugs into the brain for treatment and research applications. While FUS-induced BBB opening has been shown to be safe, there is evidence that it modulates neuronal activity and/or vascular hemodynamics. This study uses resting state fMRI data from rats to investigate these effects. We find that FUS BBB opening targeted to the primary somatosensory cortex reduces local functional connectivity in the ipsilateral sensorimotor cortical areas and in the contralateral primary somatosensory cortex.
Introduction
It has been shown that combining focused ultrasound (FUS) with intravenously injected microbubbles creates forces on blood vessel walls that open the blood-brain barrier (BBB)1. This noninvasive and localized opening of the BBB allows for targeted delivery of pharmacological agents into the brain for use in treatments and research. Extensive experimental evidence has shown that there is a safe window of FUS power levels such that the BBB can be opened without damaging local tissues2,3. However, open questions remain related to the effects that FUS-induced BBB opening has on other aspects of local physiology, such as neuronal activity and vascular hemodynamics4,5.Methods
Resting state fMRI data was collected in Sprague-Dawley rats after they underwent FUS-induced BBB opening (N=8) or sham FUS (N=8) targeted to the right primary somatosensory cortex. Functional connectivity for the two groups was investigated using connectivity matrices, seed-based correlation maps, and independent component analysis (ICA).
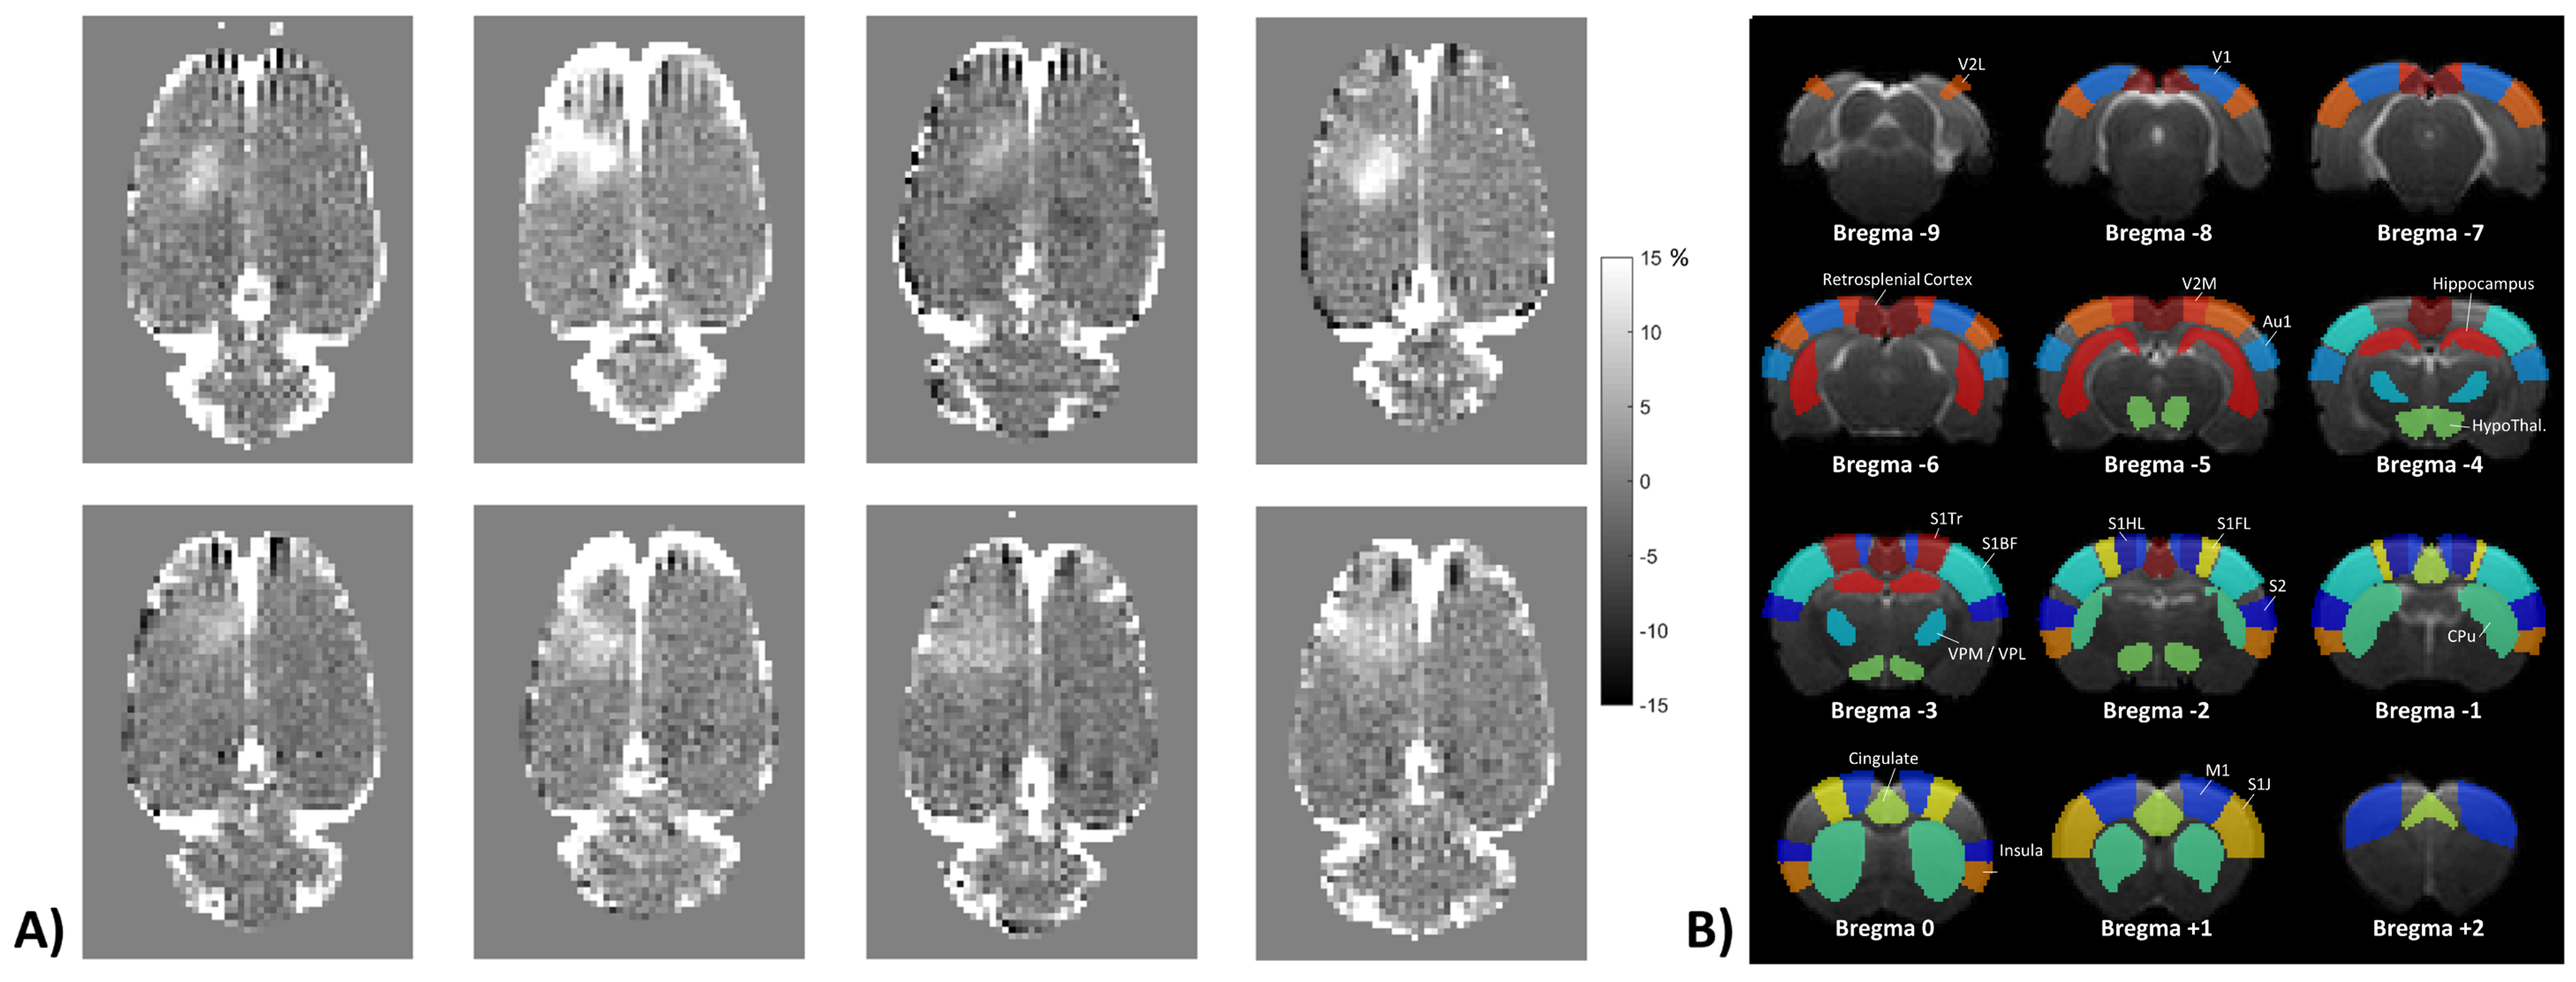
BBB opening: The primary somatosenory cortex hindlimb region (S1HL) in the right hemisphere only was targeted for BBB disruption. Microbubbles were injected (Optison, 200 μl/kg) and 690 kHz transcranial FUS was applied using 10 ms bursts at 1 Hz for 120 seconds. The extent and location of BBB opening were evaluated after the fMRI sessions with T1-weighted Gadolinium contrast imaging. Sham FUS sessions were identical except no FUS sonications were applied.
rs-fMRI: Images were acquired on a Bruker 7T scanner with a single shot EPI sequence (TR = 1.5 s, TE = 18 ms, 18 slices, 0.5 x 0.5 x 1.0 mm resolution, 300 images). Rats were sedated with an initial bolus of Dexdomitor, continuous light isoflurane at 0.25% and subcutaneous infusion of Dexdomitor as needed to maintain physiological levels6,7. Using SPM12, the data were pre-processed with realignment, coregistration to a T2w anatomical image, normalization, and 0.8 x 0.8 x 0.8 mm FWHM spatial smoothing. Using in-house Matlab scripts, the data were further temporally filtered (0.01 to 0.1 Hz bandpass), motion traces and a white-matter MRI signal were regressed out, and the mean signal over time was removed on a voxel-by-voxel basis.
Data Analysis: 34 anatomical regions were defined8 and 1.5 mm diameter spherical seed ROIs were placed in the center of each anatomical region. Connectivity matrices were constructed by correlating the time courses from every pair of anatomical seed ROIs. Whole brain correlation maps were produced by correlating the seed ROIs with every voxel in the brain. Finally, group ICA was used to separate the MRI signal into different spatial components without any a priori knowledge of anatomy9.
Results
Figure 1A shows the location and extent of BBB opening in each of the eight rats. The 34 anatomical regions defined for the study are shown in Figure 1B.
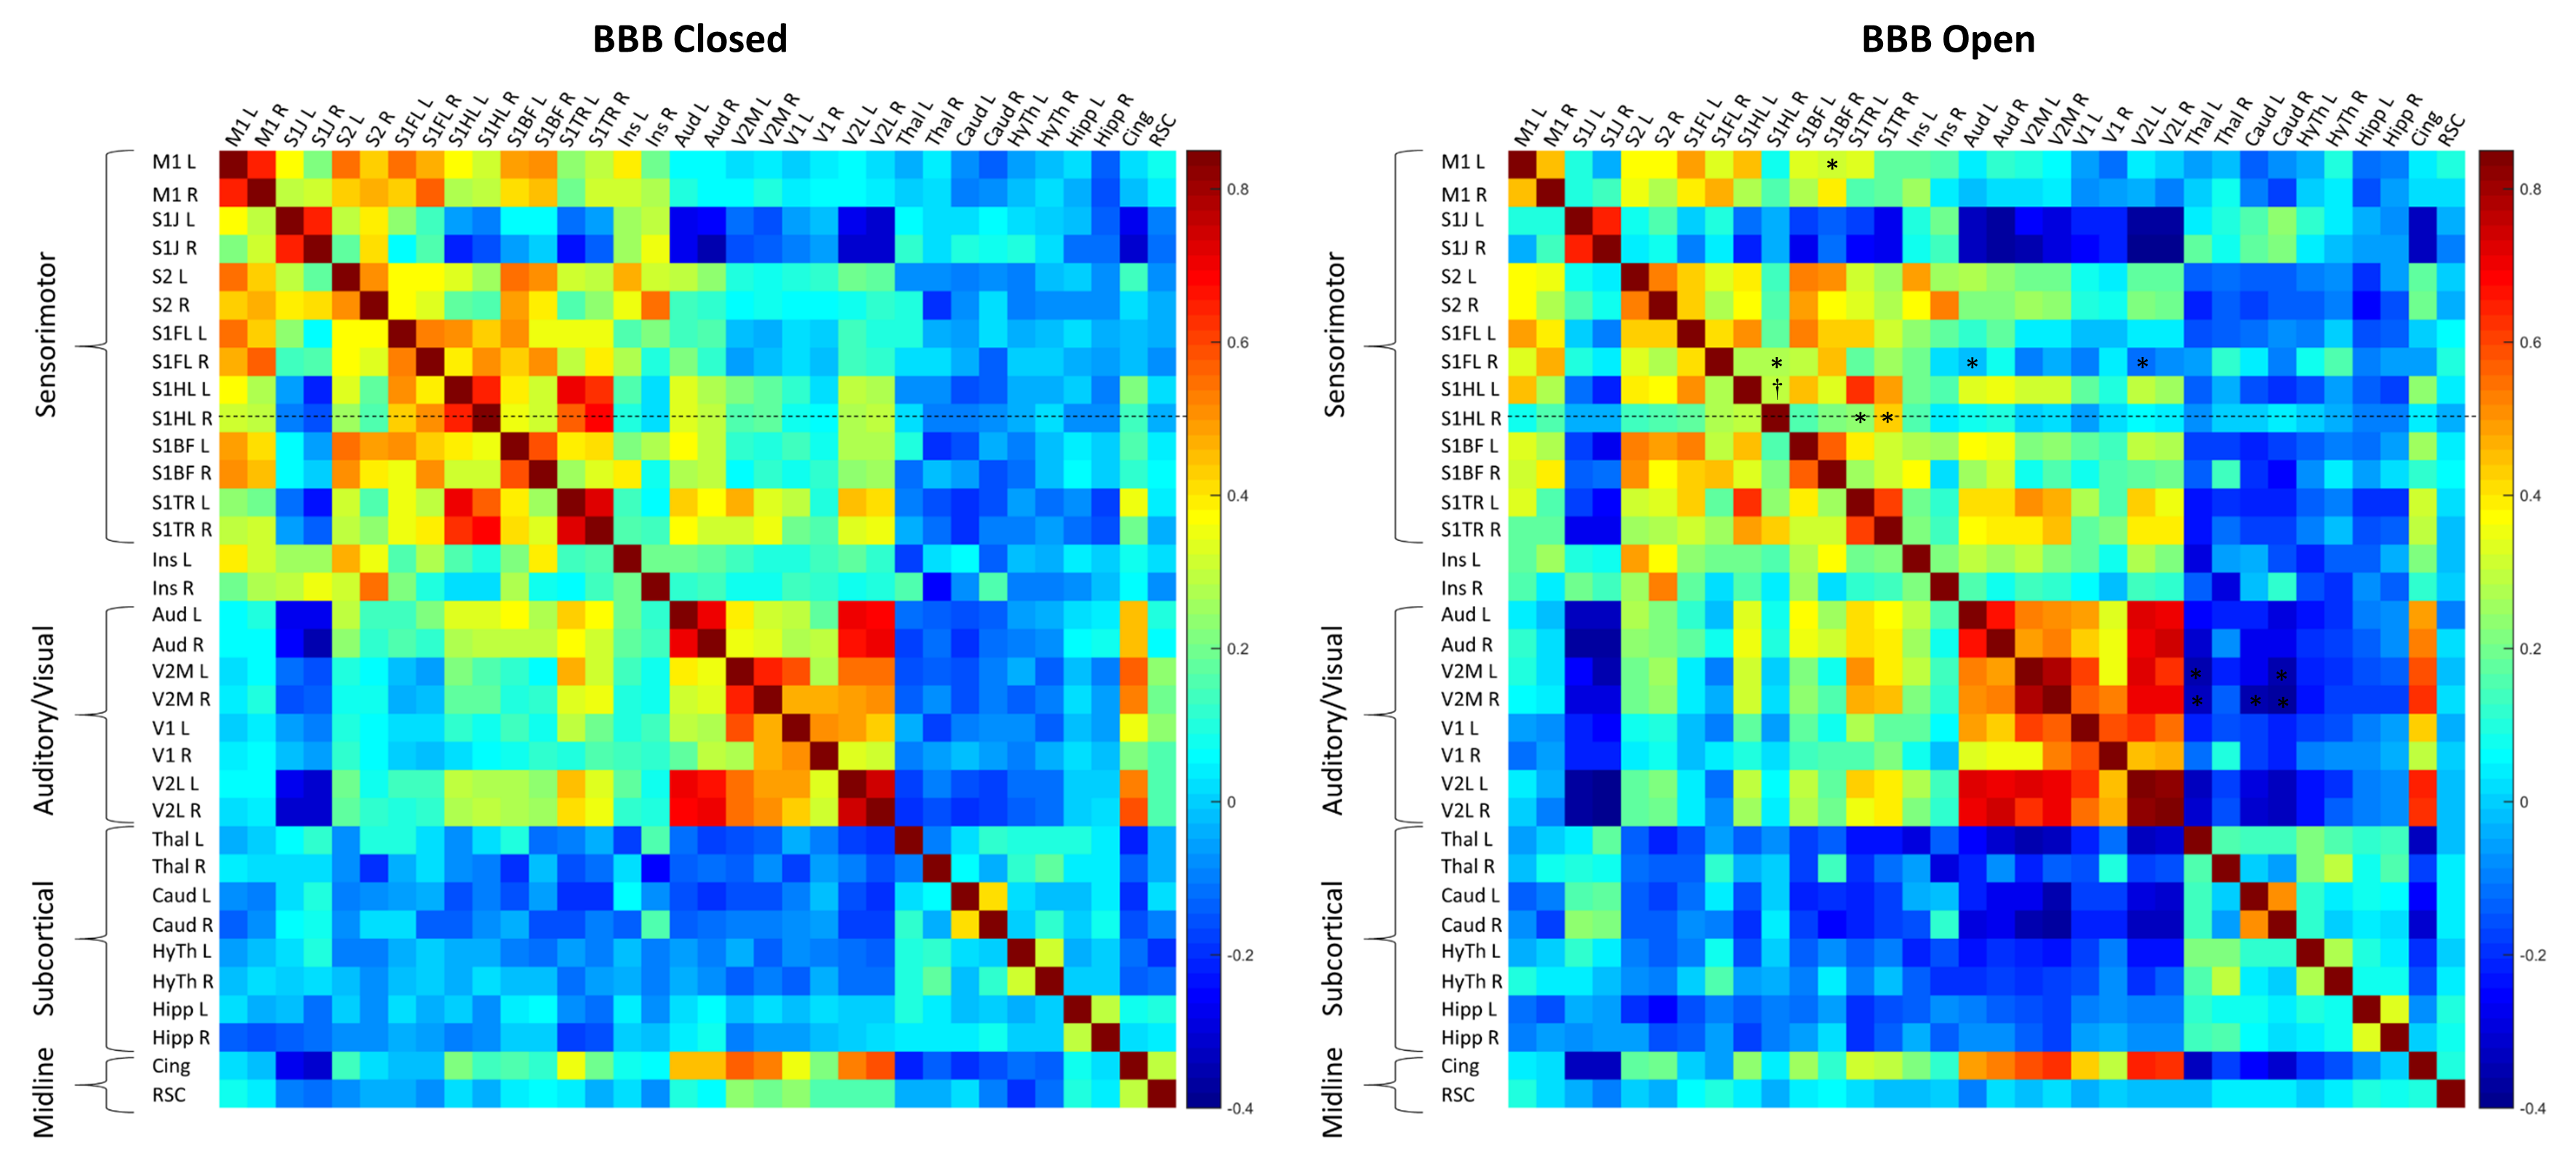
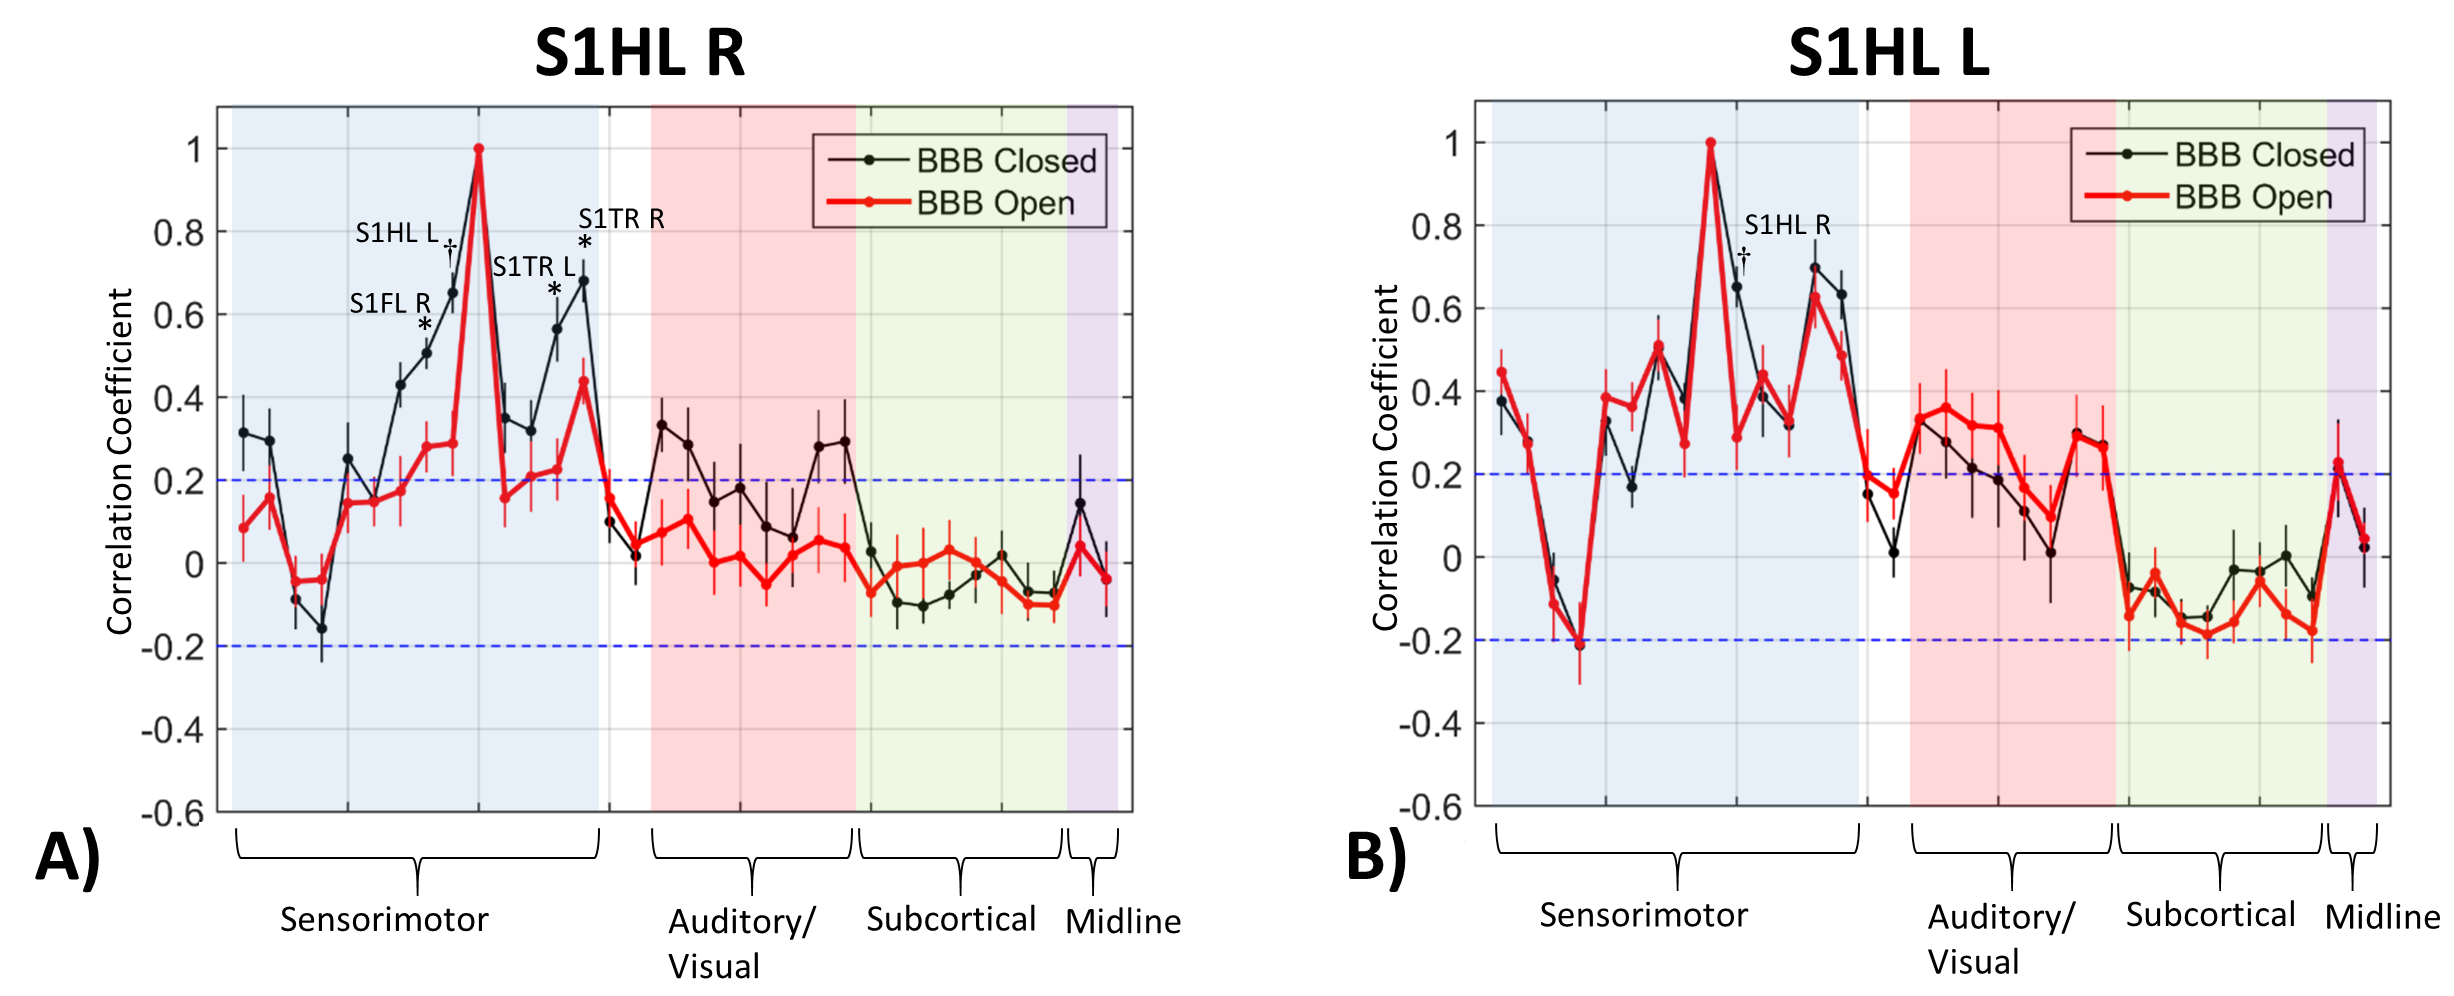
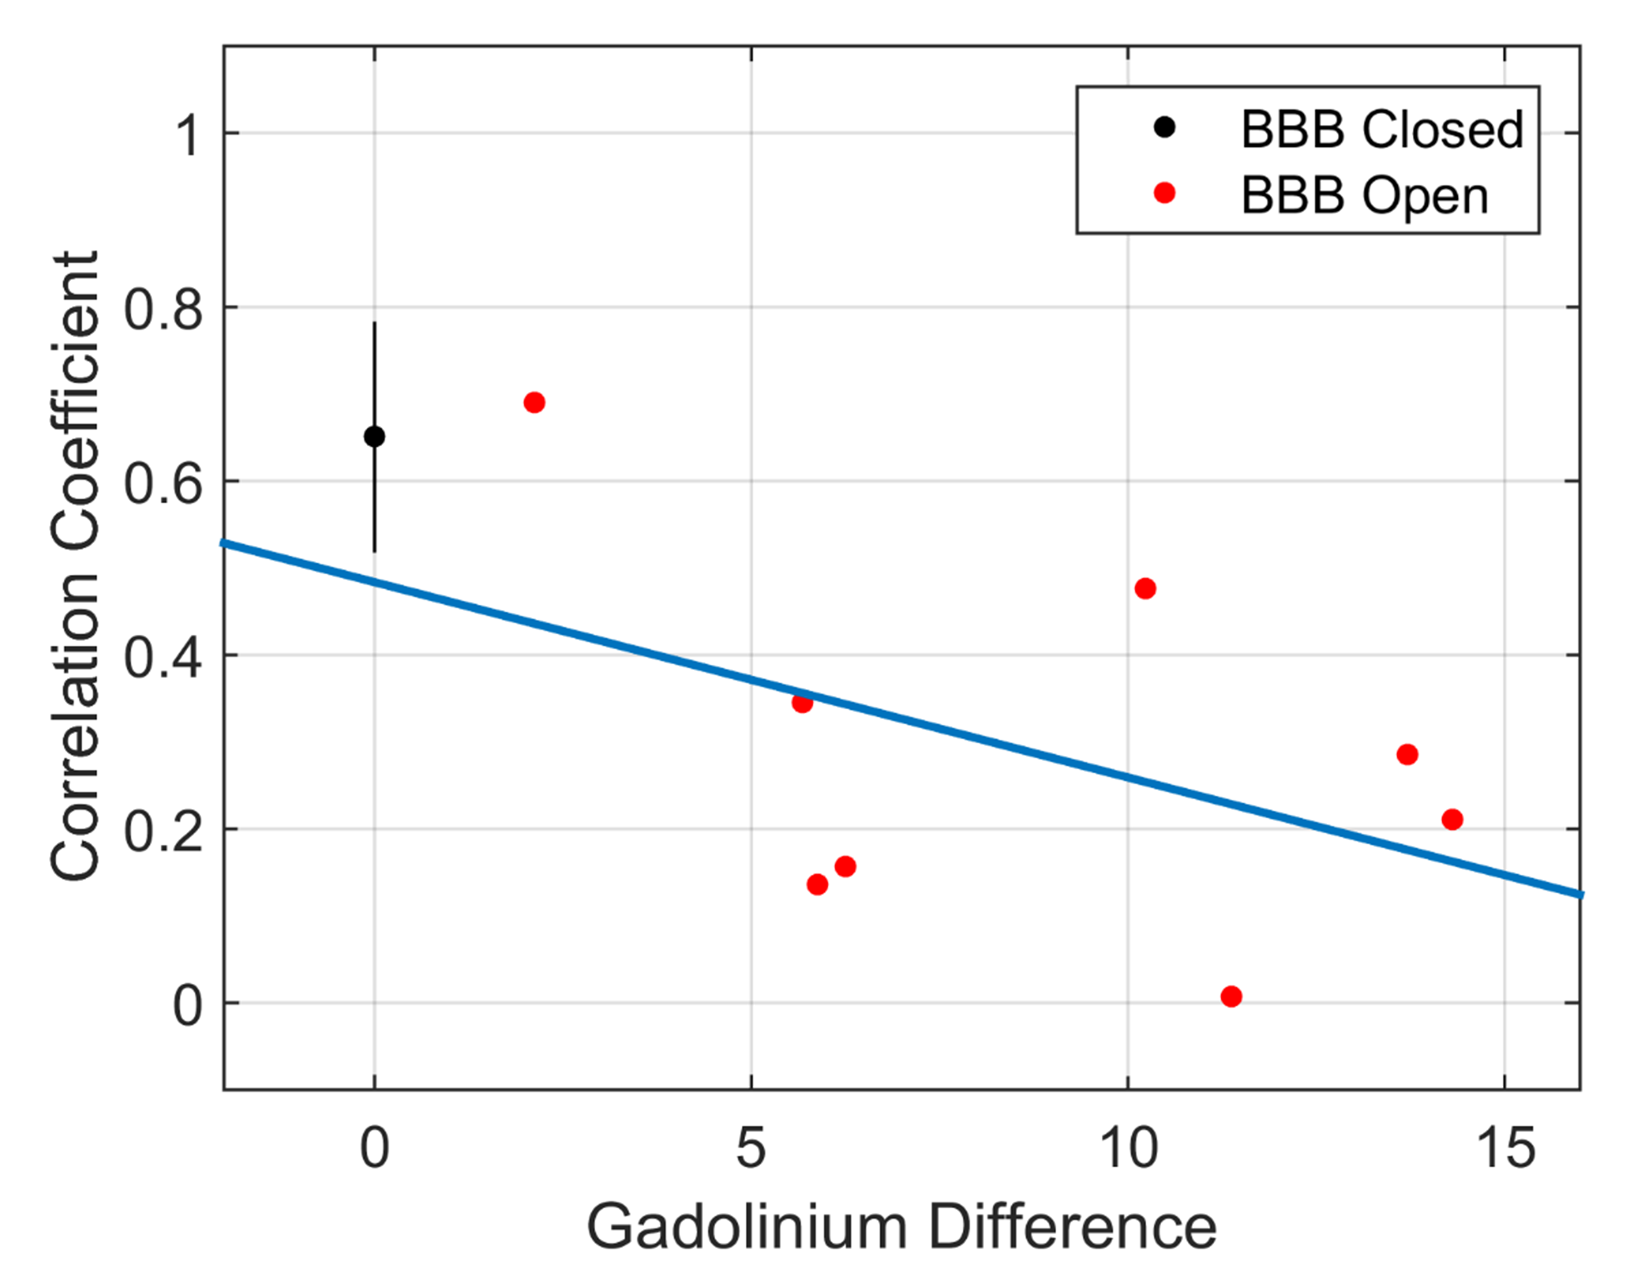
Connectivity matrix results are shown in Figures 2, 3, and 4. The full connectivity matrices for the BBB Closed and BBB Open groups show similar large scale patterns, with sensorimotor, auditory/visual, and subcortical regions having the strongest connections to other regions within their same class, and left/right homologous regions having strong connections. The major differences in connectivity between the two groups are highlighted in Figure 3. The BBB Open group shows significantly reduced connectivity between the right S1HL, where the BBB opening was targeted, and other sensorimotor ROIs. This is not the case for the left S1HL region. Figure 4 shows that the effect of reduced connectivity between the left and right S1HL regions is correlated with the extent of BBB Opening.
Figure 5 shows seed-based correlation maps and ICA maps for seven of the anatomically defined regions. For the BBB Closed group, all regions show strong bilateral patterns. For the BBB Open group, the bilaterality is much reduced for the S1HL region in both the seed-based and ICA maps.
Discussion & Conclusions
These results are further evidence that even safe levels of FUS BBB opening have an effect on the physiological processes that drive the signal measured by BOLD fMRI. It is not yet clear whether the effects are neuronal or vascular in nature. These effects must be accounted for when carrying out studies using fMRI to evaluate the effects of pharmacological agents delivered via FUS-induced BBB opening.Acknowledgements
NIH grants R25CA089017-13 and K01EB023983, and the Focused Ultrasound Surgery Foundation 2017 Global Internship Program.References
1. Hynynen, K. et al., 2001. Noninvasive MR imaging-guided focal opening of the blood-brain barrier in rabbits. Radiology, 220(3), pp.640–6.
2. McDannold, N. et al., 2012. Temporary disruption of the blood-brain barrier by use of ultrasound and microbubbles: safety and efficacy evaluation in rhesus macaques. Cancer research, 72(14), pp.3652–63.
3. Huang, Y. et al., 2017. Opening the Blood-Brain Barrier with MR Imaging-guided Focused Ultrasound: Preclinical Testing on a Trans-Human Skull Porcine Model. Radiology, 282(1):123-130.
4. Chu, P. et al., 2015. Neuromodulation accompanying focused ultrasound-induced blood-brain barrier opening. Scientific Reports, 5:15477.
5. Downs, M. et al., 2015. Blood-Brain Barrier Opening in Behaving Non-Human Primates via Focused Ultrasound with Systemically Administered Microbubbles. Scientific Reports, 5:15076.
6. Adamczak, J.M. et al., 2010. High field BOLD response to forepaw stimulation in the mouse. NeuroImage, 51(2), pp.704–712.
7. Brynildsen, J. et al., 2017. Physiological characterization of a robust survival rodent fMRI method. Magnetic Resonance Imaging, 35, 54–60.
8. Paxinos G, Watson C. The rat brain in stereotaxic coordinates. Elsevier Inc.; 2007
9. Calhoun, V.D. et al., 2001. A Method for Making Group Inferences From Functional MRI Data Using Independent Component Analysis. Hum. Brain Map. vol. 14, pp. 140-151.
Figures