1012
Vagus Nerve Stimulation Evokes Widespread BOLD Responses in the Rat Brain1Biomedical Engineering, Purdue University, West Lafayette, IN, United States, 2Electrical and Computer Engineering, Purdue University, West Lafayette, IN, United States, 3Psychological Science, Purdue University, West Lafayette, IN, United States
Synopsis
Vagus nerve stimulation (VNS) is an emerging treatment for brain disorders, such as depression and epilepsy. However, its efficacy varies, and its mechanism is unclear. Prior studies have used functional MRI (fMRI) to map brain activations with VNS in human brains but yielded inconsistent findings. The source of the inconsistency might be attributed to the complex temporal characteristics of VNS-evoked responses that cannot be fully explained by simplified response models. Using a rat model, we aimed to characterize the VNS evoked responses at the level of brain networks without assuming any priori response model. Our results suggest that the repetitive and block-wise stimulation to the vagus nerve induces activations at widespread brain regions. The responses are complex and variable across regions, much beyond what can be described with conventionally assumed HRF.
Purpose
Vagus nerve stimulation (VNS) is an emerging treatment for brain disorders, such as depression and epilepsy. However, its efficacy varies, and its mechanism is unclear. Prior studies have used functional MRI (fMRI) to map brain activations with VNS in human brains but yielded inconsistent findings. The source of the inconsistency might be attributed to the complex temporal characteristics of VNS-evoked responses that cannot be fully explained by simplified response models. Using a rat model, we aimed to characterize the VNS evoked responses at the level of brain networks without assuming any priori response model.Method
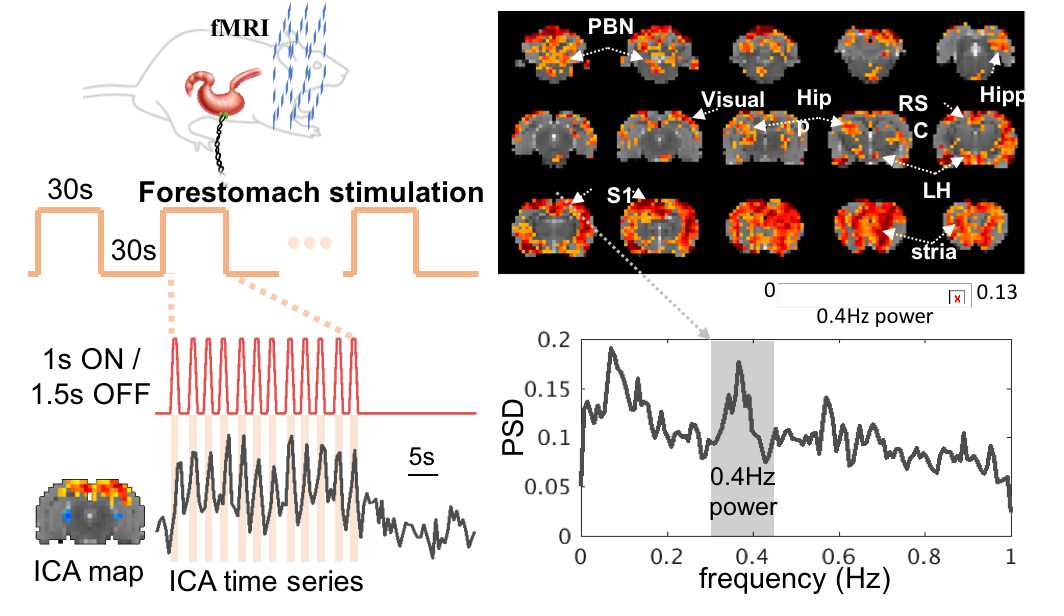
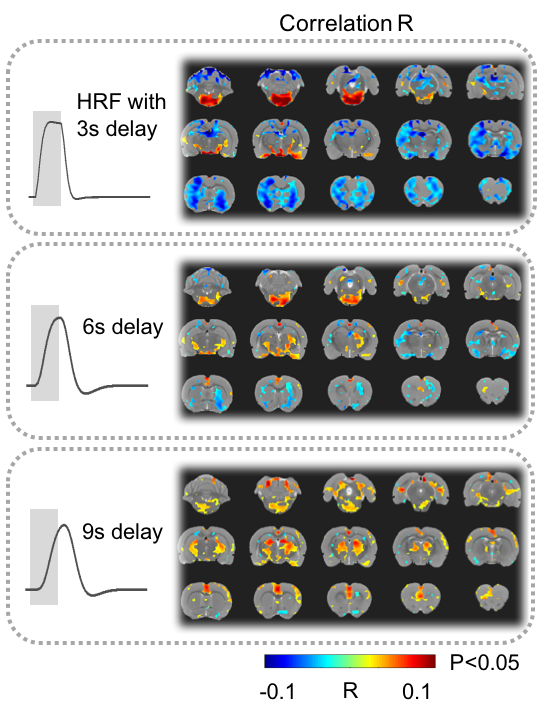
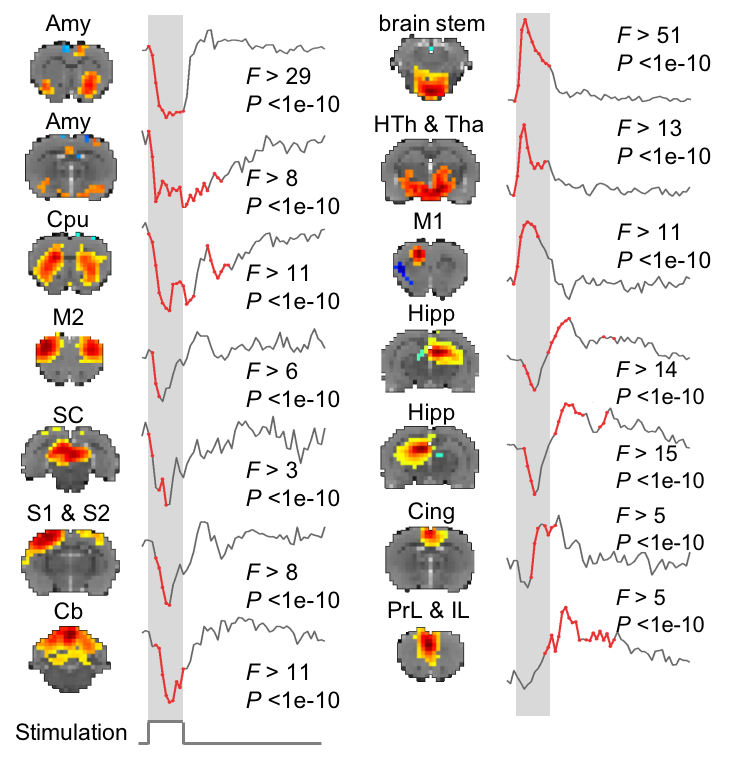
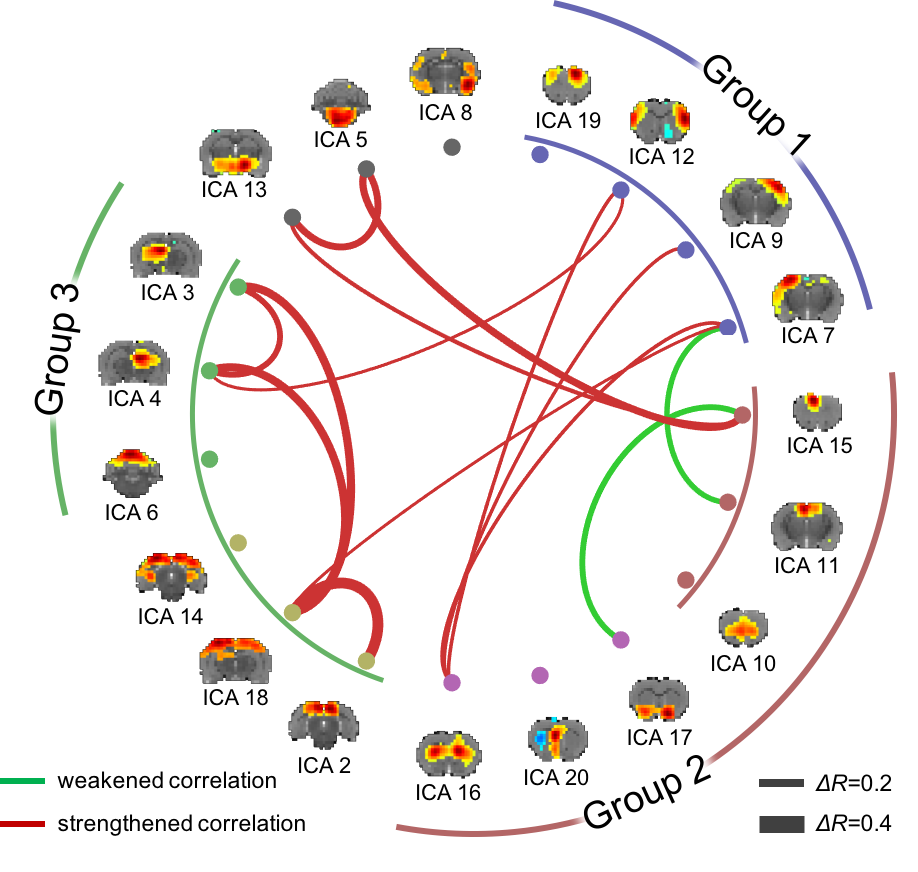
17 animals were scanned with fMRI either during VNS (n=7) or in the resting state (n=10). For VNS-fMRI, each animal was implanted with a MRI-compatible cuff electrode on the left cervical vagus nerve (Fig. 1). Then the animal was scanned with 2-D single-shot gradient-echo echo-planar imaging (EPI, 1s repetition time, 15ms echo time, 55° flip angle, 0.6×0.6×1 mm3 voxel size) in a 7-tesla small-animal MRI system (BioSpec 70/30, Bruker). The animal was anesthetized with continuous dexmedetomidine (SC-infusion, 0.015 mg/Kg/h) and isoflurane (0.1-0.5% mixed in O2). During EPI, the vagus nerve was stimulated with repetitive current pulses (0.1mA, 0.1ms, 10Hz) delivered in a (50s-OFF-10s-ON) block-design paradigm (Fig. 1). A similar protocol without VNS was used for the resting-state fMRI. After the standard preprocessing, the fMRI data were analyzed with model-based and model-free methods for mapping the blood oxygenation level dependent (BOLD) activations with VNS. For the model-based analysis, a response model was derived by convolving the VNS with a hemodynamic response function (HRF) with a peak latency of 3, 6, or 9s. The resulting response model was correlated with the fMRI signal at every voxel, to map the areas where the correlations were significant in the group level (one-sample t-test, p<0.05). For the model-free analysis, spatially independent component analysis (ICA) was used to map 20 brain networks. For each network, its time series was divided into 60-s segments defined around every VNS block. The segmented time series were averaged to generate the VNS-evoked response, which was tested for significance with a one-way analysis of variance (ANOVA) test (p<10-6). If significant, a one-sample t test was further used to test the significance of the response at each time point. In addition, the correlations between these networks were also calculated to infer their pair-wise functional connectivity during VNS and in the resting state. Separately for each condition, the functional networks were grouped into multiple groups based on k-means clustering (with the correlation-based distance measure). The strength of pair-wise correlation was also compared between conditions to assess the change in network-network functional activity given VNS relative to the resting state.Results
Model-based mapping of VNS-evoked BOLD activations was very sensitive to the variation of HRF. When using the HRF with different peak latencies (3, 6, 9s), the resulting activations appeared to occur in very different brain regions (Fig. 2). The model-free analysis showed that VNS-evoked activations occurred in 14 out of 20 brain networks (Fig. 3), collectively covered ~76% of the brain volume. Note that different networks showed highly complex and distinctive responses (Fig. 3), which differed in polarity, timing, and duration etc. In addition, VNS changed the functional connectivity among networks, and as a result, altered the clustering or organization of brain networks (Fig. 4). Relative to the resting state, VNS increased the functional connectivity among the hippocampus, retrosplenial cortex, striatum, and sensorimotor cortex, whereas it decreased the functional connectivity between the cingulate cortex and sensorimotor system (Fig. 4).Conclusion
Here, we report a model-free analysis method for mapping and characterizing the BOLD activations with VNS. Findings obtained with this method suggest that the repetitive and block-wise stimulation to the left cervical vagus nerve induces activations at widespread brain regions. The responses are complex and variable across regions, much beyond what can be described with conventionally assumed HRF. In addition, VNS also alters functional connectivity among different brain networks, and changes the brain’s functional organization from its intrinsic mode as observed in the resting state. These findings suggest widespread and profound effects of VNS on the brain’s regional activity and inter-regional interaction. Such effects are likely under-estimated by the model-based analysis in prior studies. This study also highlights the value of fMRI for addressing the large-scale and brain-wide effects of VNS, in order to understand and optimize its potential use for treatment of disease conditions in the brain or other organs, e.g. the gastrointestinal system.Acknowledgements
This study was funded by National Institutes of Health’s SPARC - Stimulating Peripheral Activity to Relieve Conditions - program (OT2OD023847).References
No reference found.Figures