1010
DREADD-fMRI combination detects effects of activation of the striatal D1 receptor-expressing neurons on the basal ganglia-thalamocortical network in mice1Institut du Fer à Moulin, Inserm UPMC UMR-S839, Paris, France, 2NeuroSpin, Commissariat à l’Energie Atomique-Saclay Center, Gif-sur-Yvette, France
Synopsis
The dorsal striatum is a key region in motor behavior and motor disorders such as Parkinson’s and Huntington's diseases. We expressed designer receptors exclusively activated by designer drugs (DREADD) in D1 dopamine receptor-expressing neurons in the dorsal striatum in mice and investigated the behavioral and BOLD signal changes during the neuronal activation by clozapine-N-oxide (CNO) treatment. The increased BOLD signals with no susceptibility artifact in the dorsal striatum and the correlated BOLD signal changes in several regions including the substantia nigra and the globus pallidus were observed after CNO injection.
Purpose
The dorsal striatum (DS) is a key region in motor disorders such as Parkinson’s and Huntington’s diseases 1. Activation of D1 dopamine receptor-expressing neurons (D1-neurons) in the DS promotes movement through basal ganglia-thalamocortical network 2. Recent advances in the biological tools, namely designer receptors exclusively activated by designer drugs (DREADD), enabled us to regulate the neuronal activity by clozapine-N-oxide (CNO) injection 3. In this study, we used DREADD-fMRI to investigate the alteration of whole brain network during the activation of the D1-neurons in the DS. We investigated the changes in the motor activity, blood oxygenation level dependent (BOLD) signals and c-Fos expression, which is a marker of neuronal activation, in the same mice.Methods
Animals and manipulations
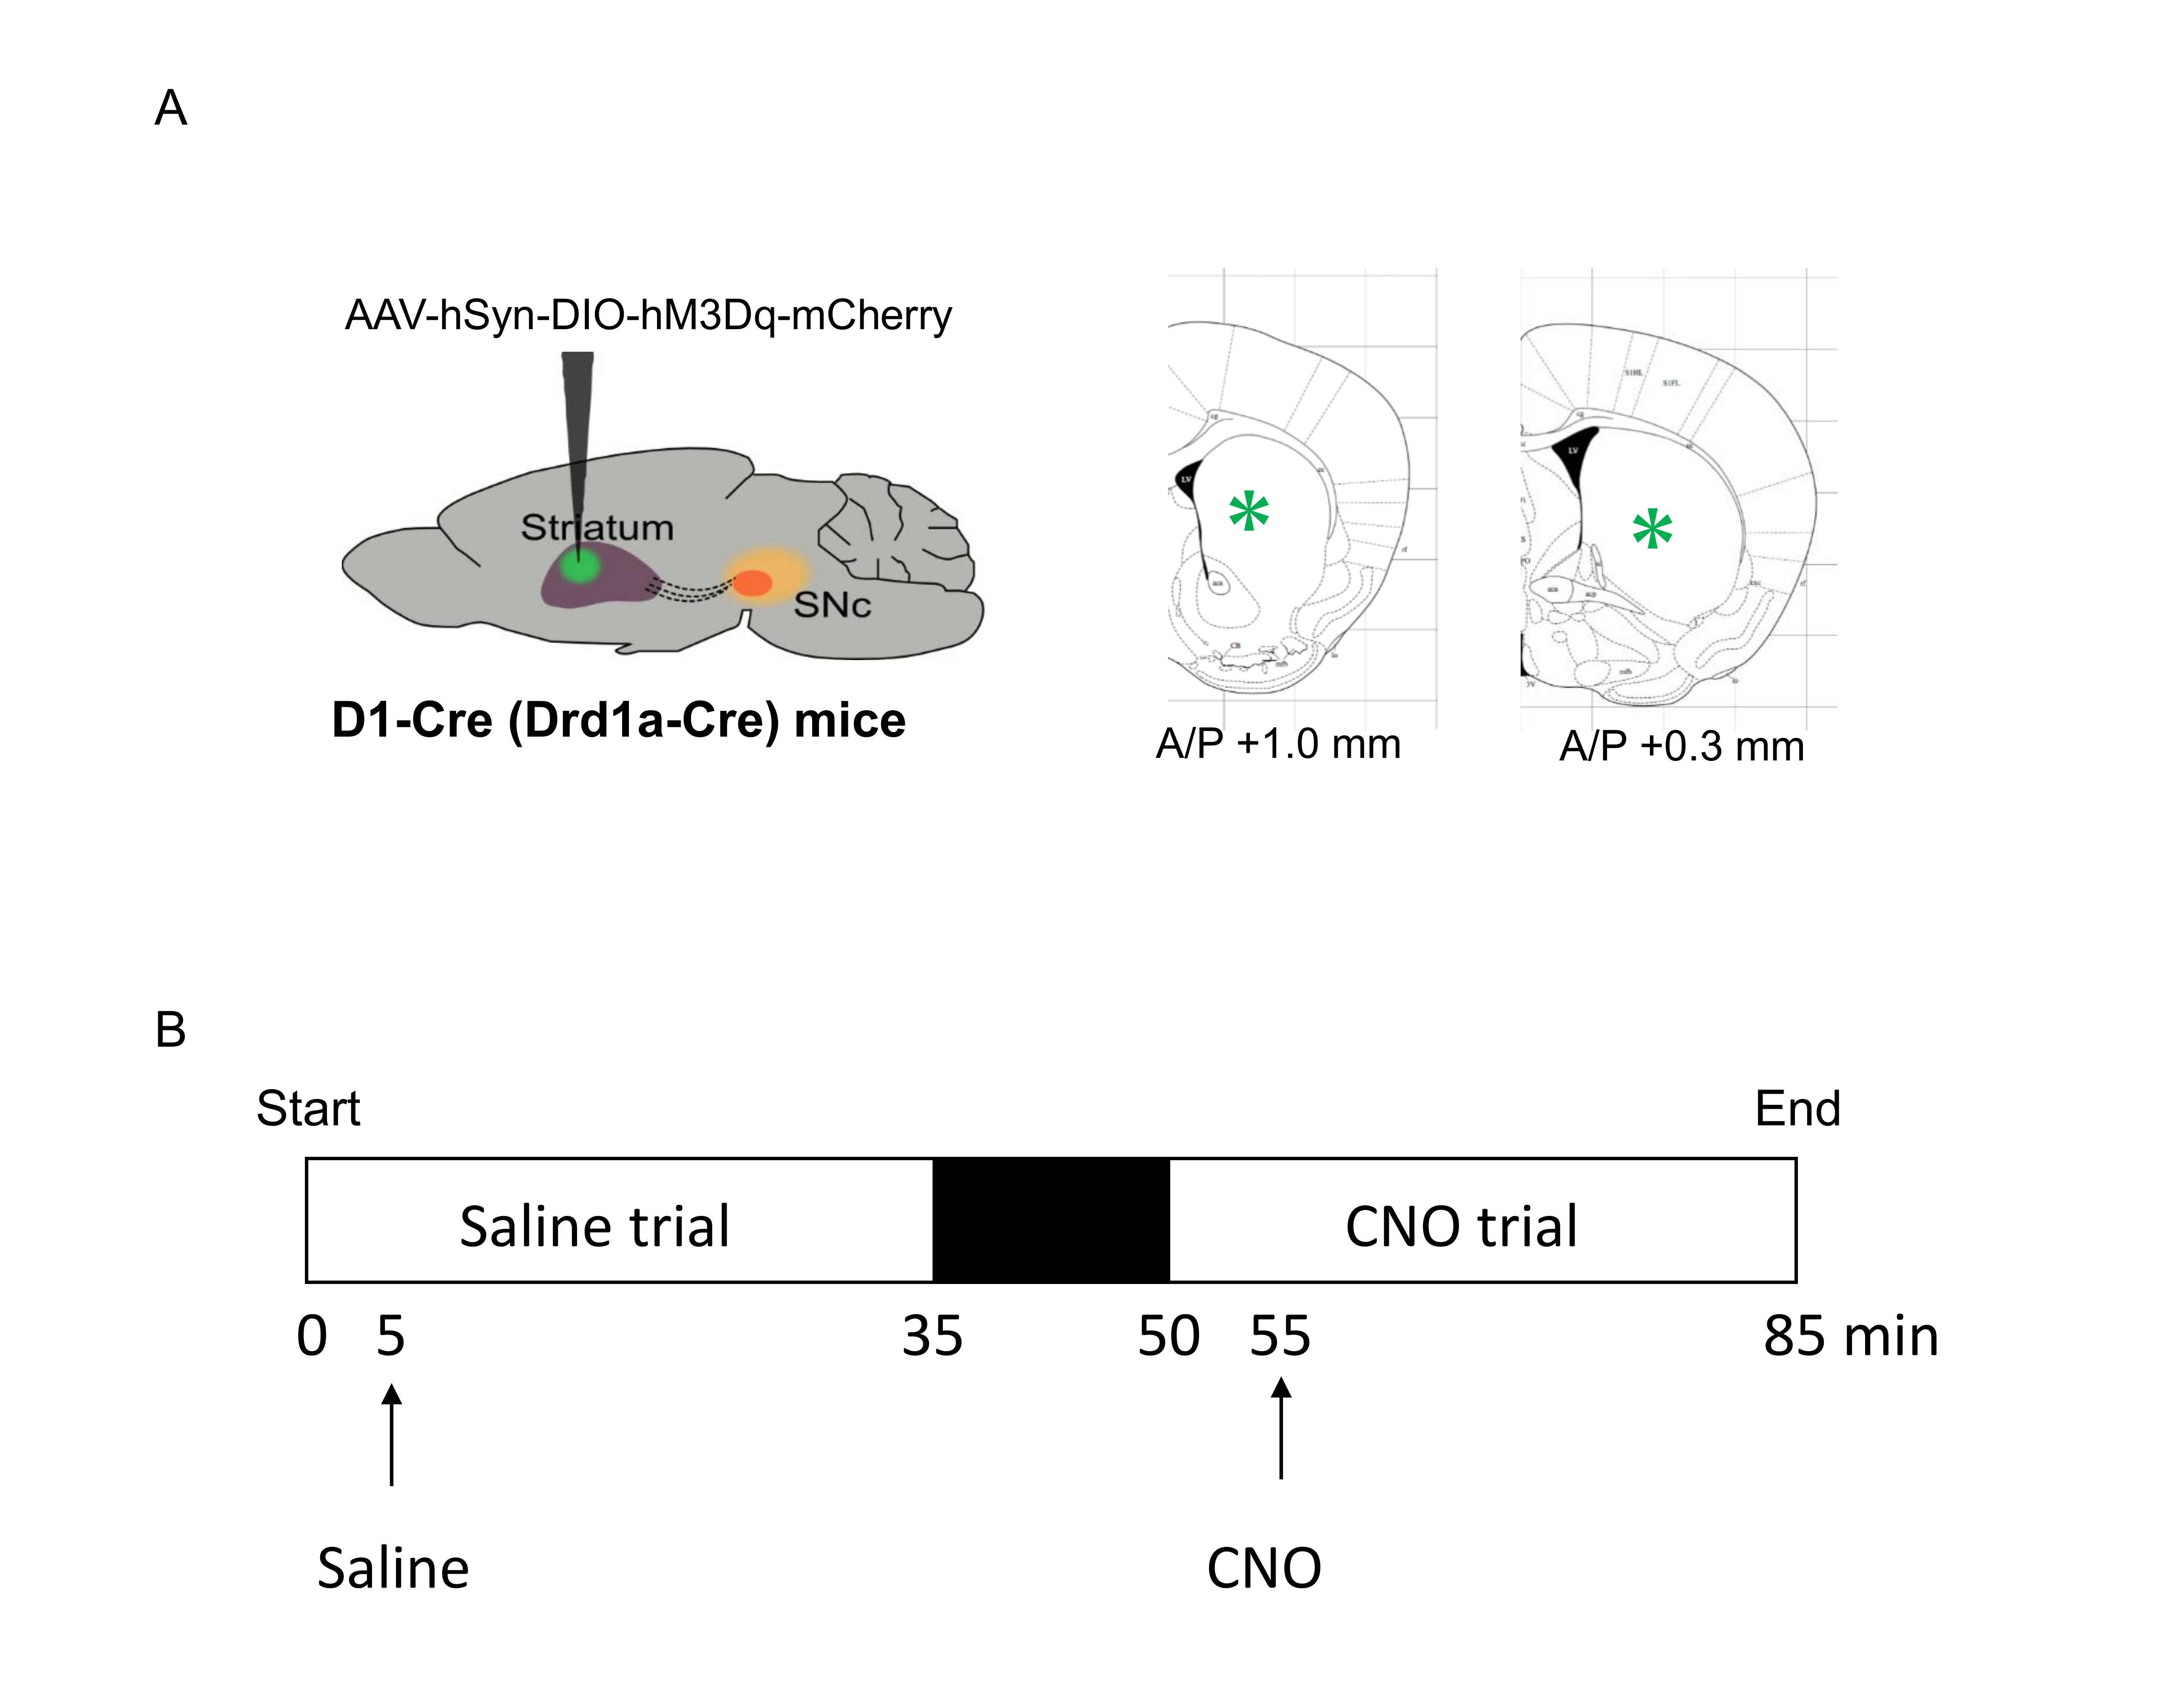
Drd1a-Cre (D1-Cre) transgenic mice (n=3) were used in this study. Cre-inducible adeno-associated viral (AAV) vectors, coding for the DREADD was unilaterally injected into the left DS of D1-Cre mice (Fig. 1A). Mice were placed in their home cages for more than 3 weeks for recovery.
Open field test
Distance traveled and the rotation of the mouse body were monitored in an open field using video-tracking system. The mice were tested for 2 consecutive days following 3-days habituation. Each animal was placed in the box for 60 minutes before CNO (0.2 mg/kg) or saline injection (i.p.) followed by additional 120 minutes.
FMRI
FMRI acquisition was conducted at Bruker 7T with a mouse brain array coil. FMRI images were acquired using a gradient-echo EPI sequence, TR/TE = 2,000/11 ms, spatial resolution = 150 x 150 x 500 µm3, 15 slices. Mice were anesthetized with 1.0% isoflurane. The respiration and the body temperature were maintained at 80 /min and 37 °C during the measurement. Five minutes after the start of fMRI scanning, saline (1st trial) or CNO (2nd trial) was injected intraperitoneally (Fig. 1B).
Image processing
The images were processed with slice timing correction and spatial correction (realignment and normalization) by SPM8. The time-courses in the left DS were extracted using a region of interest based on mouse brain atlas. To investigate the correlation map to the left DS, the left DS was chosen as seed regions and time-course of BOLD signals was used as the regressor 4.
Immunohistochemistry
The day after the fMRI experiment, mice were treated CNO. Ninety minutes after CNO injection, they were rapidly anesthetized with pentobarbital and perfused transcardially with 4% (w/v) paraformaldehyde in 0.1 M sodium phosphate buffer. Brains were post-fixed overnight and free-floating sections (30 µm ) were incubated with rabbit antibodies for c-Fos and chicken antibody for mCherry overnight. The secondary antibodies were anti-rabbit A633 antibody and anti-chicken A488 antibody respectively.
Results
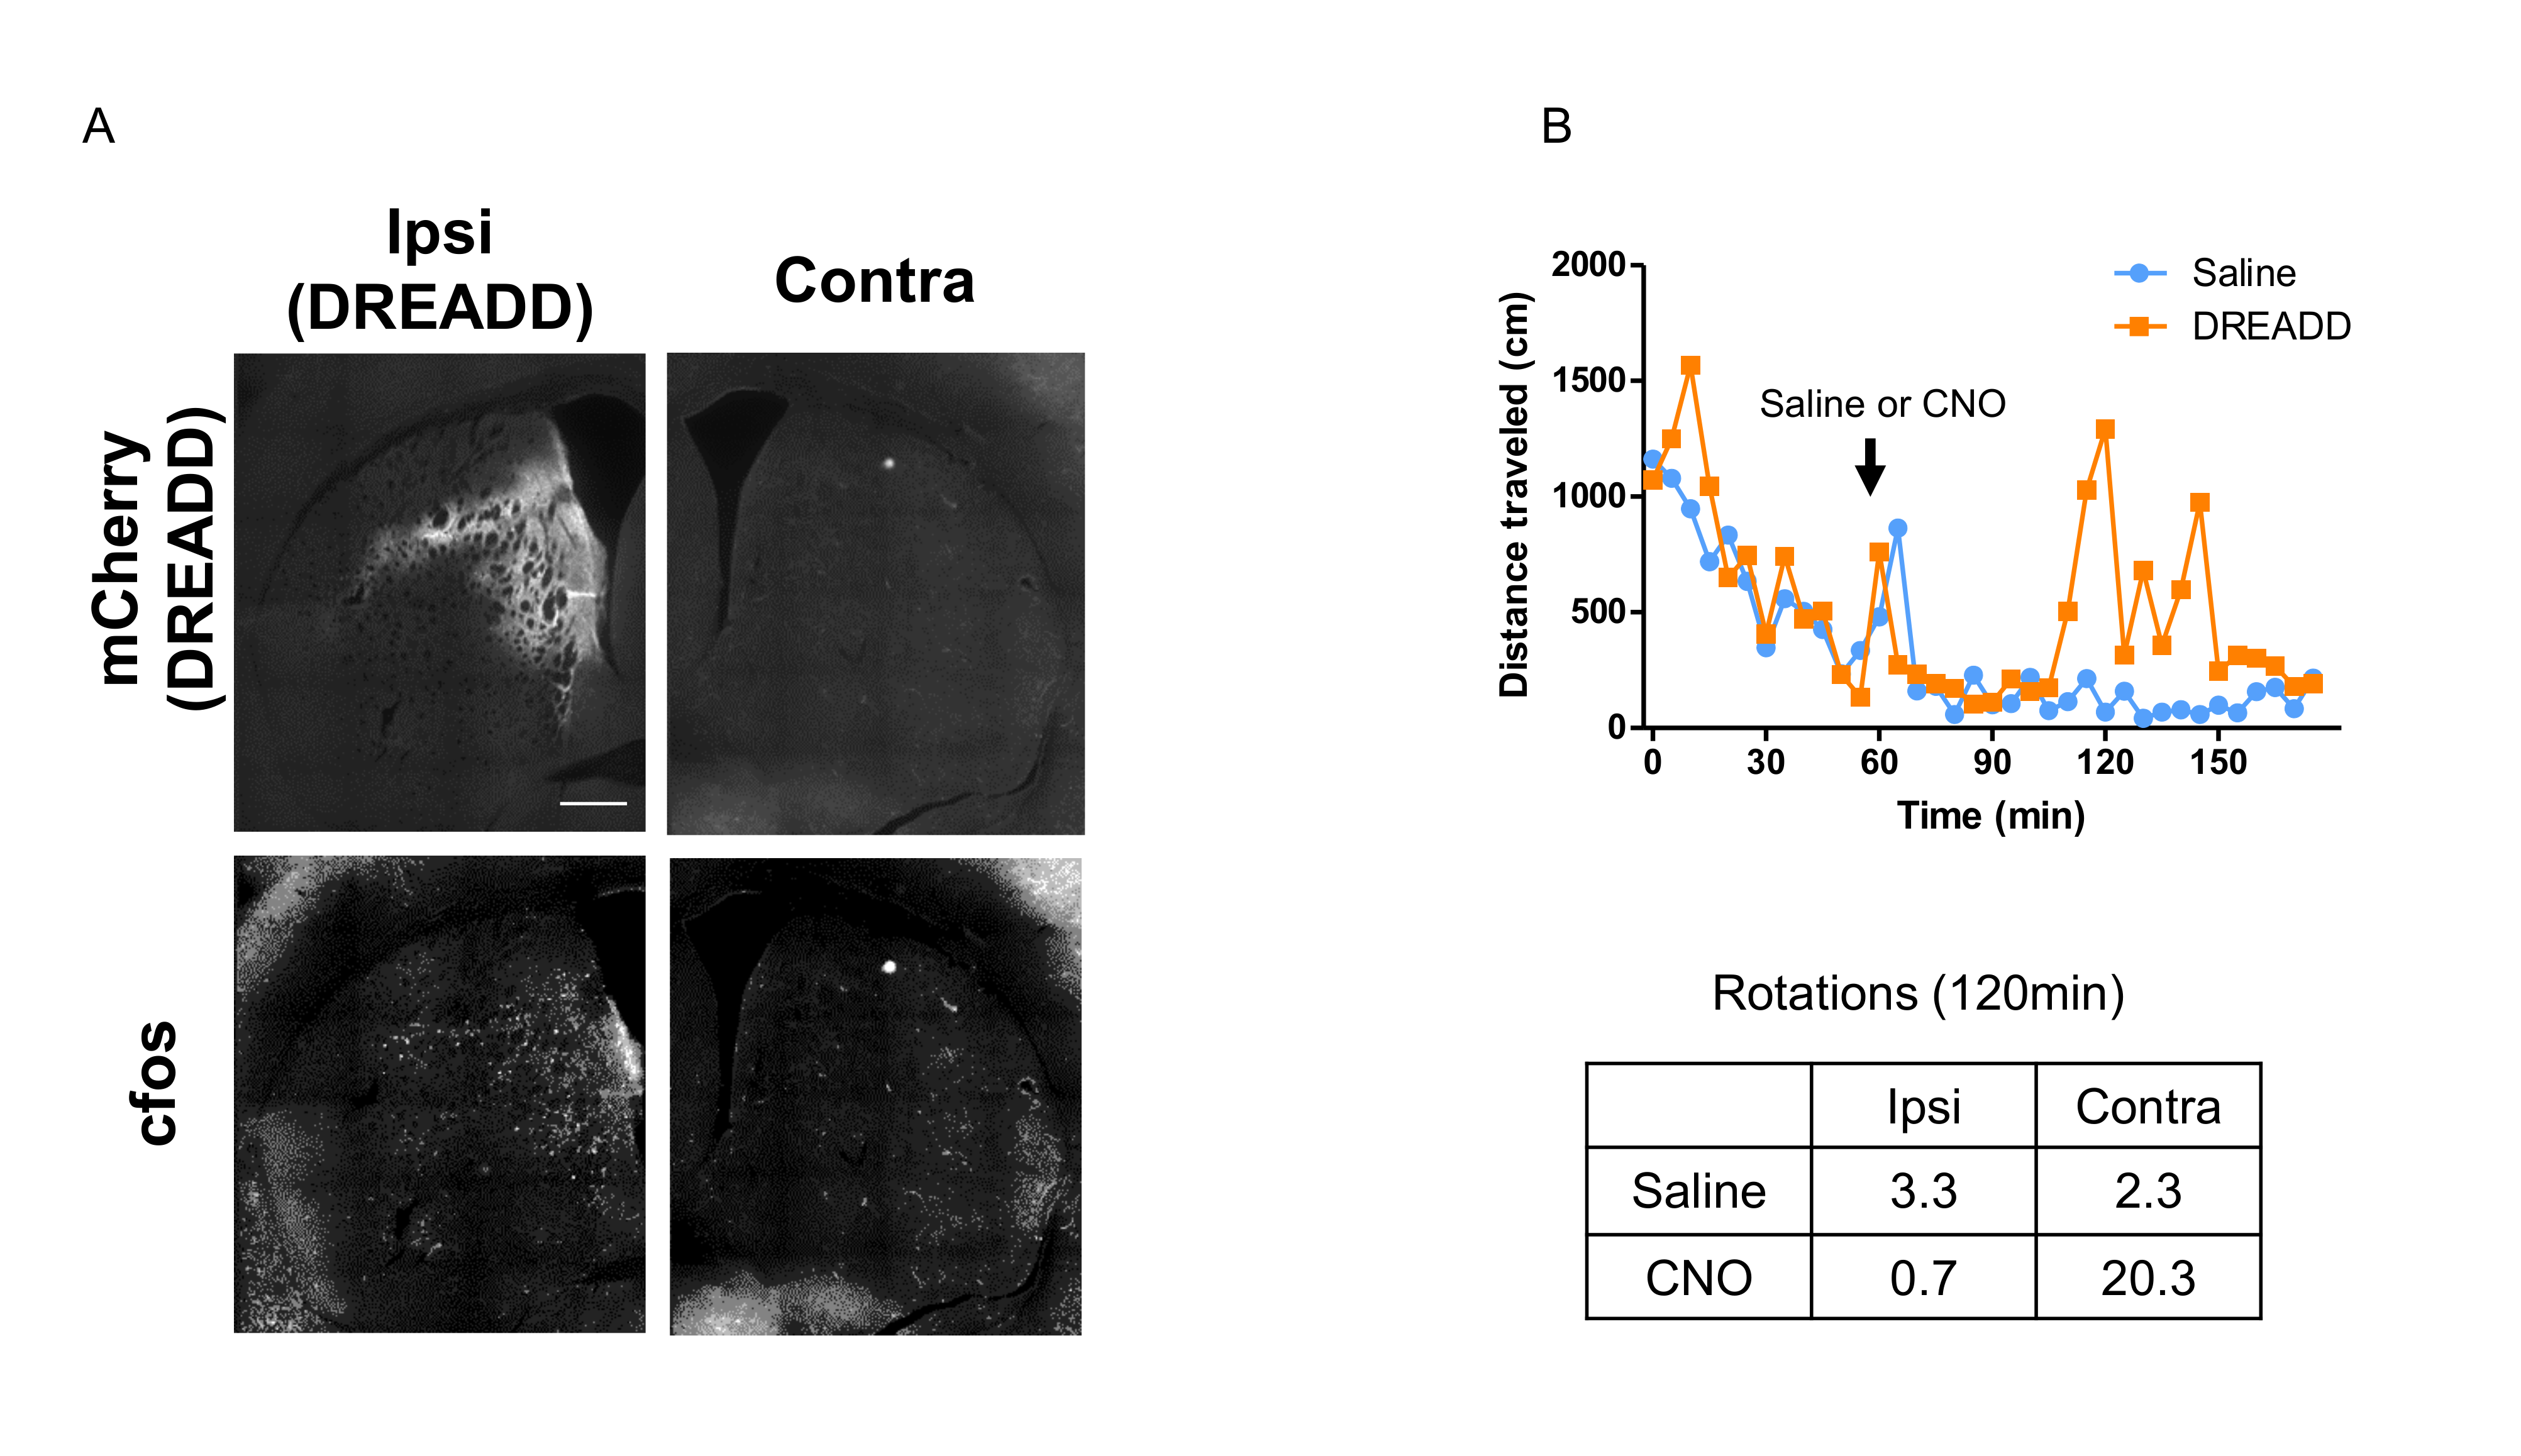
We confirm the successful AAV-transduction only in the left, but not right side of DS. The increased c-Fos expression was observed in the left DS following CNO injection (Fig.2A). The CNO increased the distance traveled and the rotational bias toward the side contralateral to the DREADD-transduction compared to the saline injection (Fig. 2B). The DREADD-fMRI had no susceptibility artifact in AAV-injected site (Fig. 3A). The averaged time-course of BOLD signals in left DS increased after CNO injection, much more than after saline injection (Fig. 3B). Then we investigated the correlation of BOLD signals with those in the left DS following CNO injection. The averaged time-courses within the DS were extracted (Figs. 4A) and they were used as the regressor in the regression analysis. The BOLD signals in the ipsilateral (to DREADD) DS (seed), insular cortex and nucleus accumbens showed the positive correlation. BOLD signals in ipsilateral internal globus pallidus and a part of substantia nigra was negatively correlated with that in DS (Fig. 4B). Interestingly, the part of the DS with high correlation corresponded to the DREADD expression regions (Fig. 4C, yellow arrows).Discussion
We showed BOLD increase and functional connectivity during the neuronal activation in the left DS by combining the behavior, immunohistochemistry and fMRI in the same mouse. Interestingly, the negative correlation was observed in the part of substantia nigra and internal globus pallidus, possibly reflecting the direct inhibitory connections from the DS 5. The advantages of DREADD-fMRI compared with other neurostimulation tools (e.g., deep brain stimulation and optogenetics) are that no opt/magnetic cable is required to activate the specific neurons. Hence, there is no susceptibility artifact in the stimulated region (Fig. 3A) in contrast to other techniques 6.Conclusion
We successfully installed DREADD-fMRI system in the DS-network study. This method could help the comprehensive understanding of the whole brain network.Acknowledgements
No acknowledgement found.References
1 Albin, R.L. et al. The functional anatomy of disorders of the basal ganglia. Trends Neurosci. 1995;18: 63–64
2 Soares-Cunha C, Coimbra B, Sousa N, Rodrigues AJ. Reappraising striatal D1- and D2-neurons in reward and aversion. Neurosci Biobehav Rev. 2016;68:370-386
3 Roth BL. DREADDs for Neuroscientists. Neuron. 2016;89(4):683-94
4 Uematsu A, Kitamura A, Iwatsuki K, et al. Correlation Between Activation of the Prelimbic Cortex, Basolateral Amygdala, and Agranular Insular Cortex During Taste Memory Formation. Cereb Cortex. 2015;25(9):2719-28.
5 Gerfen CR, Surmeier DJ. Modulation of striatal projection systems by dopamine. Annu Rev Neurosci. 2011;34:441-66.
6 Duffy BA, Choy M, Chuapoco MR, Madsen M, Lee JH. MRI compatible optrodes for simultaneous LFP and optogenetic fMRI investigation of seizure-like afterdischarges. Neuroimage. 2015;123:173-84.
Figures