1007
Simultaneous fMRI and multispectral fiber-photometry reveals neurovascular coupling during somatosensory, optogenetic, and chemogenetic stimulation of S1 principle neuronsTzu-Hao Harry Chao1, Weiting Zhang1, Brittany Katz1, Esteban Oyarzabal1, Sung-Ho Lee1, Guohong Cui2, and Yen-Yu Ian Shih1
1Biomedical Research Imaging Center and Department of Neurology, The University of North Carolina at Chapel Hill, Chapel Hill, NC, United States, 2Neurobiology Laboratory, National Institute of Environmental Health Sciences, NIH, Durham, NC, United States
Synopsis
In this study, we establish an experimental platform to simultaneously measure: a) genetically encoded calcium indicators (GCaMP) expressing on the excitatory neurons using fiber-photometry, b) cerebral blood volume (CBV) using fiber-photometry, and c) CBV using fMRI. By this platform, we assess neurovascular coupling (GCaMP and CBV comparisons) under chemogenetic stimulation of S1 excitatory neurons in a group of freely moving rats, and demonstrate this platform for concurrent GCaMP, photometry-CBV, and fMRI-CBV measurements with chemogenetic manipulation.
INTRODUCTION
Chemogenetics, a.k.a. Designer Receptors Exclusively Activated by Designer Drugs (DREADDs) utilizes engineered muscarinic or opioid receptors that remain silent until triggered by otherwise inert synthetic ligands.1 Pertinent to the unique strength of DREADDs for remote control of selected cellular activity, its combination with fMRI and optical measures has enabled a highly multiplexed platform for studying neurovascular coupling across spatiotemporal scales. In this study, we first establish an experimental platform to simultaneously measure 3 neurophysiological parameters, namely, a) genetically encoded calcium indicators (GCaMP) expressing on the excitatory neurons using fiber-photometry, b) cerebral blood volume (CBV) using fiber-photometry, and c) CBV using fMRI. Next, we compare two independent CBV measures (photometry versus fMRI) under somatosensory forepaw stimulation and optogenetic stimulation of the cortical (S1) excitatory neurons. We then apply this platform to assess neurovascular coupling (GCaMP and CBV comparisons) under chemogenetic stimulation of S1 excitatory neurons in a group of freely moving rats. Lastly, we demonstrate this platform for concurrent GCaMP, photometry-CBV, and fMRI-CBV measurements with chemogenetic manipulation.METHODS
The photometry platform and a representative spectrum with spectrally-resolved GCaMP6f and Rhodamine B peaks are shown in Figure 1A&B. Adult Sprague-Dawley rats (300-350g) were used in this study. Group 1 (n=3) received stereotactic injection of AAV5-CaMKIIα-Chronos-EYFP into the S1 (coordinate: AP=0.5mm, ML=3.7mm, DV=1mm) for optogenetic stimulation of excitatory neurons, and Group 2 (n=4) received injection of AAV9-CaMKIIα-GCaMP6f-WPRE-SV40 mixed with AAV8-CaMKIIα-hM3Dq-mcherry into the same S1 coordinate for chemogenetic stimulation and photometry recording of the same neuronal population (Figure 1C). After 4-5 weeks of viral expression, optic fiber was implanted into the S1. Rhodamine B isothiocyanate–Dextran was injected through the tail vein at 40mg/kg for CBV measurement. The depth of the fiber implantation was determined by concurrent recording of Rhodamine B signal for optimal response (Figure 1D). All recording experiments were started one week after the fiber implantation. Group 1 subjects underwent forepaw (9Hz, 0.5ms pulse-width, 3mA) or optogenetic (20Hz, 4ms pulse-width, 10mW) stimulation in separate sessions during simultaneous fMRI and fiber-photometry recording. The stimulation paradigm was 60s-OFF, 30s-ON, 60s-OFF, 30s-ON, and 60s-OFF. Group 2 subjects underwent two doses of clozapine-N-oxide (CNO) at 1 or 5mg/kg, i.p., to stimulate Gq-DREADDs in separate recording sessions. We first examined neurovascular coupling in fully conscious-state with a 100-min photometry recording, with CNO injected at 40 min after recording onset. We then perform simultaneous fMRI and fiber-photometry recording using identical experimental regimen on a separate day. All fMRI data were collected in a Bruker 9.4T MRI. Each rat was endotracheally intubated for ventilation, with body temperature, ETCO2, heart rate, and oxygen saturation continuously monitored and maintained in normal ranges. Continuous infusion of dexmedetomidine (0.05mg/kg/hr) and pancuronium bromide (0.5mg/kg/hr) with 0.5% isoflurane were used to maintain proper sedation. CBV fMRI data was acquired with 20 mg/kg Feraheme using a standard single shot GE-EPI sequence. Matlab was used for data analysis using the pipelines similar to that described elsewhere.2,3,4RESULTS & DISCUSSION
Both forepaw and optical stimulations evoked similar spatial activation (Figure 2A&B). Photometry-CBV showed more than 3-fold higher contrast-to-noise-ratio (CNR) when comparing with fMRI-CBV (Figure 2C-F&H-J). The response time-courses of both CBV measures exhibited high linear correlation (r=0.82 and 0.71 for forepaw and optogenetic stimulation, respectively (Figure 2 G&I). CNO administration at 5mg/kg, but not 1mg/kg, induced long-lasting increase of both photometry-CBV and GCaMP6f group-averaged responses (Figure 3A&C). We found that the SNR of photometry-CBV decreased with time at a time constant of ~166 min, likely due to Rhodamine B wash-out, whereas the SNR of GCaMP6f remains stable over-time (Figure 3B&D). We also show data from a representative subject in Figure 3E&F, and found that neurovascular coupling plot of CBV versus GCaMP6f depicted two distinct clusters, recapitulating responses before and after CNO administration (Figure 3G). We have also shown that the Rhodamine time-course is highly predictable by convolving GCaMP6f time-course with a transferred hemodynamic response function (HRF) (Figure 3H&I). Figure 4A shows confocal images of a representative subject with robust co-expression of Gq-DREADD and GCaMP6f in S1 neurons. Concurrent fMRI and Rhodamine/GCaMP fiber-photometry recordings (Figure 4B-D) show significant correlation between two independent CBV measurement using fMRI and photometry (r=.76, Figure 4E). We have also demonstrated the coupling coefficient between GCaMP6f and Rhodamine B measures (r=.47, Figure 4F). We expect this platform to be an attractive means to identify the contributions of select circuits and cell populations to hemodynamic signals during macroscopic fMRI measures, and serve as a useful steppingstone towards a more profound understanding of fMRI signaling mechanisms.Acknowledgements
We thank members of the Shih lab for valuable discussions concerning the studies described in this abstract. Our team is supported by NIMH R01MH111429, R41MH113252, R21 MH106939, NINDS R01NS091236, NIAAA U01AA020023, R01AA025582, NICHD U54HD079124, American Heart Association 15SDG23260025, and Brain & Behavior Research Foundation.References
1 Roth BL. DREADDs for Neuroscientists. Neuron. 2016;89(4):683-694. doi:10.1016/j.neuron.2016.01.040. 2 Van Den Berge, Nathalie, et al. "Functional circuit mapping of striatal output nuclei using simultaneous deep brain stimulation and fMRI." NeuroImage 146 (2017): 1050-1061. 3 Broadwater, Margaret A., et al. "Adolescent alcohol exposure decreases frontostriatal resting‐state functional connectivity in adulthood." Addiction Biology (2017). 4 Decot, Heather K., et al. "Coordination of brain-wide activity dynamics by dopaminergic neurons." Neuropsychopharmacology (2016).Figures
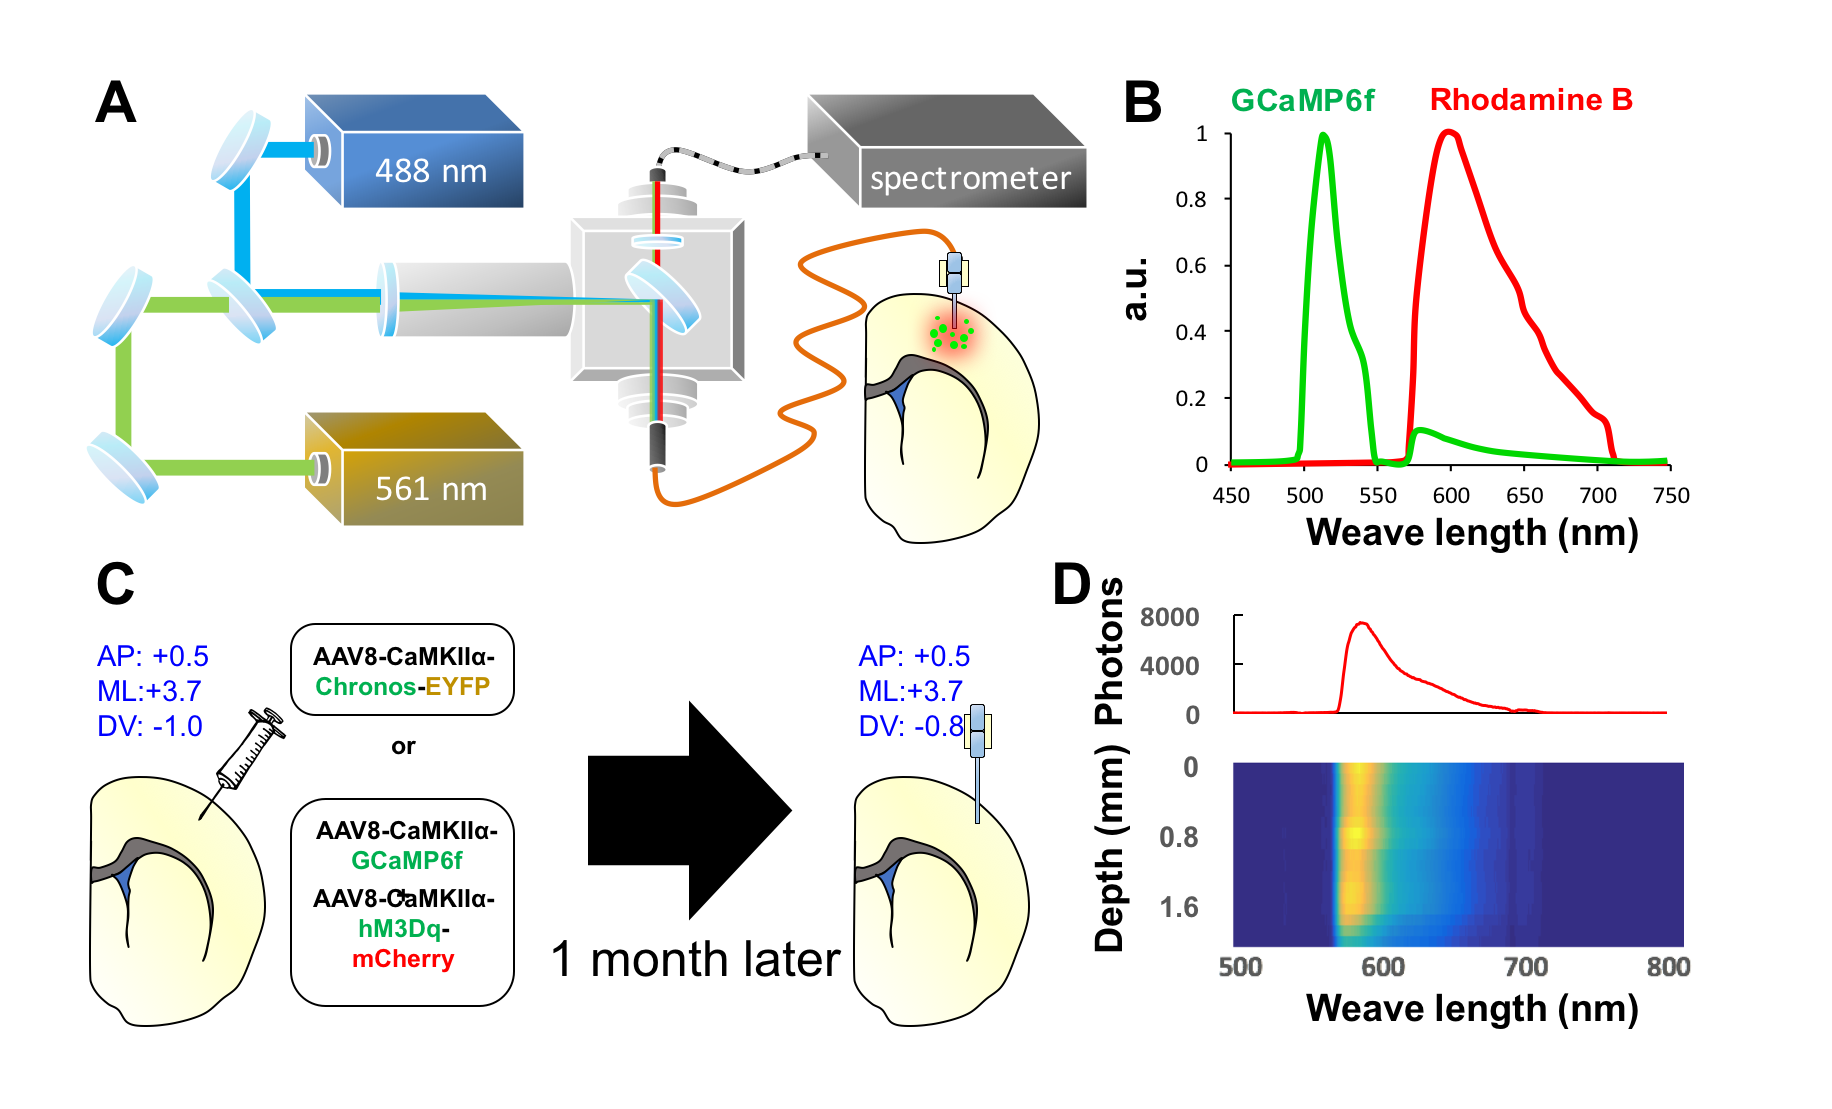
Fig.1 (A) The 488 nm laser is used for GCaMP excitation and optogenetic
stimulation, and the 561 nm laser is used for Rhodamine excitation. Combined
laser beams launched into the rat via a multimode optic fiber. The emission
fluorescent signal travels back through the same fiber and launched into an AR-coated
cable to spectrometer. The system is synchronized with MRI by an Arduino
board. Background spectrum was subtracted before connecting the fiber to
animal. (B) Representative spectrum showing spectrally-resolved
GCaMP6f and Rhodamine B peaks. (C) Coordinates for stereotacic
surgeries. (D) Photometry-guided optical fiber implantation. Color-plot
represents step-wise Rhodamine B spectrum recording at
different cortical depth.
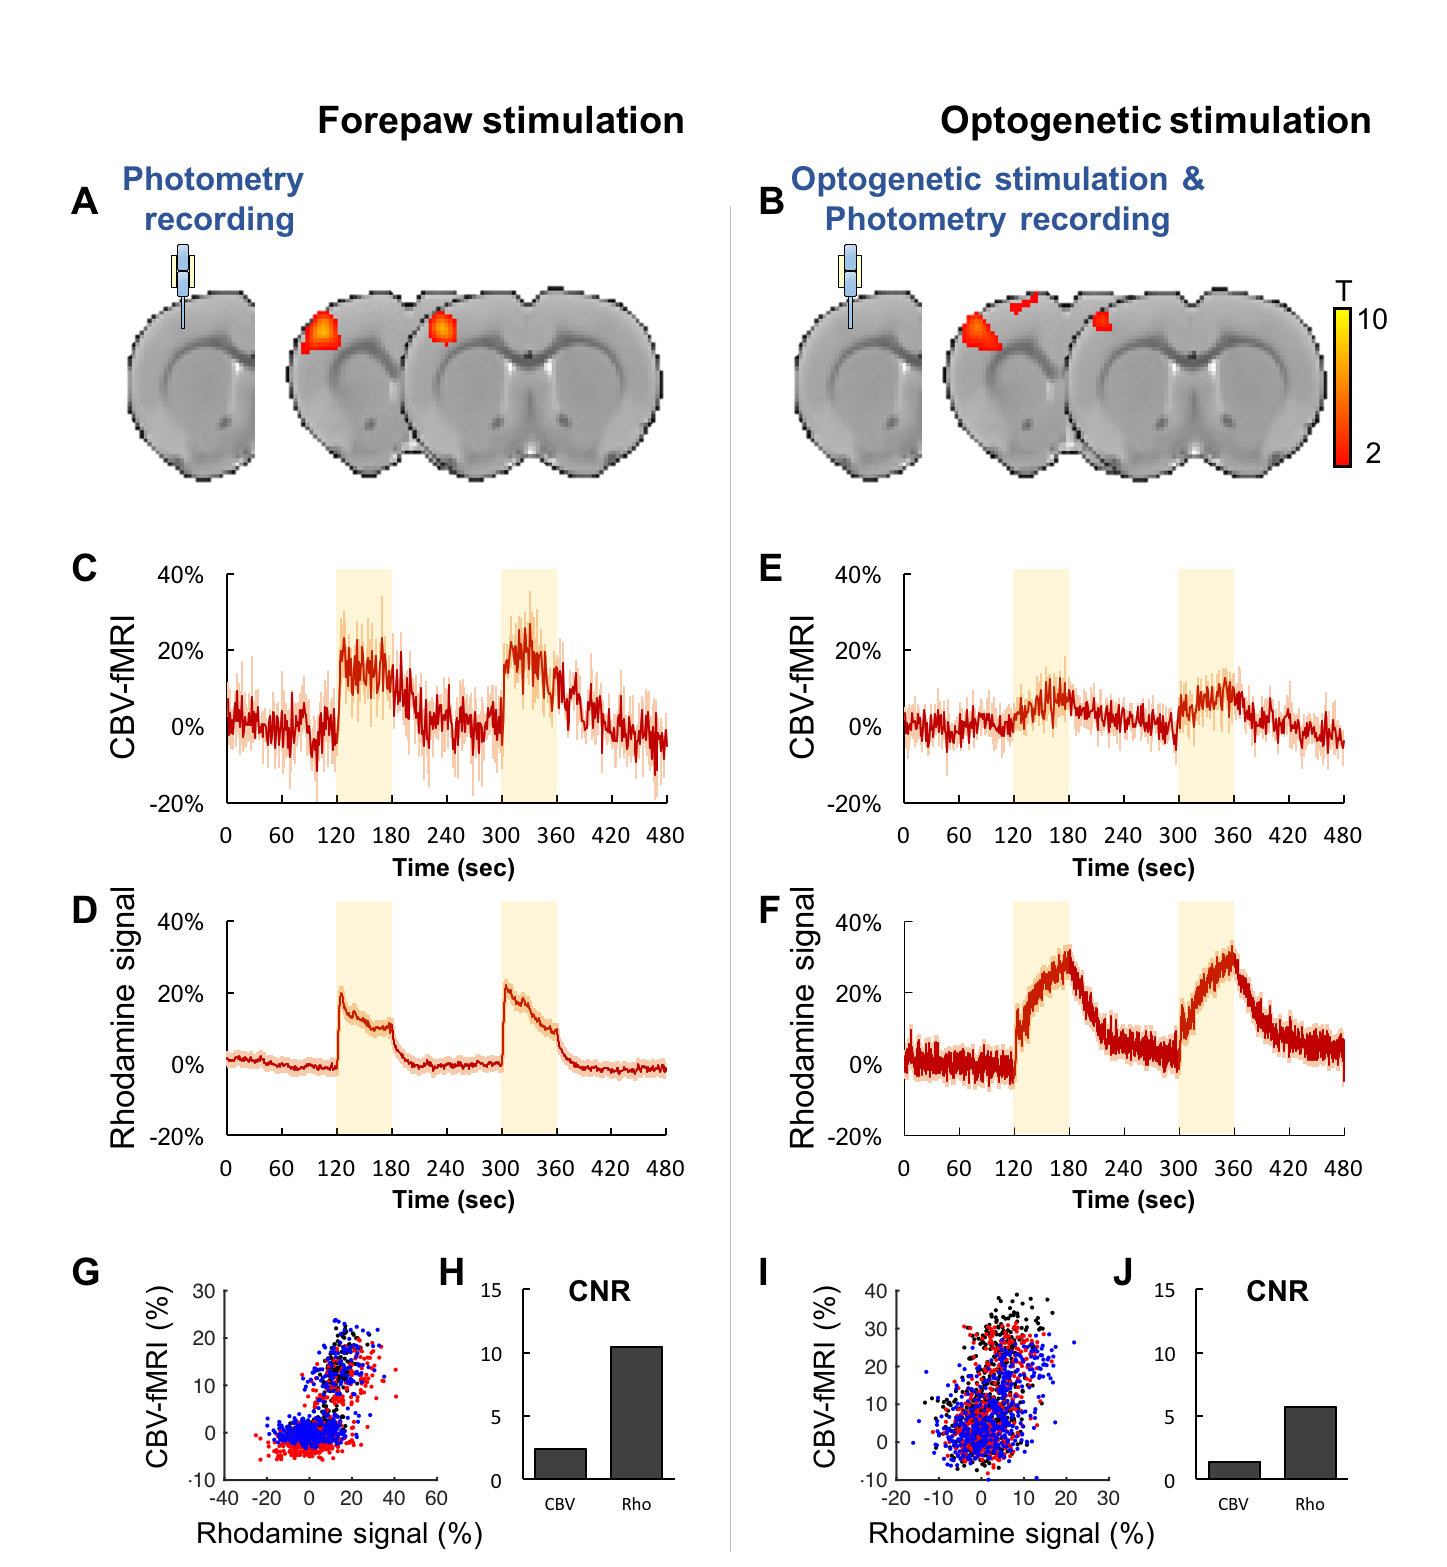
Fig.2 Concurrent fMRI and fiber-photometry recordings of CBV during forepaw or
optogenetic stimulation. (A&B) fMRI activation maps. (C-F)
Group-averaged fMRI and photometry time-course responses to stimulation. (G&I)
Correlation plots of CBV measurements from fMRI versus photometry, data from
different subjects were represented by distinct colors. (H&J)
Contrast-to-noise-ratio (CNR) of fMRI versus photometry CBV measurement.
Photometry measurement shows at least 3-fold higher CNR than fMRI.
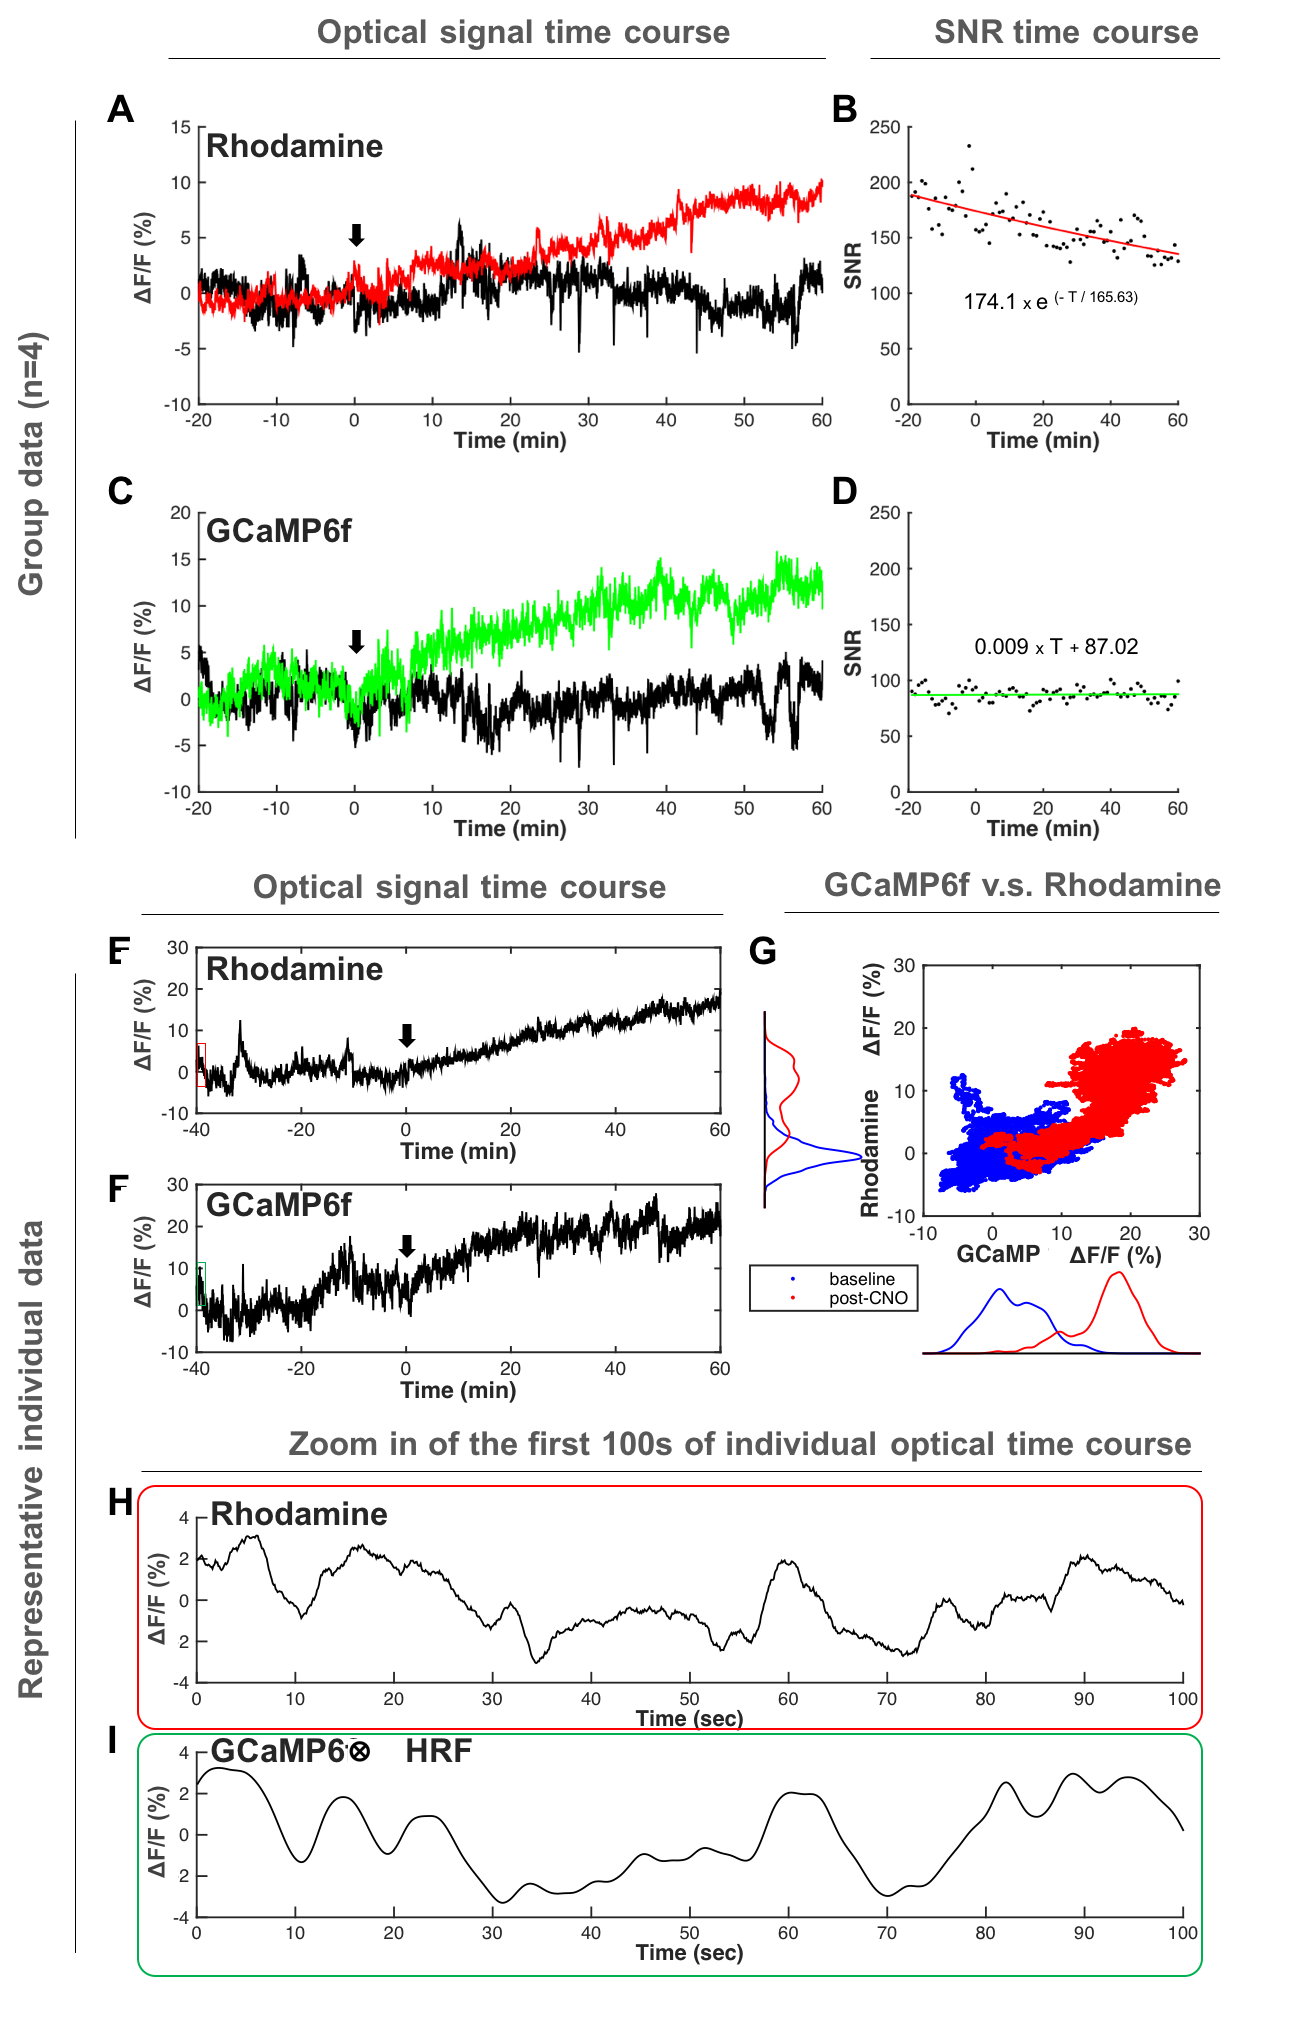
Fig.3 Fiber-photometry recordings of CBV and neuronal activity during
chemogenetic stimulation. (A&C) Photometry recording time-courses.
Red and Green traces show responses to 5 mg/kg CNO whereas black traces show
responses to 1 mg/kg. (B&D) Rhodamine wash-out causes CBV SNR drop over-time,
whereas GCaMP SNR is maintained. (E&F) Time-courses from a
representative subject. (G) Neurovascular coupling plot reveals two
distinct clusters, recapitulating responses before and after CNO
administration. (H&I) Rhodamine time-course is predictable by GCaMP
time-course convolving with a derived hemodynamic response function (HRF).
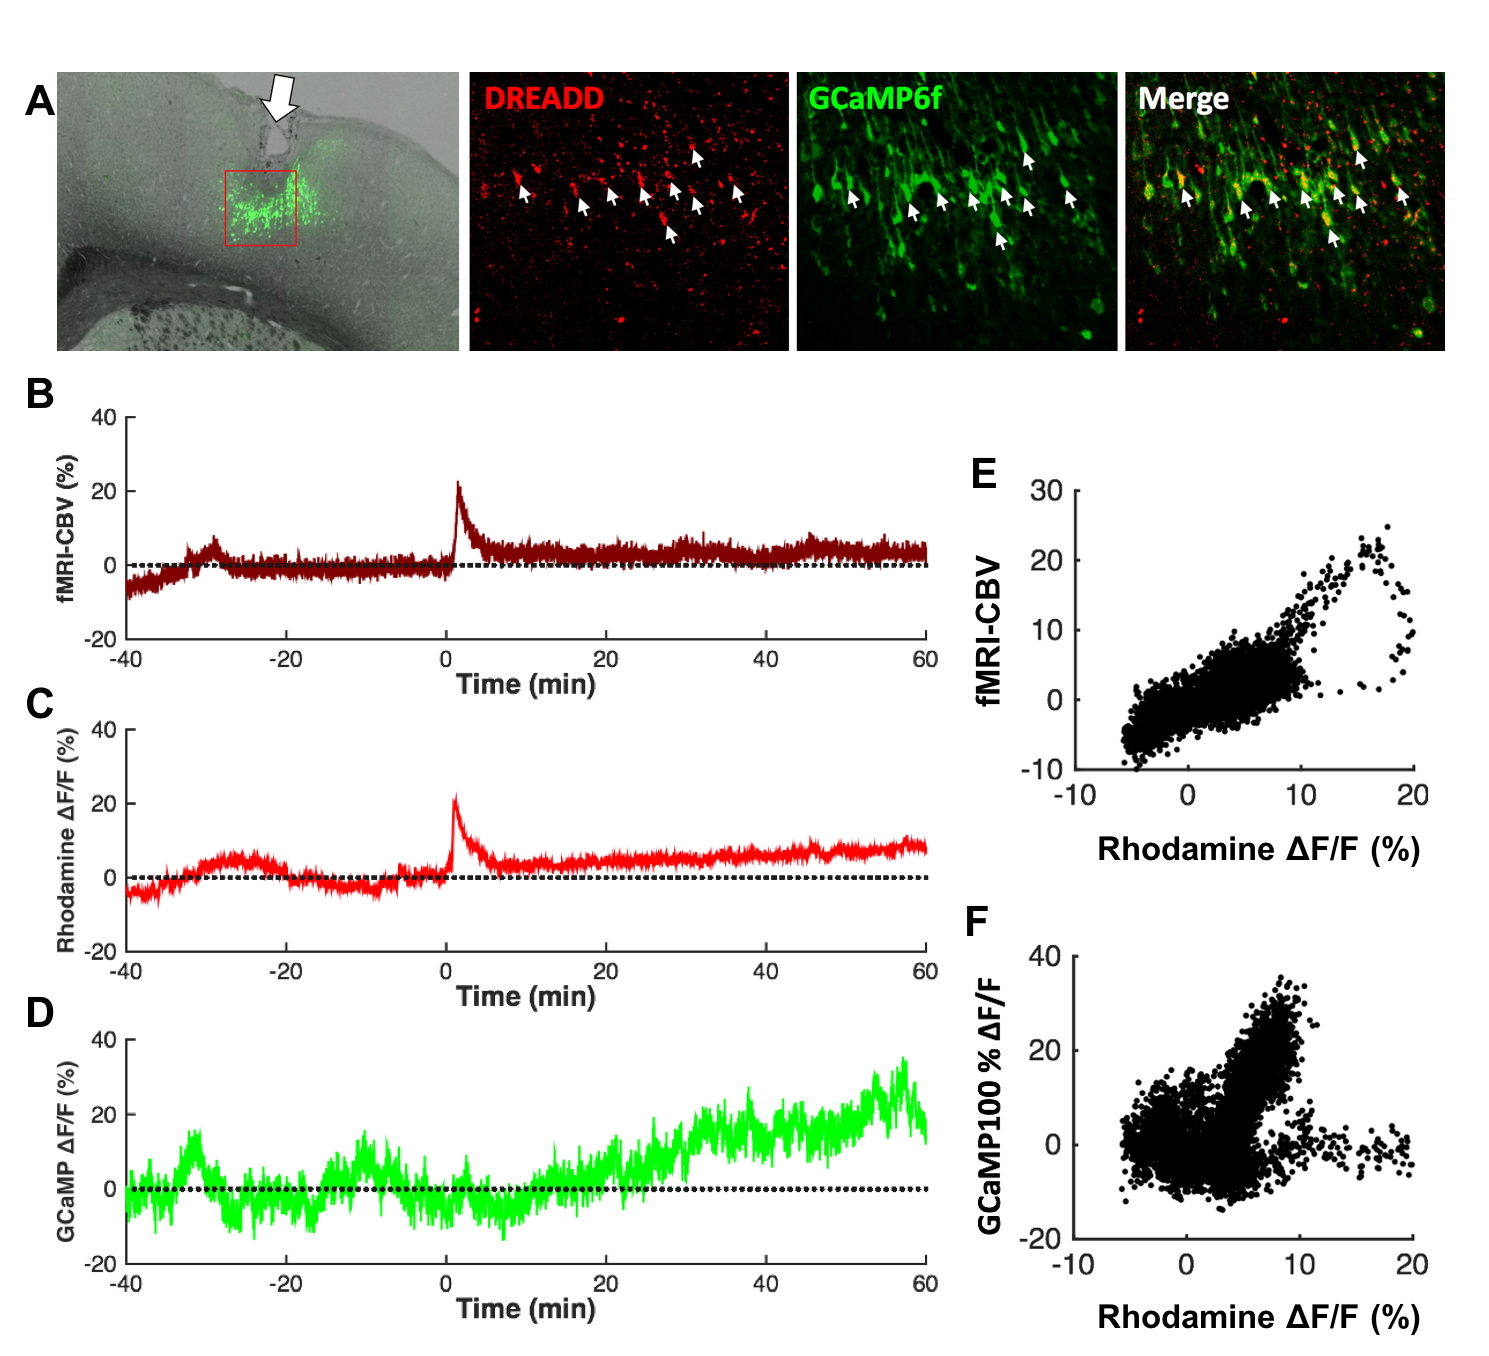
Fig.4 Concurrent fMRI and fiber-photometry recordings of GCaMP6f and CBV
during chemogenetic stimulation. (A) Confocal images of a representative
subject with robust co-expression of Gq-DREADD and GCaMP6f in S1 neurons. (B-D)
CNO-evoked CBV-fMRI, GCaMP6f, and CBV-photometry responses. (E)
Significant correlation between two independent CBV measurement using fMRI and
photometry (R=.76). (F) Significant correlation between GCaMP6f and
Rhodamine B photometry measures inside the MRI.