1006
Monitoring the Complete Scattering Matrix of a Parallel Transmit Coil during Image Acquisition for Retrospective Cardiac Gating at 7T MRI1University of Oxford Centre for Magnetic Resonance Research, Oxford University, Oxford, United Kingdom
Synopsis
We propose a new monitoring scheme that enables simultaneous measurements of the complete scattering matrix of a pTx coil during image acquisition by modifying the RF-pulse without prolonging the image sequence and without spin distortion. We show that the use of this monitoring schemes and the measured scattering matrix enable a higher SNR in the estimated cardiac scattering signal, than using RF-reflection of the normal imaging pulse as in previous work. Preliminary results in 7T MRI are shown with successfully, retrospectively gated 2D-CINE images using the proposed method.
Introduction
The current go-to method for cardiac MRI synchronisation is the ECG which is possible at 7T MRI, but lead re-positioning is frequently required and increases subject setup time.1 Recently, we have shown that the scattering of an eight channel pTx coil can be used for cardiac signal estimation and cardiac gating, using a dedicated monitoring sequence 2 or the scattering coefficients of the imaging RF-pulse 3, which is dependent on B1+ shim.4 In this work, we propose a monitoring scheme that enables the measurement of the scattering matrix (S-matrix) of a pTx coil during normal image acquisition to provide a B1+ shim independent cardiac signal without the need for additional monitoring pulses (as in reference (2)) or measurements prior to the imaging protocol.Methods
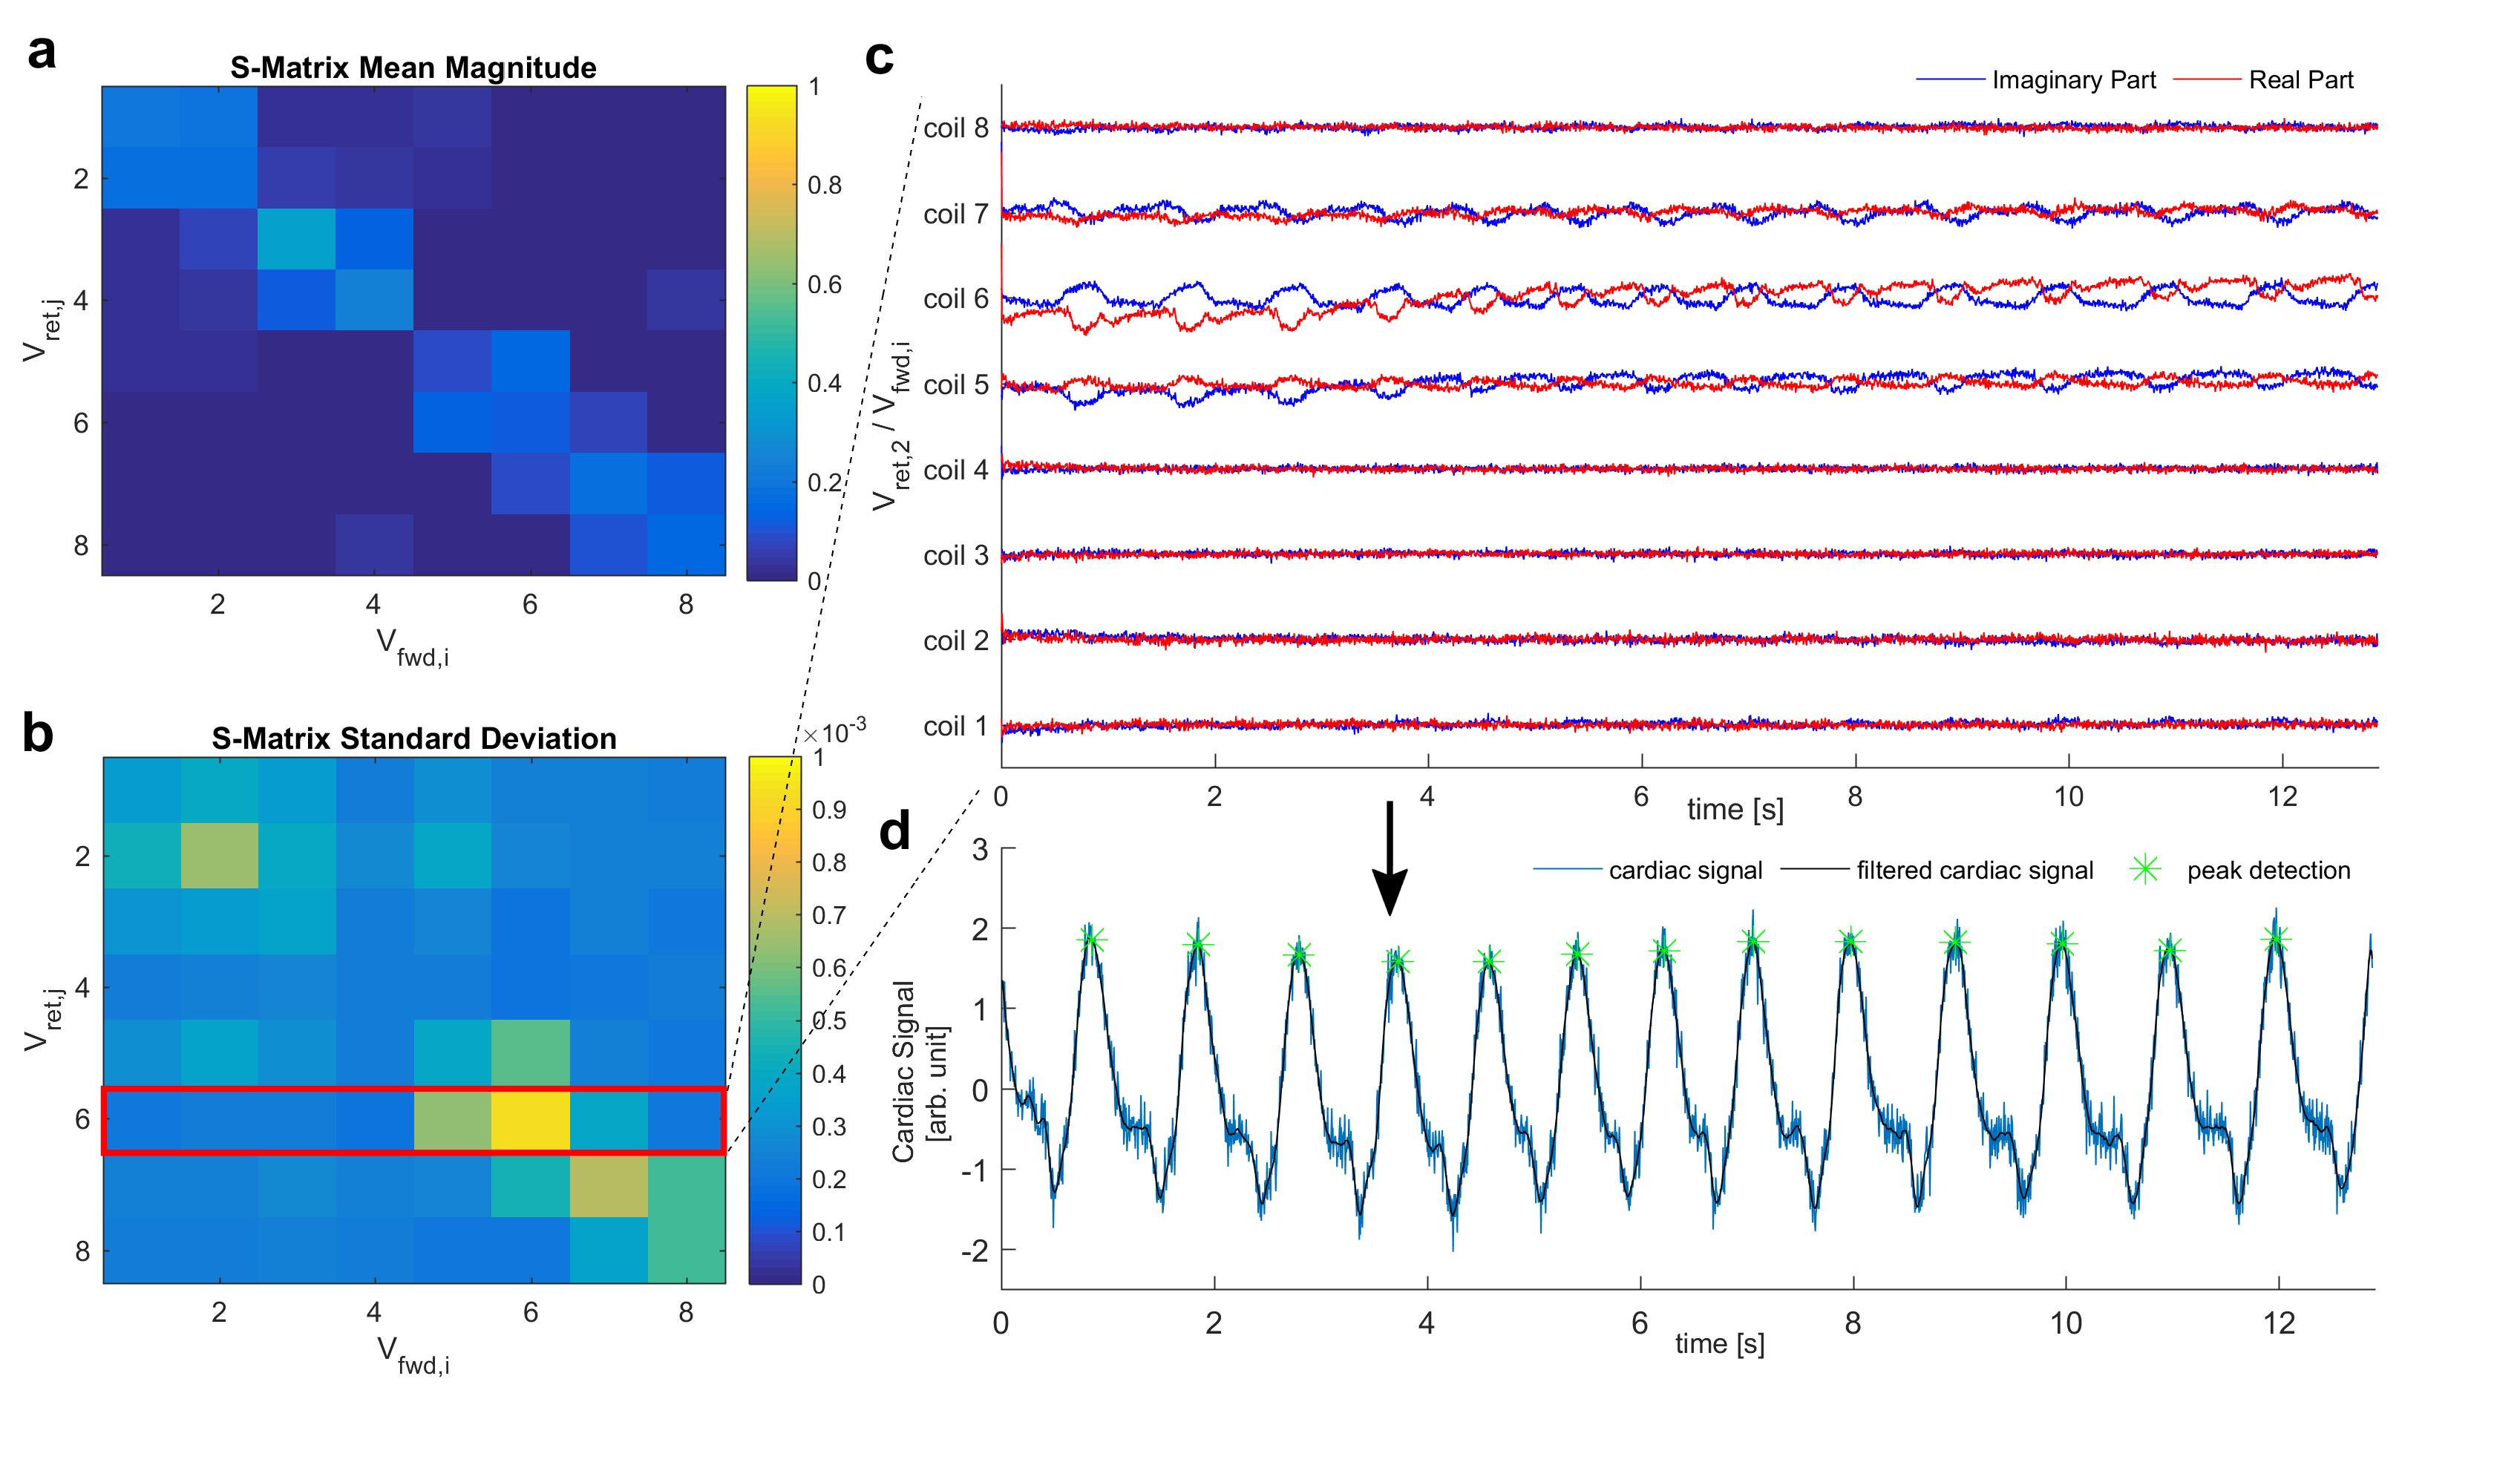
Measurements were made on a 7T MRI Scanner (VB17 Step 2.3, Siemens, Erlangen, Germany) with an 8-channel, dipole cardiac transmit/receive array (MRCoils, Netherlands) on one subject. Directional couplers (DICOs) are built into each of the RF-transmission lines, as part of the pTx safety system, to measure the forwarded and returned RF-waveforms. The S-matrix describes the N-port electrical network of the pTx coil, loaded by the human body, and defines the fractional, returned voltage $$$V_{i,j,ret}$$$ on each channel i which originates from the forward voltage $$$V_{j,fwd}$$$ on channel j (more details in reference (2)):
$$V_{i,j,ret} = S_{i,j} V_{j,fwd}$$
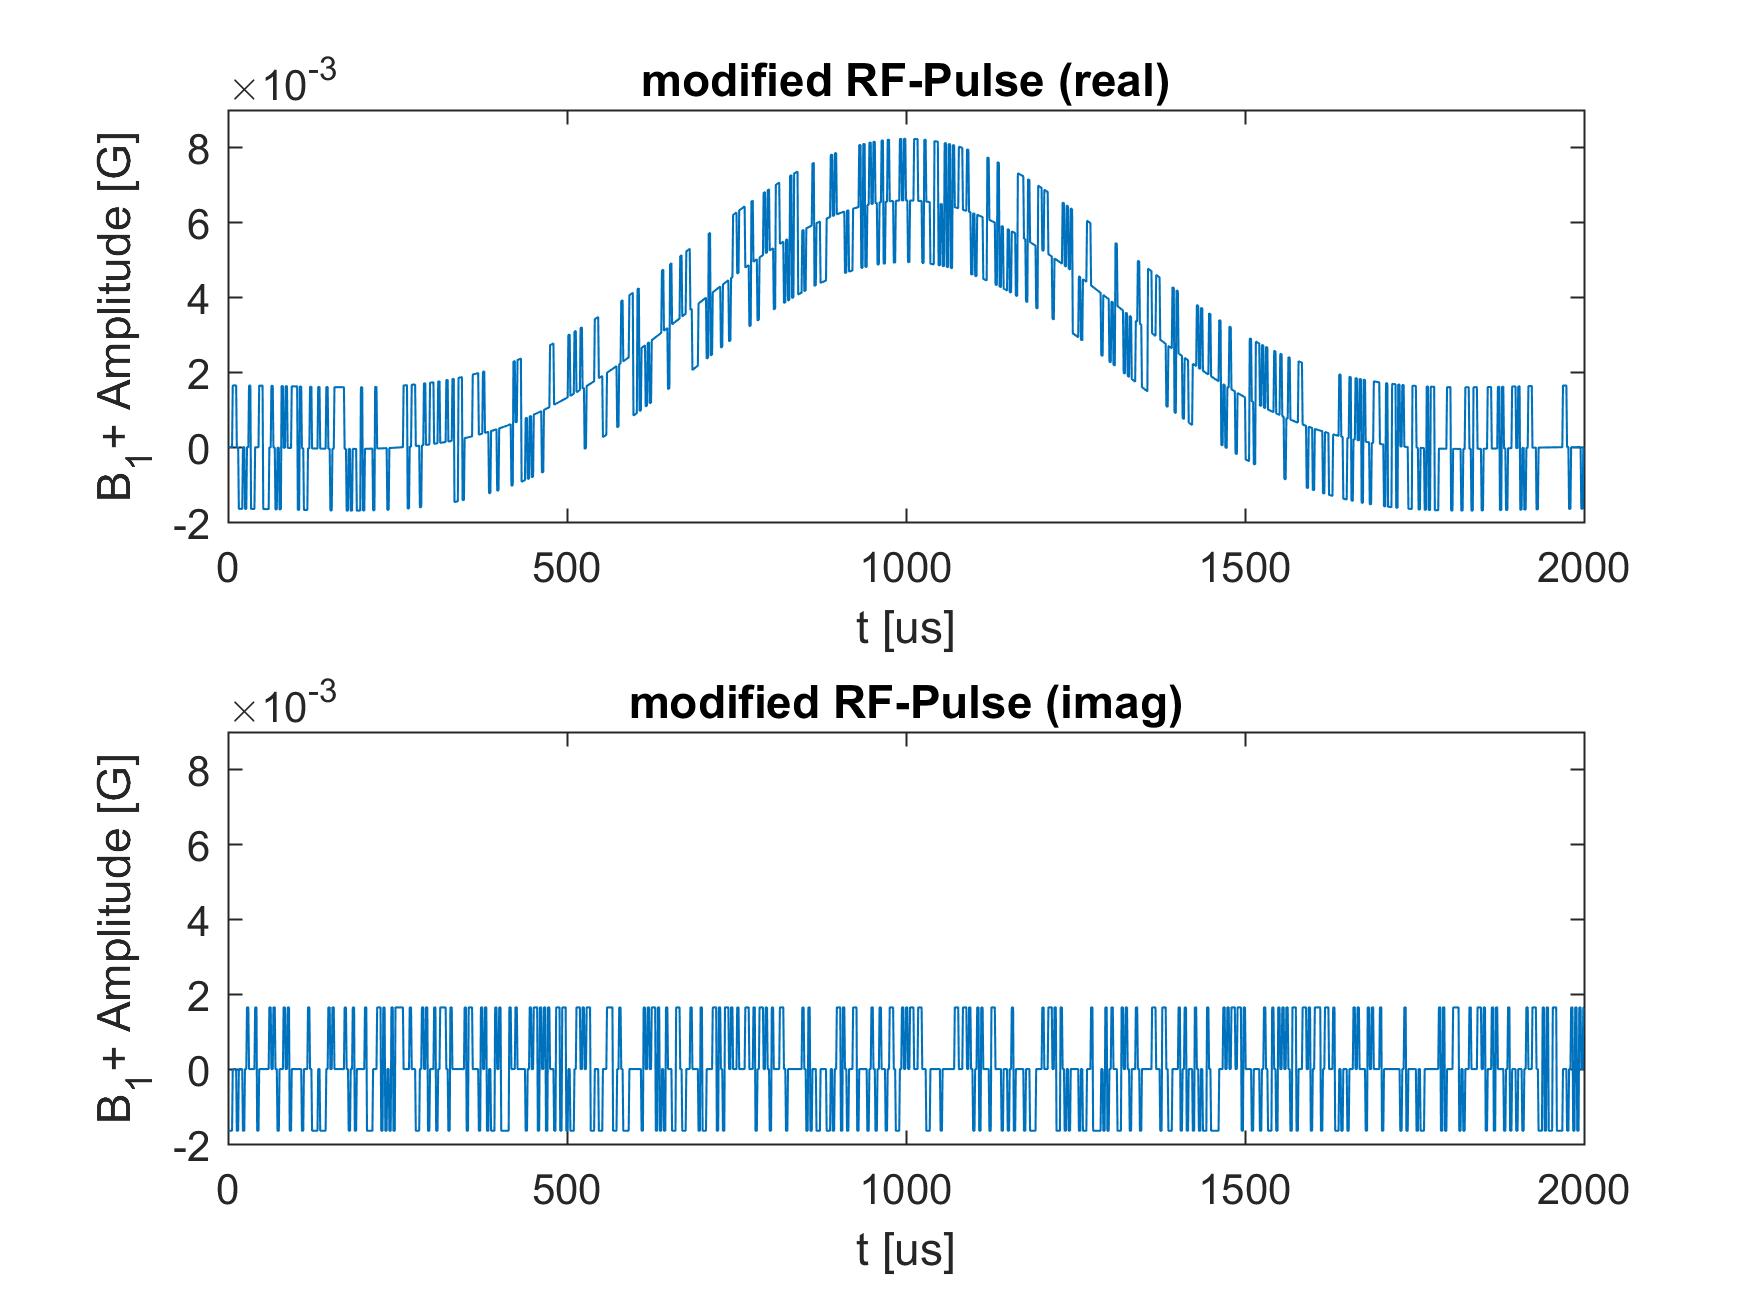
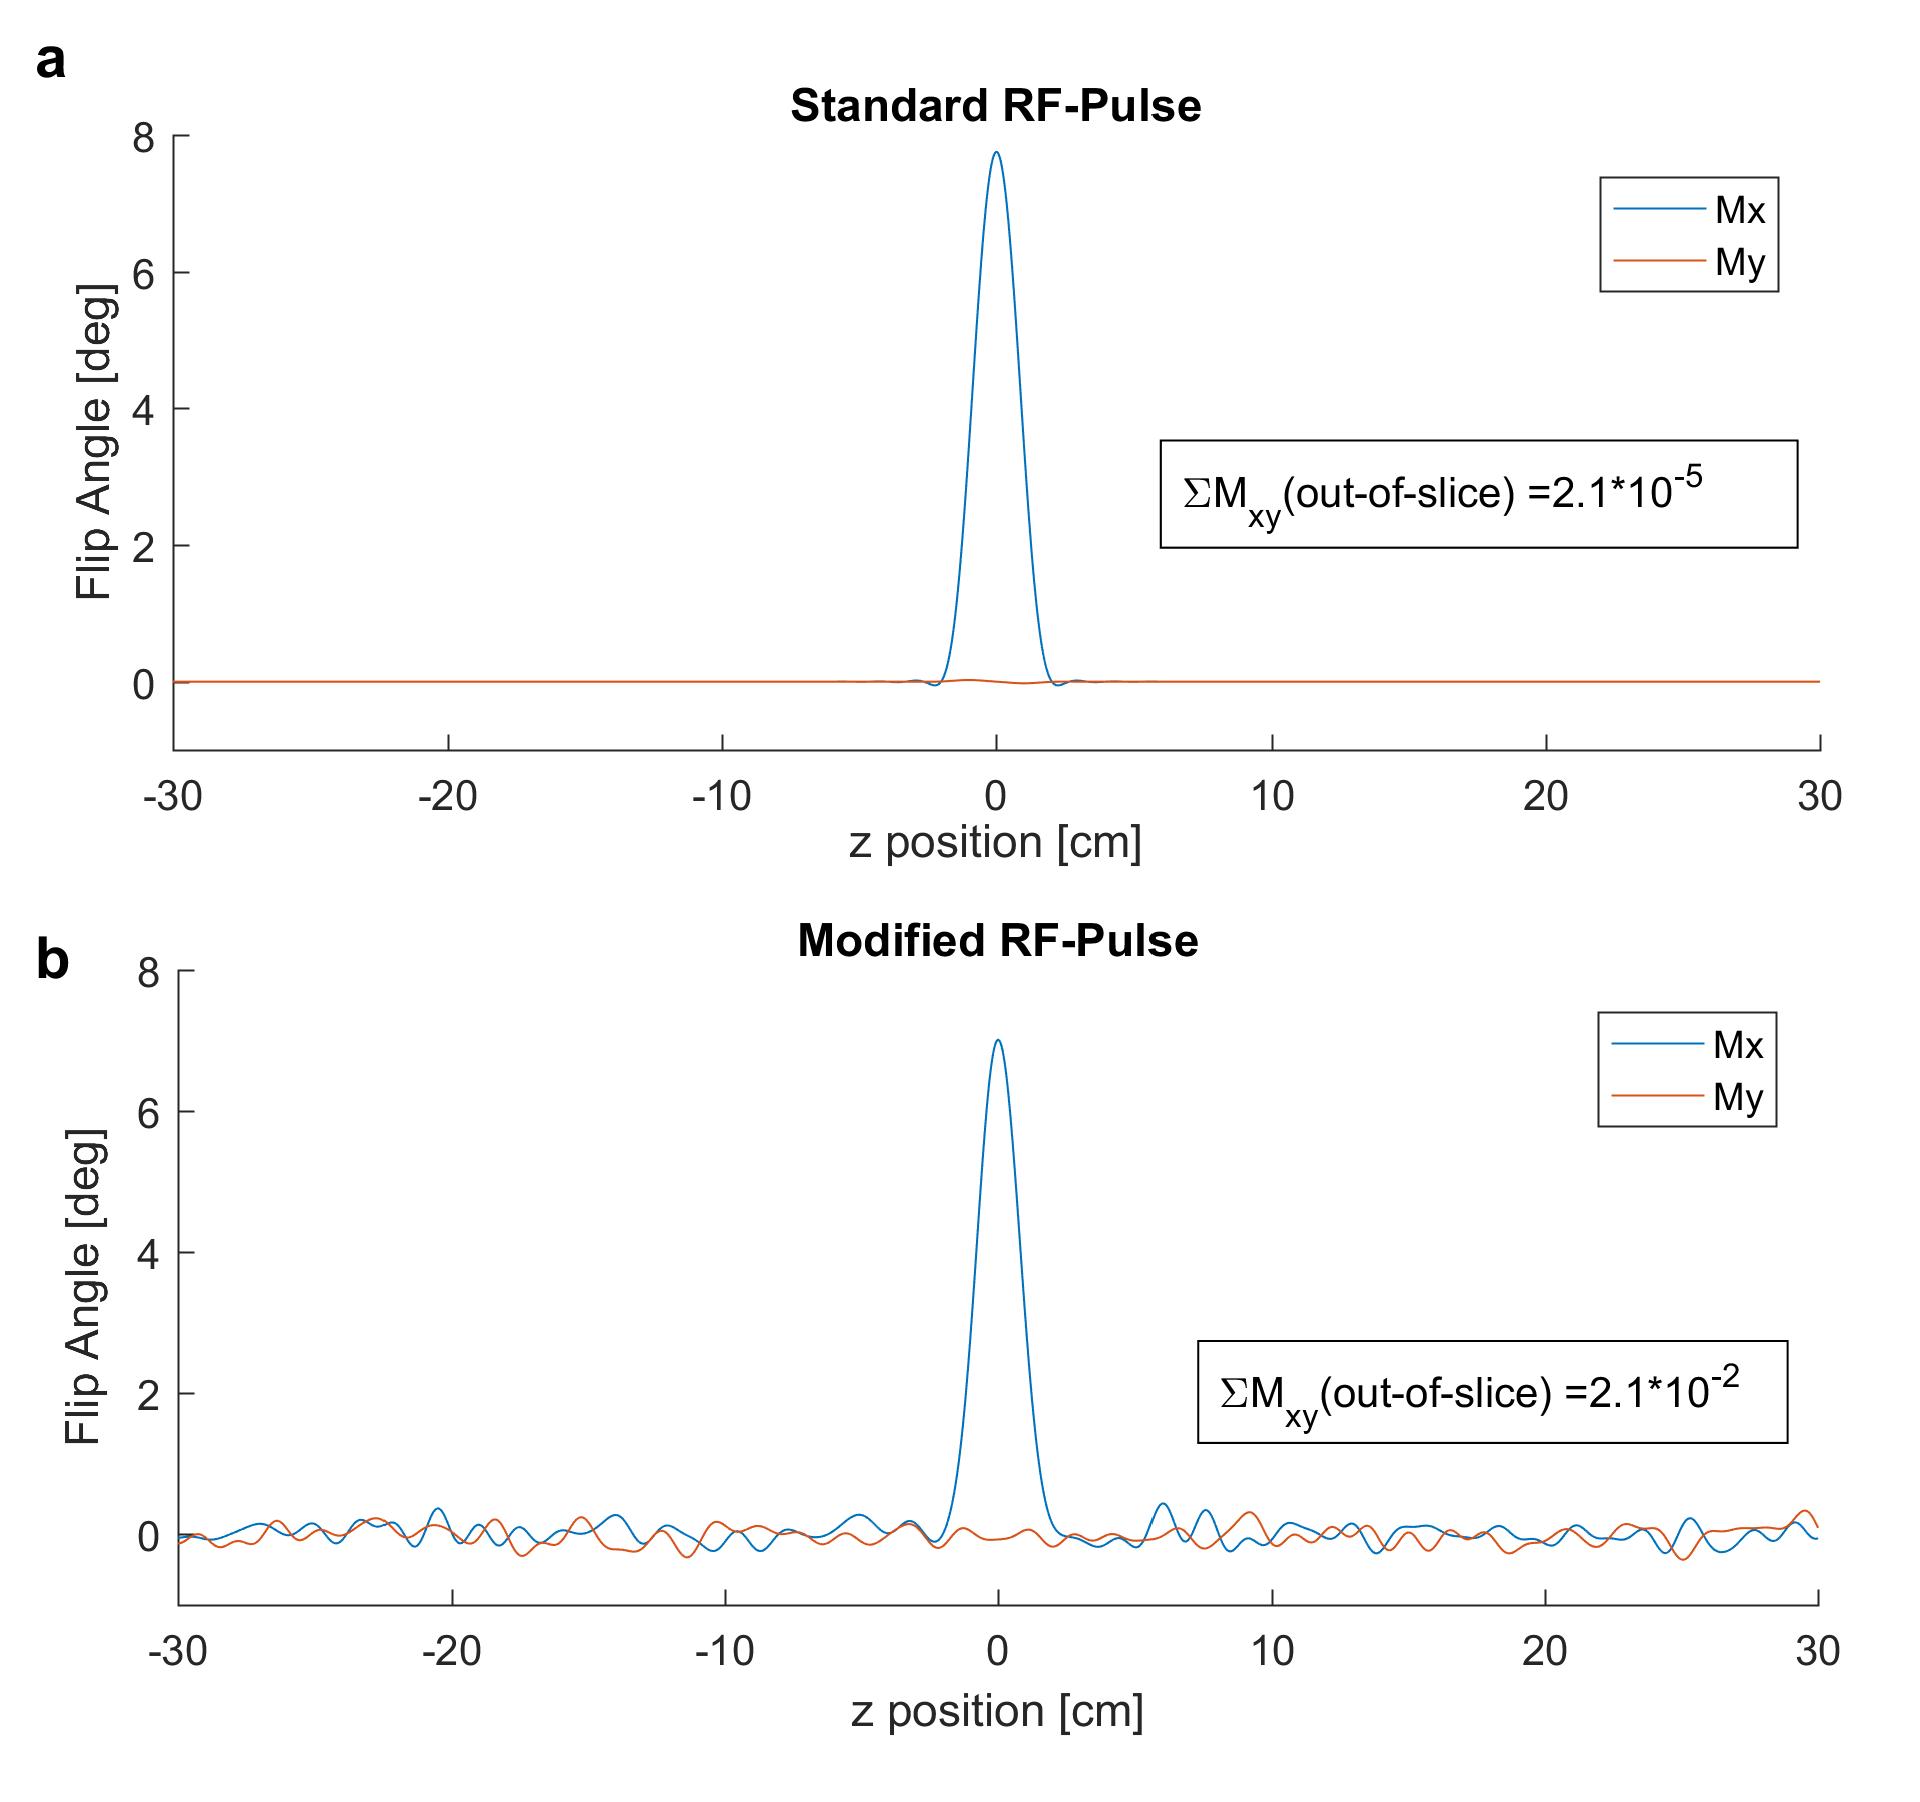
In this work, the S-matrix was measured with a series of small, ultra-short (3us) rectangular RF-pulses which were overlaid on the standard imaging RF-pulse. The monitoring amplitude ranged from 5% to 20% of that of the imaging RF-pulse and was randomly alternated on the real and imaginary part of the pulse ([Real, Imaginary] = [1,0],[0,1],[0,-1],[-1,0], compare Figure 1) for each transmit channel. With each channel having a different random pattern, the identification of each fractional, returned voltage become possible and thus, the linear equation system as in equation 1 can be solved for using MATLAB with a least-squares solution for each RF-pulse. Bloch simulations have been carried out to investigate the magnetisation effects of the pattern (figure 3)
We identified the cardiac signal using an independent component analysis as in reference (2). The noise was calculated by subtracting the filtered (Savitzky-Golay filter5) from the unfiltered cardiac signal and taking this standard deviation as the magnitude of noise. The mean peak amplitude of the cardiac signal, divided by this noise, is the SNR of the cardiac signal.
Imaging was performed using a 2D GRE cine sequence where the RF-pulses were modified, as described above, to enable simultaneous S-matrix measurements. Either, the extracted cardiac signal or ECG, was utilized for cardiac gating and the k-space data was re-binned accordingly. The PULSAR MATLAB toolbox6 was used for image reconstruction.
Results
An example of the S-matrix, calculated using the modified RF-pulses, is shown in figure 2. The extracted cardiac signal had a SNR of 4.4, 7.5, 10.4 and 13.7 for a spike amplitude of 5%, 10%, 15% and 20% of that of the imaging RF-pulse, respectively. Using the reflection coefficient 4 of the normal imaging RF-pulse, gave an SNR of 7.9.
Bloch simulations of the modified RF-pulses revealed a broad bandwidth excitation with white noise like excitation (compare figure 3). For a targeted flip angle of 8 degrees, the induced out-of-slice net magnetisation remained close to zero with the sum of Mxy of 0.02 degrees and the added energy per RF-pulse was 0.5%, 2.8%, 6.7%, 13.9% for an overlaid monitoring amplitude of 5%, 10%, 15% and 20%.
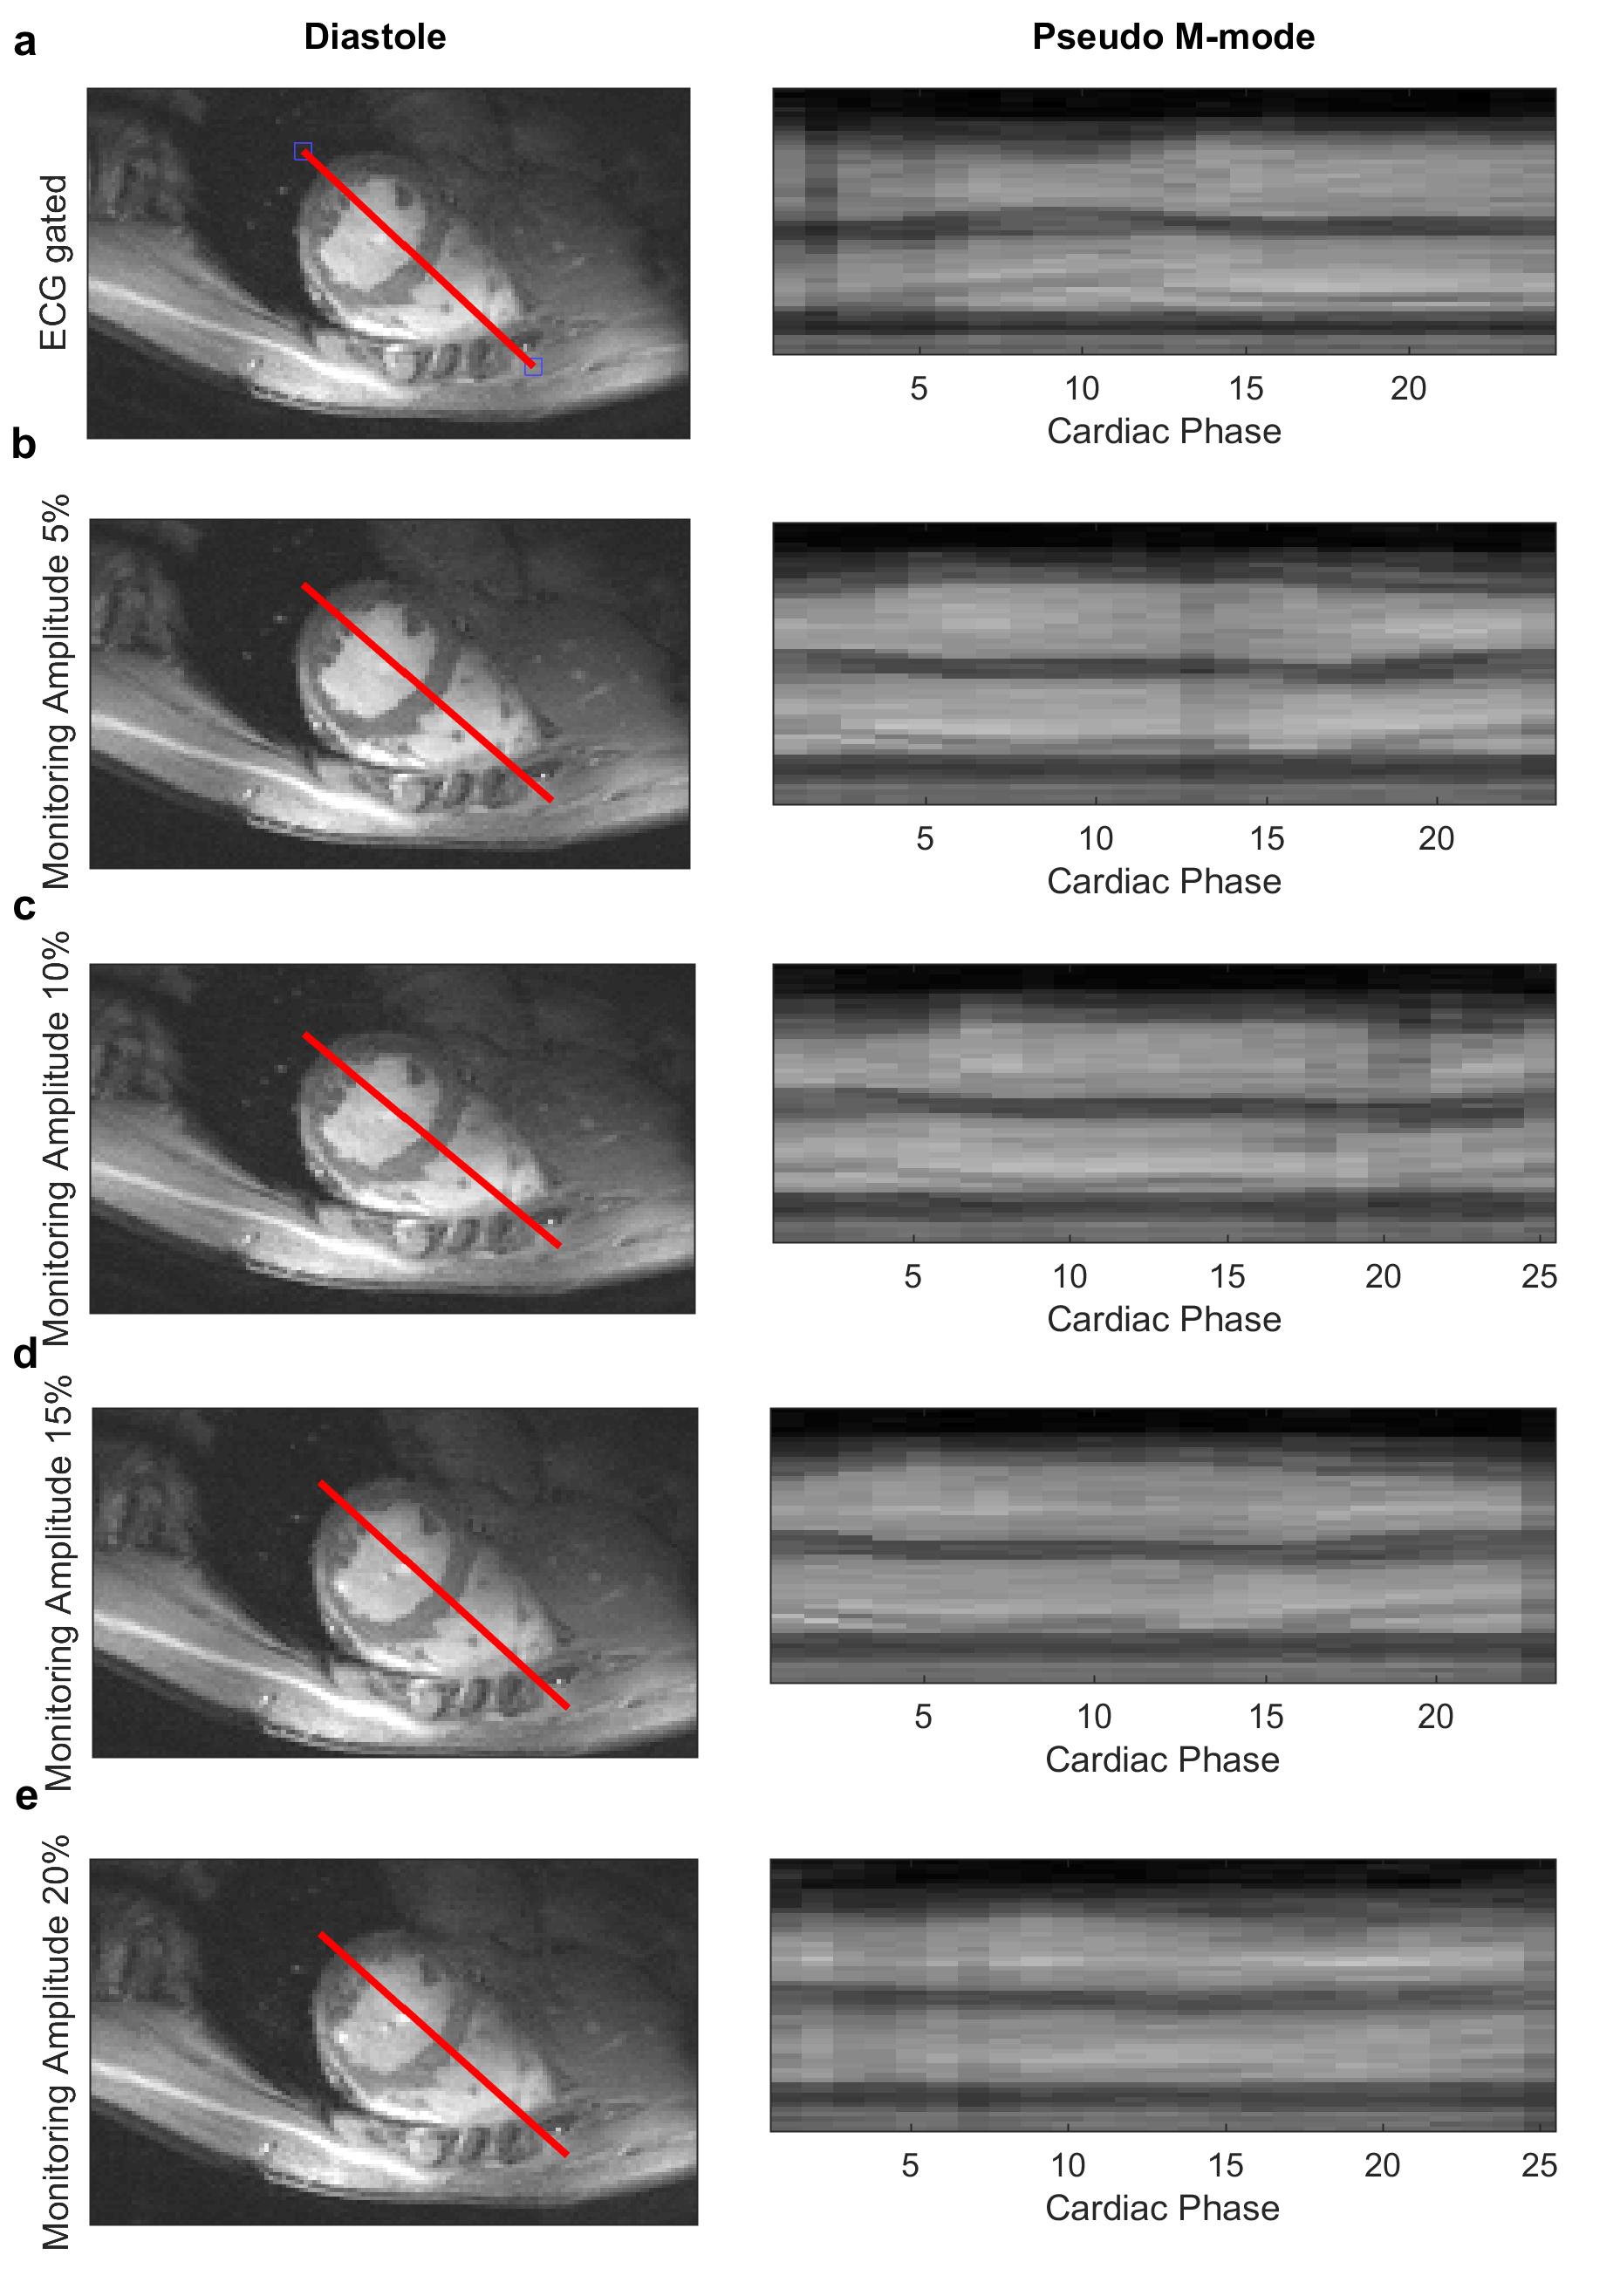
All images were successfully reconstructed with minimal artefacts or blurring (compare figure 4).
Discussion
The measurement of the S-matrix of a pTx coil during image acquisition is possible and the cardiac signal can be estimated for all tested monitoring amplitudes. The SNR of the cardiac signal is dependent on the magnitude of the monitoring amplitudes and higher for amplitudes of 15% and 20% than that using only the reflection of the standard imaging RF-pulse. The proposed monitoring scheme adds energy to the pulse and adds small amounts of out-of-slice signal, which is expected to be below the noise floor. Retrospectively cardiac gated 2D-CINE images show the suitability of this monitoring scheme at 7T with minimal artefacts or blurring.Conclusion
Small, random and ultra-short RF-pulses overlaid on the imaging RF-pulse can be used to monitor the scattering matrix of a pTx coil and to estimate a cardiac signal with high SNR during normal image acquisition at 7T MRI. It allows for retrospective cardiac gating without prolonging the sequence, with no additional hardware and with only minimal effects on image quality.
Acknowledgements
This work was supported by funding from the Engineering and Physical Sciences Research Council (EPSRC) and Medical Research Council (MRC) [grant number EP/L016052/1], the Clarendon Fund and Keble College de Breyne Scholarship. AH thanks the British Heart Foundation centre of research excellence (Oxford).References
1. Suttie JJ, Delabarre L, Pitcher A, et al. 7 Tesla (T) human cardiovascular magnetic resonance imaging using FLASH and SSFP to assess cardiac function: Validation against 1.5T and 3T. NMR Biomed. 2012;25:27–34. doi: 10.1002/nbm.1708.
2. Jaeschke SHF, Hess AT, Robson MD. Contact-free Cardiac Motion Estimation using the Scatter of a Parallel Transmit Coil at 7T MRI. In: Proc. Intl. Soc. Mag. Reson. Med. Honolulu; 2017. p. 3262.
3. Hess AT, Tunnicliffe EM, Rodgers CT, Robson MD. Diaphragm position can be accurately estimated from the scattering of a parallel transmit RF coil at 7 T. Magn. Reson. Med. 2017;0. doi: 10.1002/mrm.26866.
4. Jaeschke SHF, Robson MD, Hess AT. Evaluating the Influence of B1-Shimming on Contact-free Cardiac Gating using Scatter of a Parallel Transmit Coil at 7T MRI. In: Proc. Intl. Soc. Mag. Reson. Med. 25. ; 2017. p. 1131.
5. Savitzky A, Golay MJE. Smoothing and Differentiation of Data by Simplified Least Squares Procedures. Anal. Chem. 1964;36:1627–1639. doi: 10.1021/ac60214a047.
6. Ji JIMX, Son JBUM, Rane SD. PULSAR : A MATLAB Toolbox for Parallel Magnetic Resonance Imaging Using Array Coils and Multiple Channel Receivers. 1:24–36. doi: 10.1002/cmr.b.
Figures