1004
Ultrasound-based sensors for physiological motion monitoring1Radiology, Brigham and Women's Hospital, Harvard Medical School, Boston, MA, United States
Synopsis
A small ultrasound-based sensor was developed for use in MRI. It is about 3x3x1cm in size, can be fixed to the skin, readily fits under imaging coils, and provides up to 20,000 data points in a 0.2ms period. A switching circuit was developed allowing up to four such sensors to be used at a time. Examples are show where a sensor was attached over a carotid artery, over the heart or below the ribs, providing information about blood influx to the brain, cardiac motion or breathing, respectively. These devices and associated processing may prove especially useful at high field, where ECG detection proves ineffective.
Introduction
Many devices and strategies have been developed to monitor physiological motion during MRI. For example, navigator echoes, respiratory bellows and electrocardiogram (ECG) leads are routinely employed to monitor breathing and cardiac motion. This information allows scanners to synchronize data acquisition and motion in ways that minimize artifacts and/or allow the motion to be resolved. Small ultrasound-based sensors were developed to monitor internal motion. Called here 'organ configuration motion' (OCM) sensors, they offer various advantages over currently available alternatives: e.g., their performance is unaffected by high field strengths and strong imaging gradients (unlike ECG leads1,2), they do not compete with the k-space acquisition process (unlike most navigator echoes3), and they provide direct information on internal motion (unlike bellows).
Methods
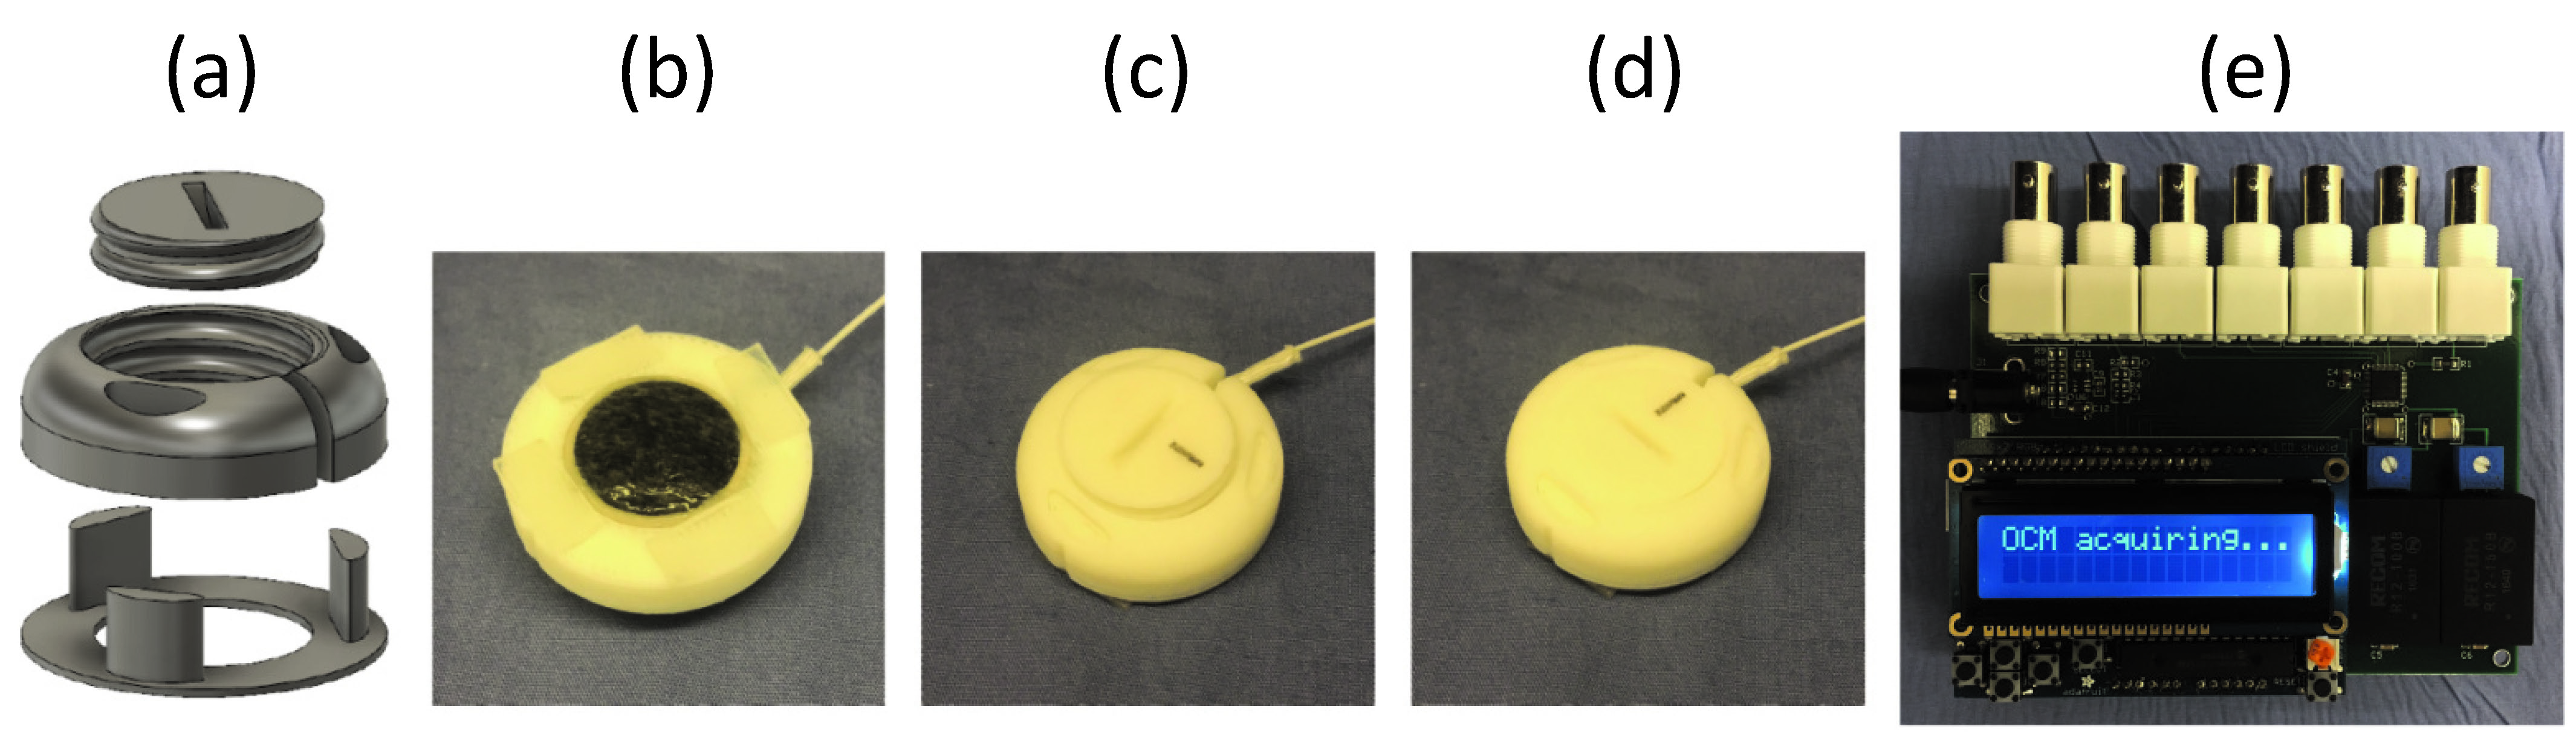
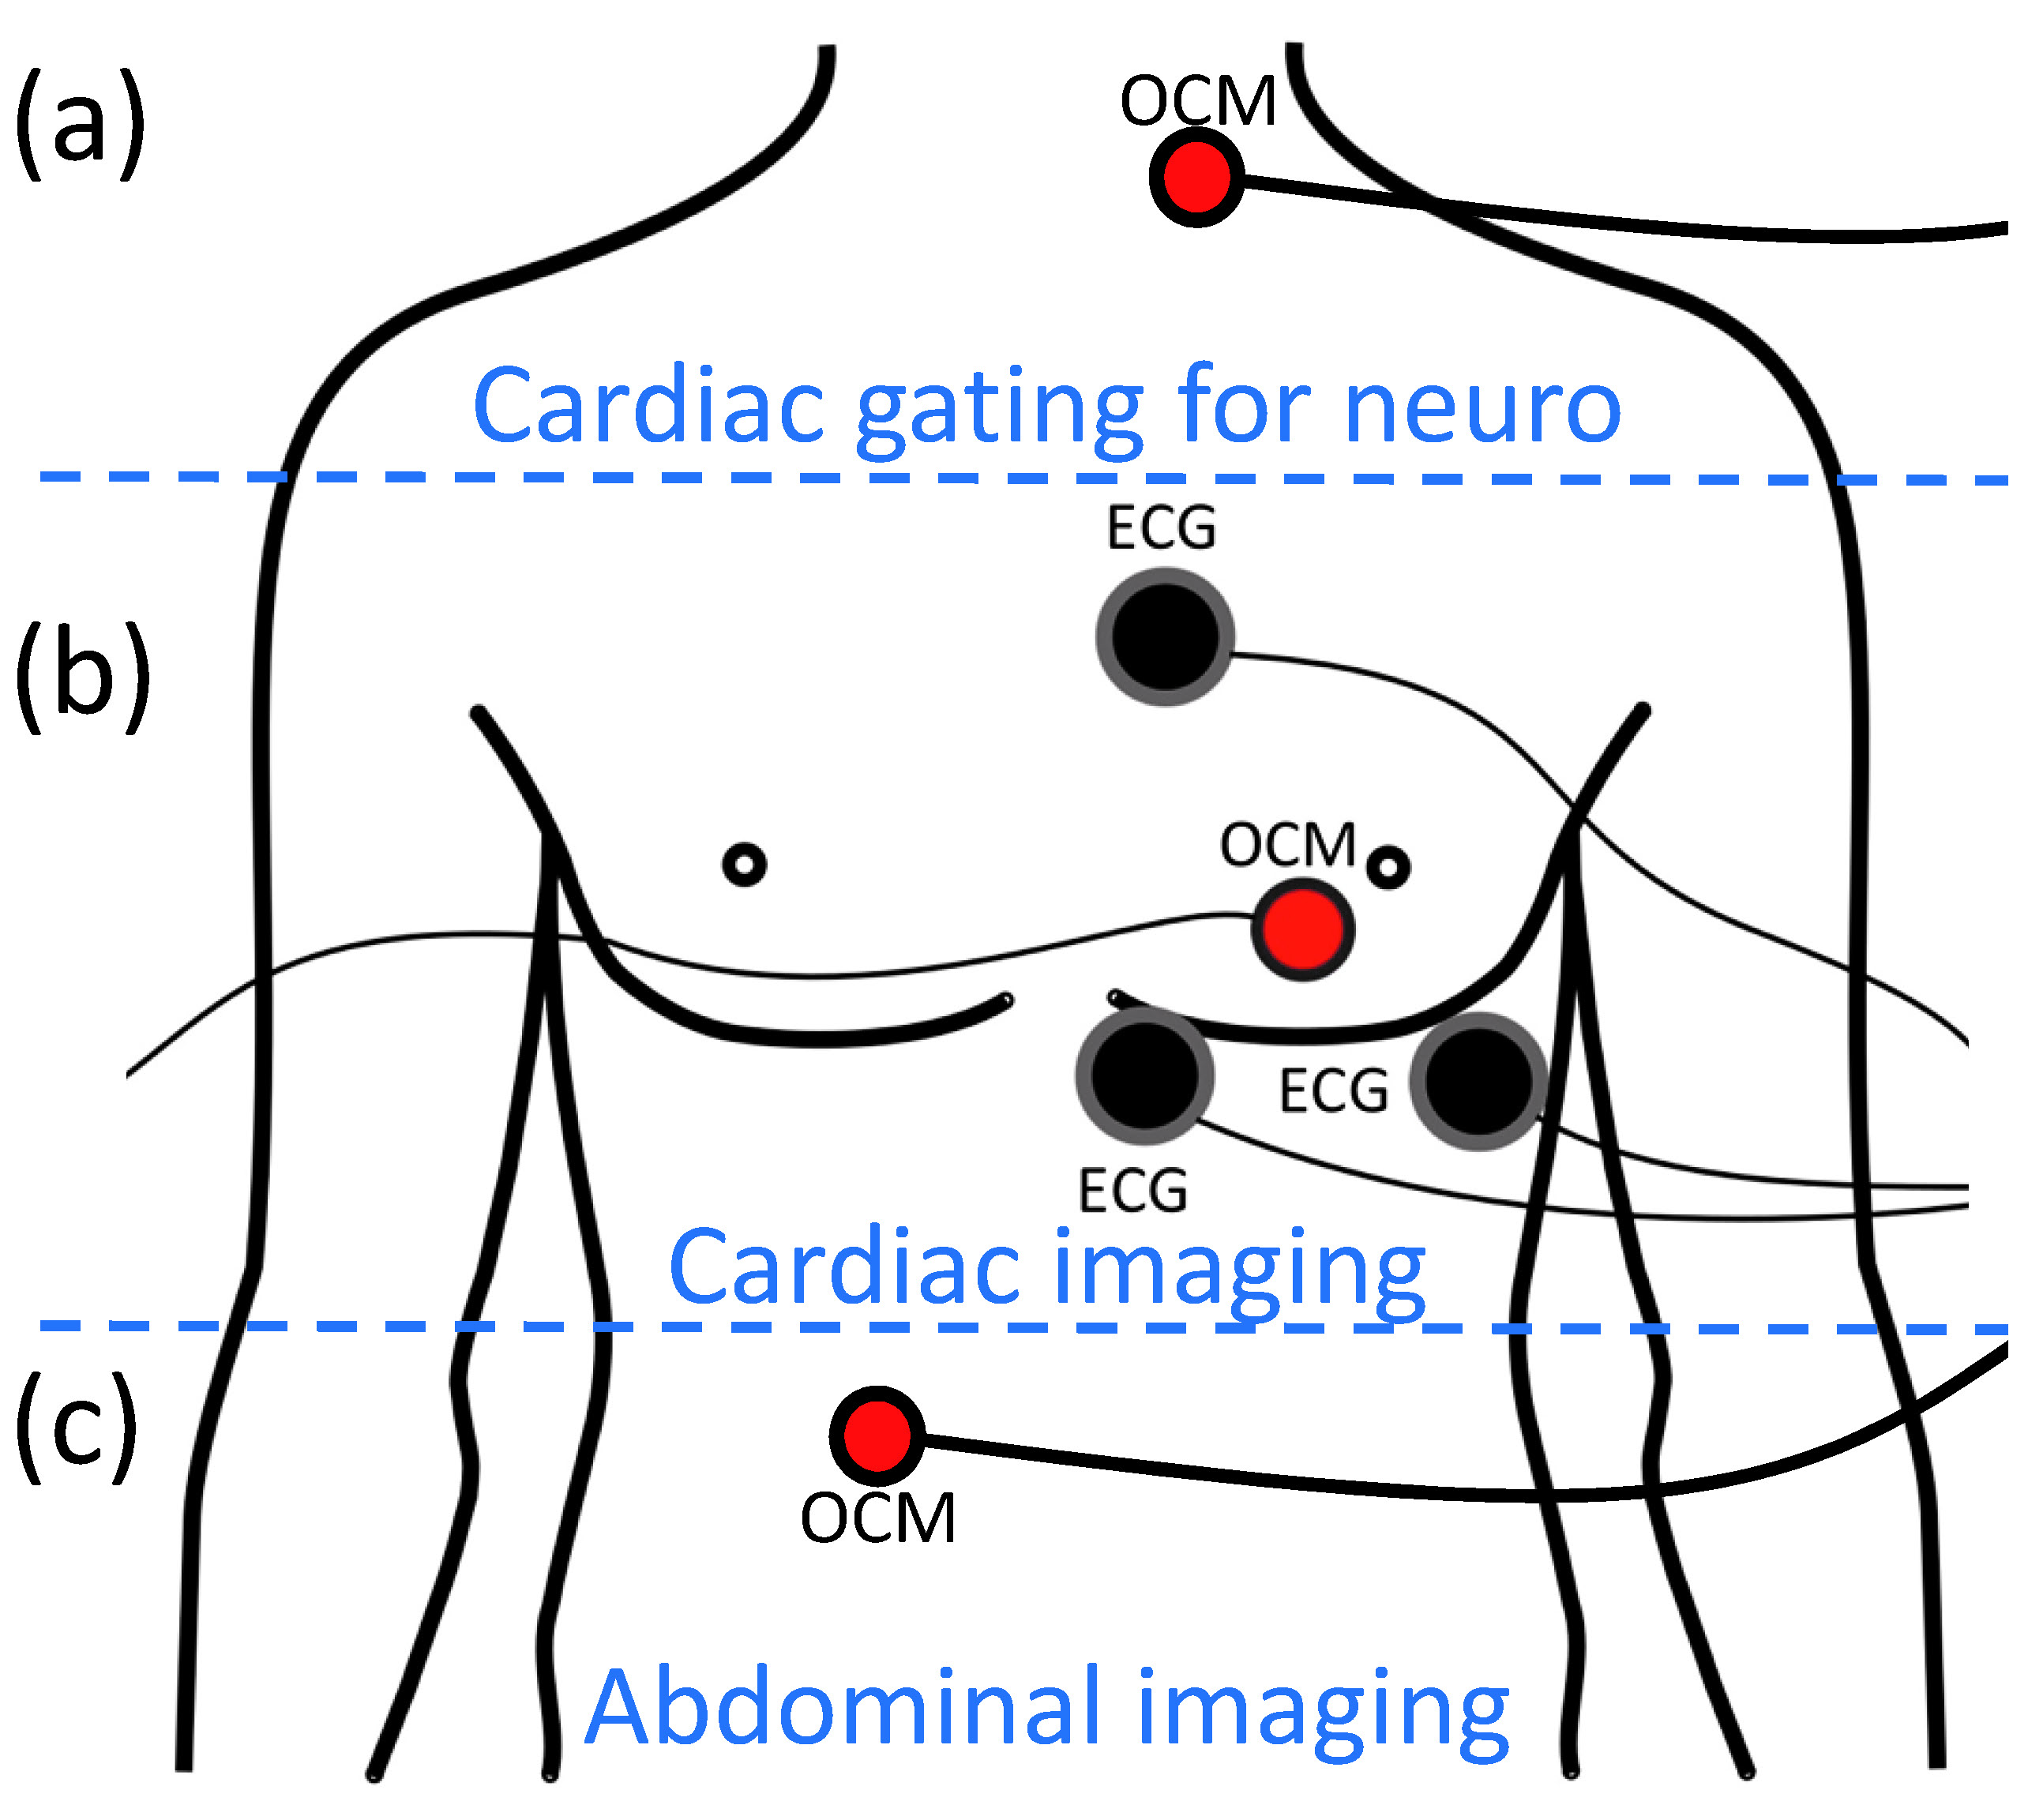
OCM sensors include an MR-compatible ultrasound transducer, a 3D-printed capsule, gel as needed for acoustic coupling and two-way tape as needed for fixation to the skin (Fig. 1a-d). A switching circuit (MRI guided technologies, Boston, MA) was designed to accommodate up to four sensors at once (Fig. 1e). The sensors are small, about 3x3x1 cm in size, and as such readily fit under an MRI receive coil with no detectable loss in SNR. Three main applications were considered here: an OCM sensor may be placed over a carotid artery to provide cardiac information during neuroimaging (Fig. 2a), or over the heart for cardiac imaging (Fig. 2b), or slightly below the ribs for abdominal imaging (Fig. 2c). These three cases are treated in more detail below.
Blood influx (Fig. 2a): Pulsatile blood flow in the brain may generate artifacts that are broadcasted over neighboring tissues. Furthermore, brain tissues themselves may pulsate by about 0.2mm in places4, due to blood influx. For these reasons, neuroimaging can be improved when taking cardiac pulsation into account, especially at higher field strengths where voxels are typically smaller. Each k-space line was acquired twice during an MPRAGE scan on a 7T Terra system (TE/TR/TI/α = 3.46/2300/1050/7°, 0.7mm isotropic resolution), and information from an OCM sensor was used to detect/reject data acquired during systole.
Cardiac motion (Fig. 2b): OCM and ECG signals were simultaneously obtained, both at 0T and 3T. Using the ECG signal at 0T as a gold standard, the ability of OCM signals to detect systolic periods was measured. The approach should be especially useful at higher field strengths, such as 7T, where ECG detection does not function reliably due to magnetohydrodynamic effects5,6.
Breathing motion (Fig. 2c): OCM signals can help characterize breathing motion, during free breathing7. Algorithms were developed that could capture the information relevant to the bio-mechanical motion associated with breathing, but without falling prey to confounding factors; while OCM signals are exquisitely sensitive to motion, they can be equally sensitive to less-interesting factors such as small changes in sensor position, as might occur when strapping a flexible receive coil over it, for example. Phase-based Doppler-like processing was developed to capture breathing motion in ways mostly immune to such confounding factors. The approach was tested by comparing data from the same volunteer on different days, with sensors attached and re-attached in-between.
Results
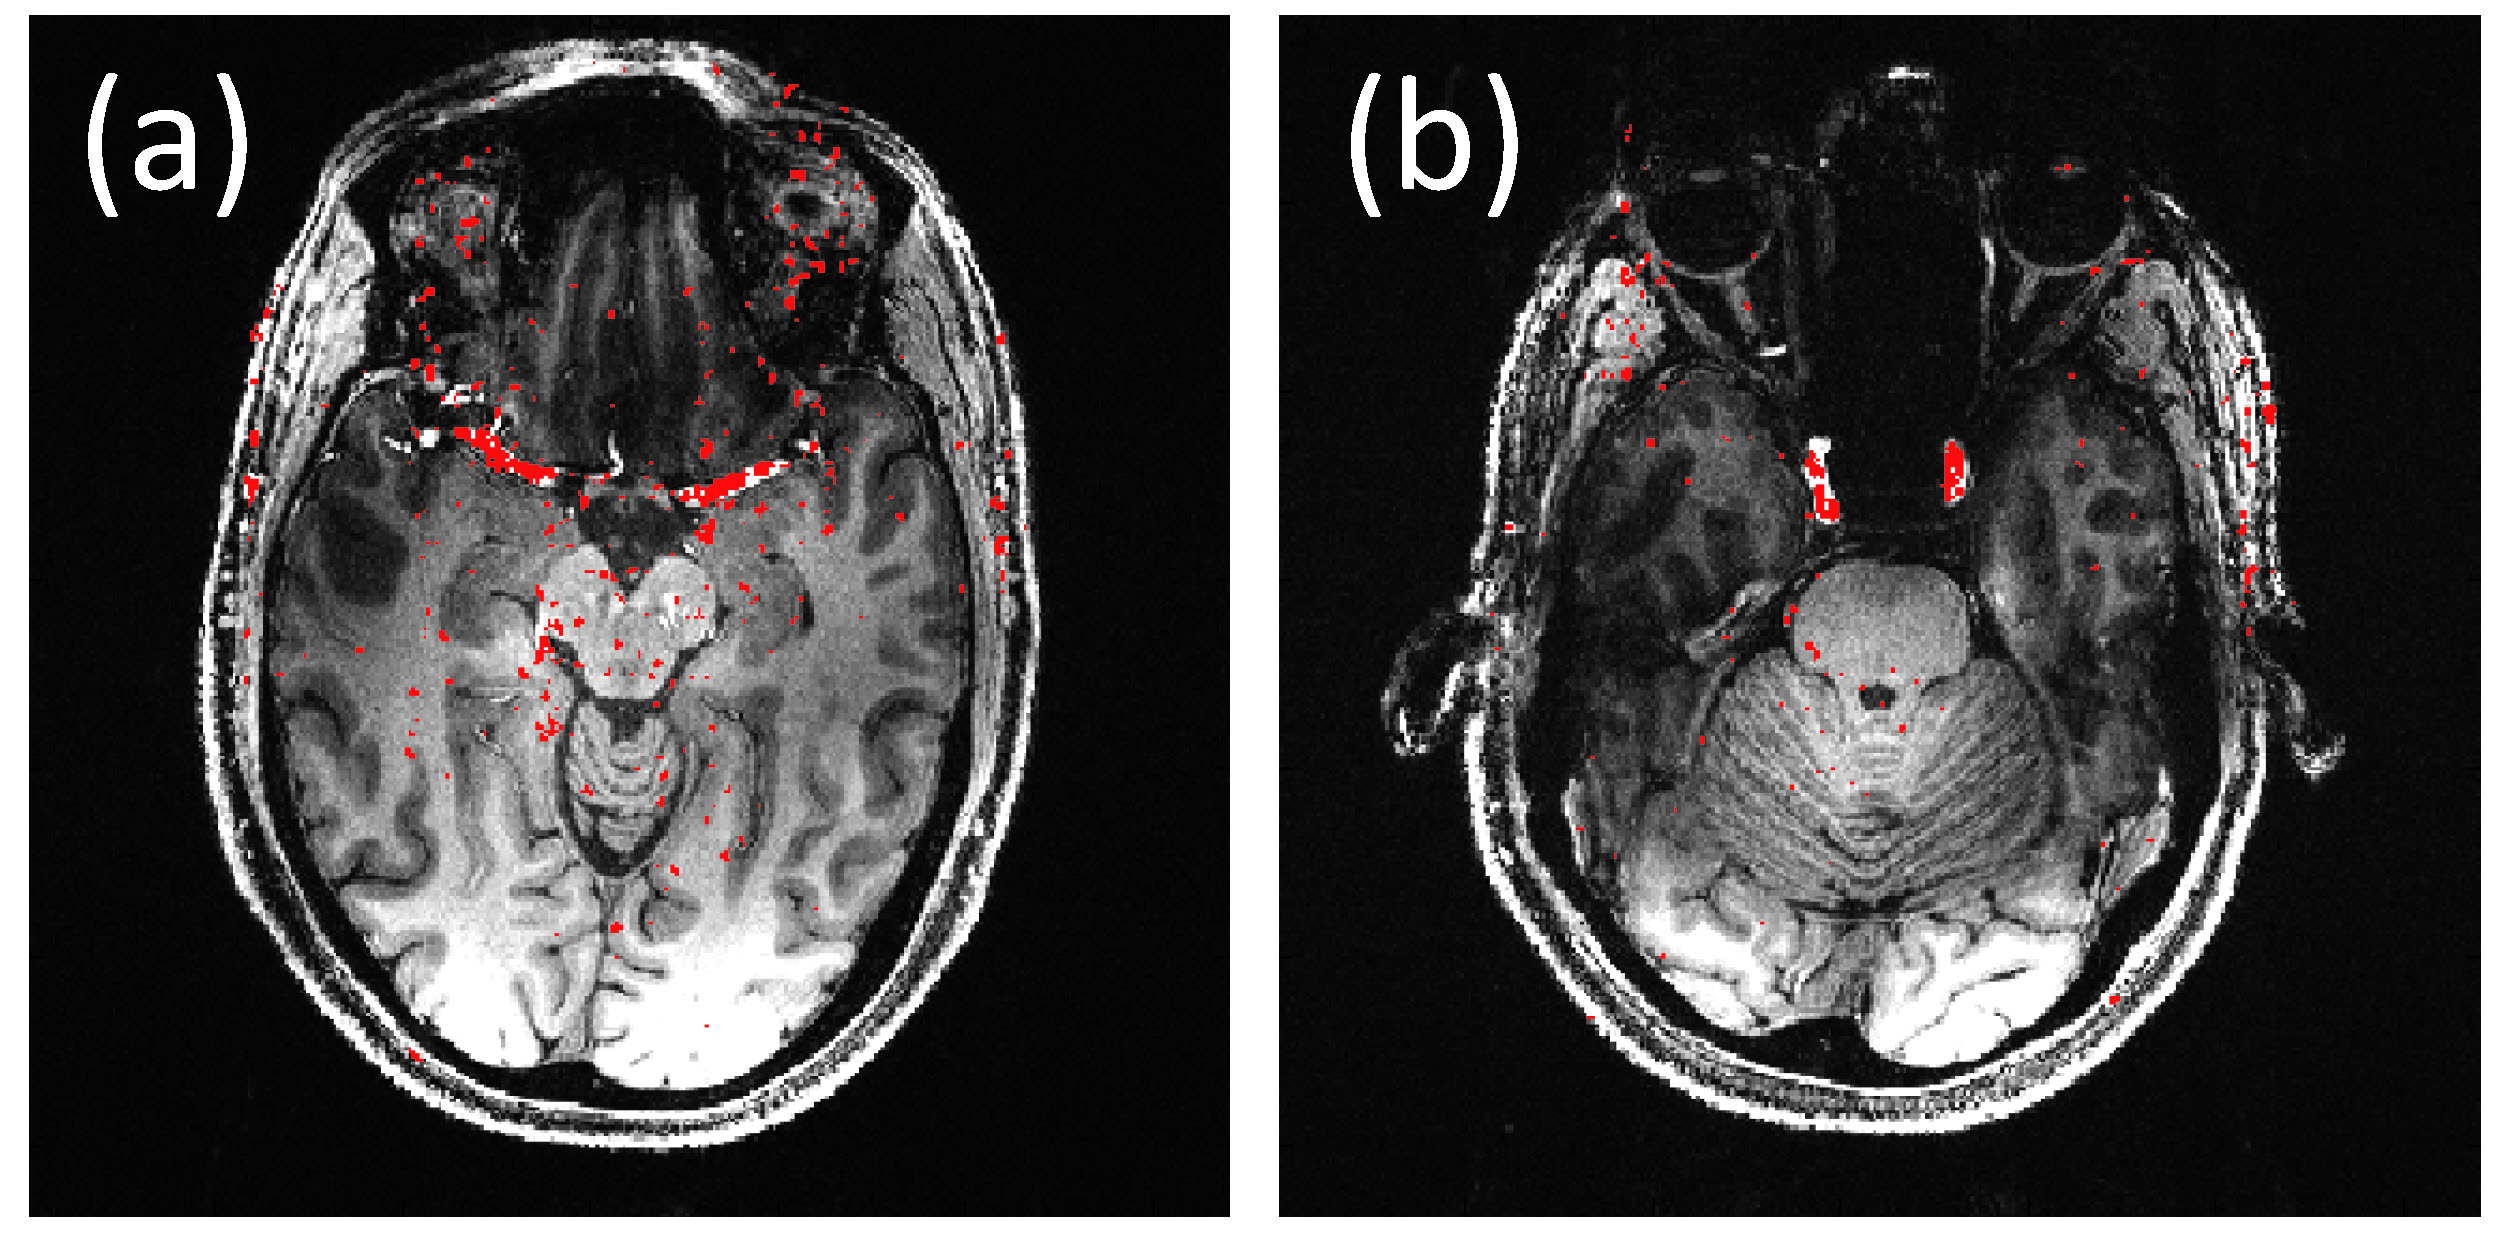
Figure 3 shows two slices, out of 240, from an MPRAGE scan at 7T. Overlaid in red are locations that experienced most change when taking OCM information into account, to avoid data acquired at systole. Not surprisingly, these locations tend to be closely associated with larger vessels.
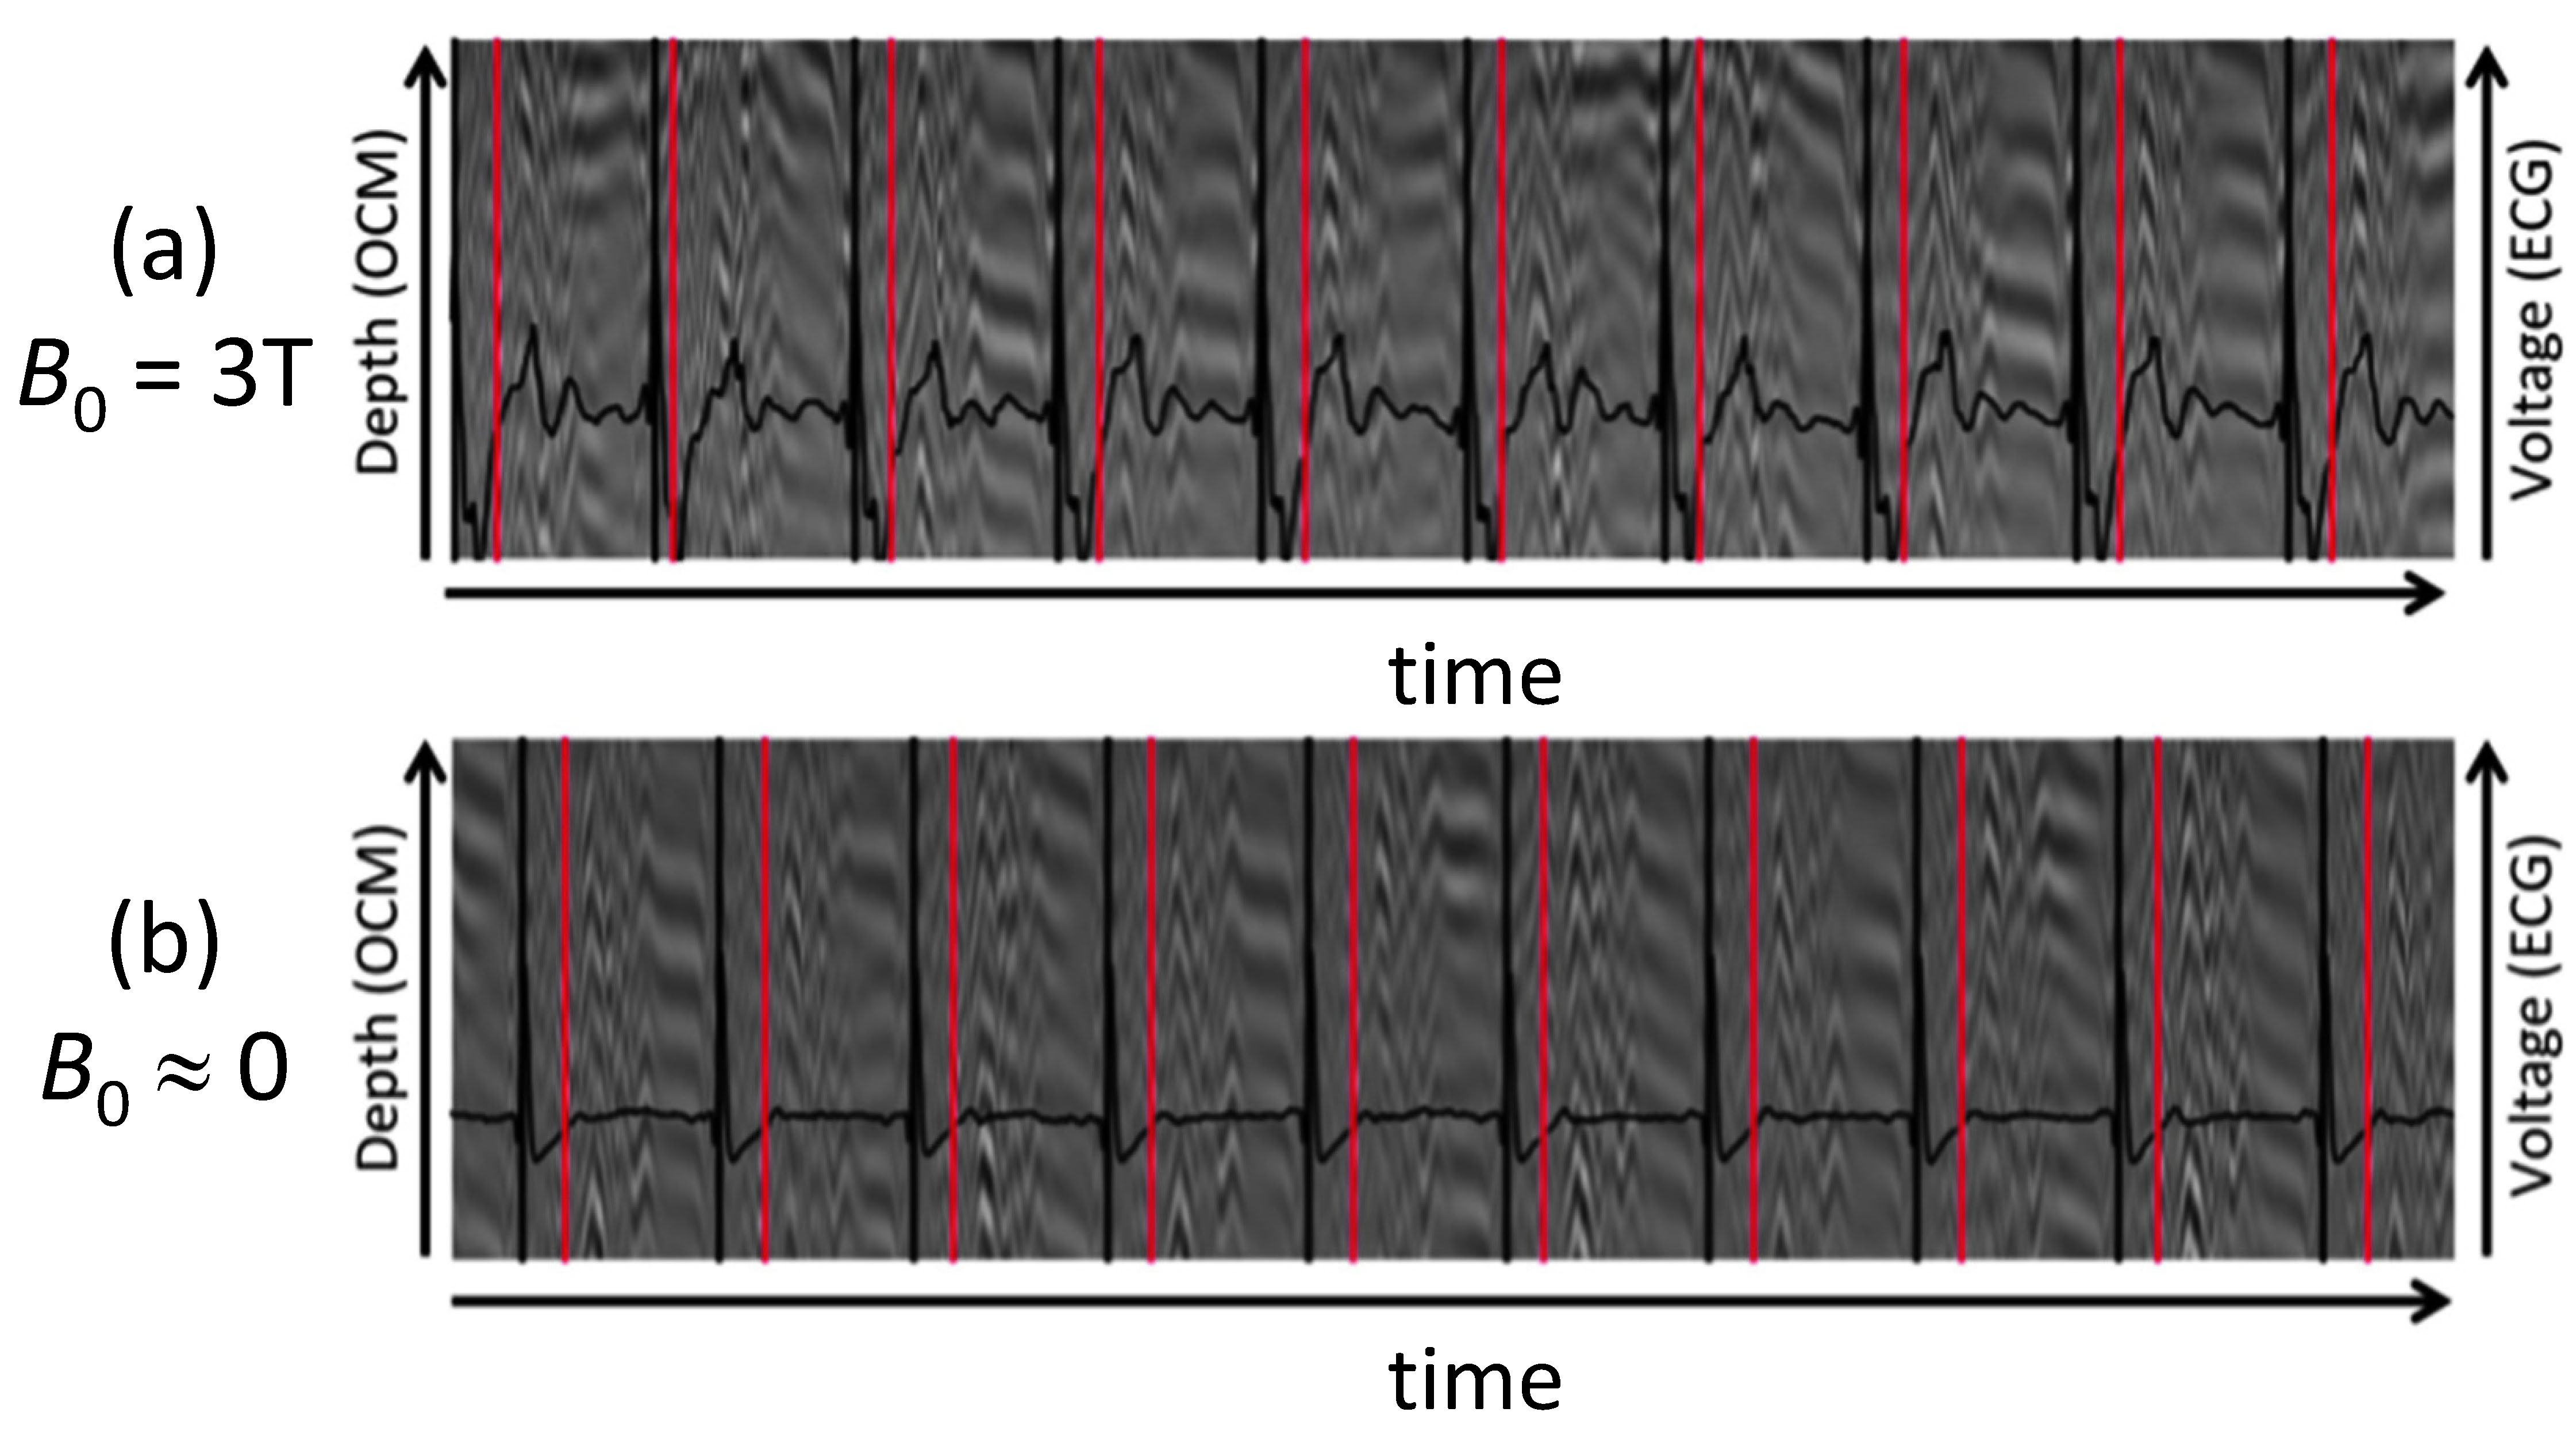
Figure 4 shows a time-series of OCM traces in the background, in grayscale. Black lines in the foreground give ECG signals, along with ECG-based R-wave detection (black vertical lines). Red vertical lines show the OCM-based detection of systolic events; mean heartbeat duration over 155 beats as detected by OCM and ECG differed by only 2ms.
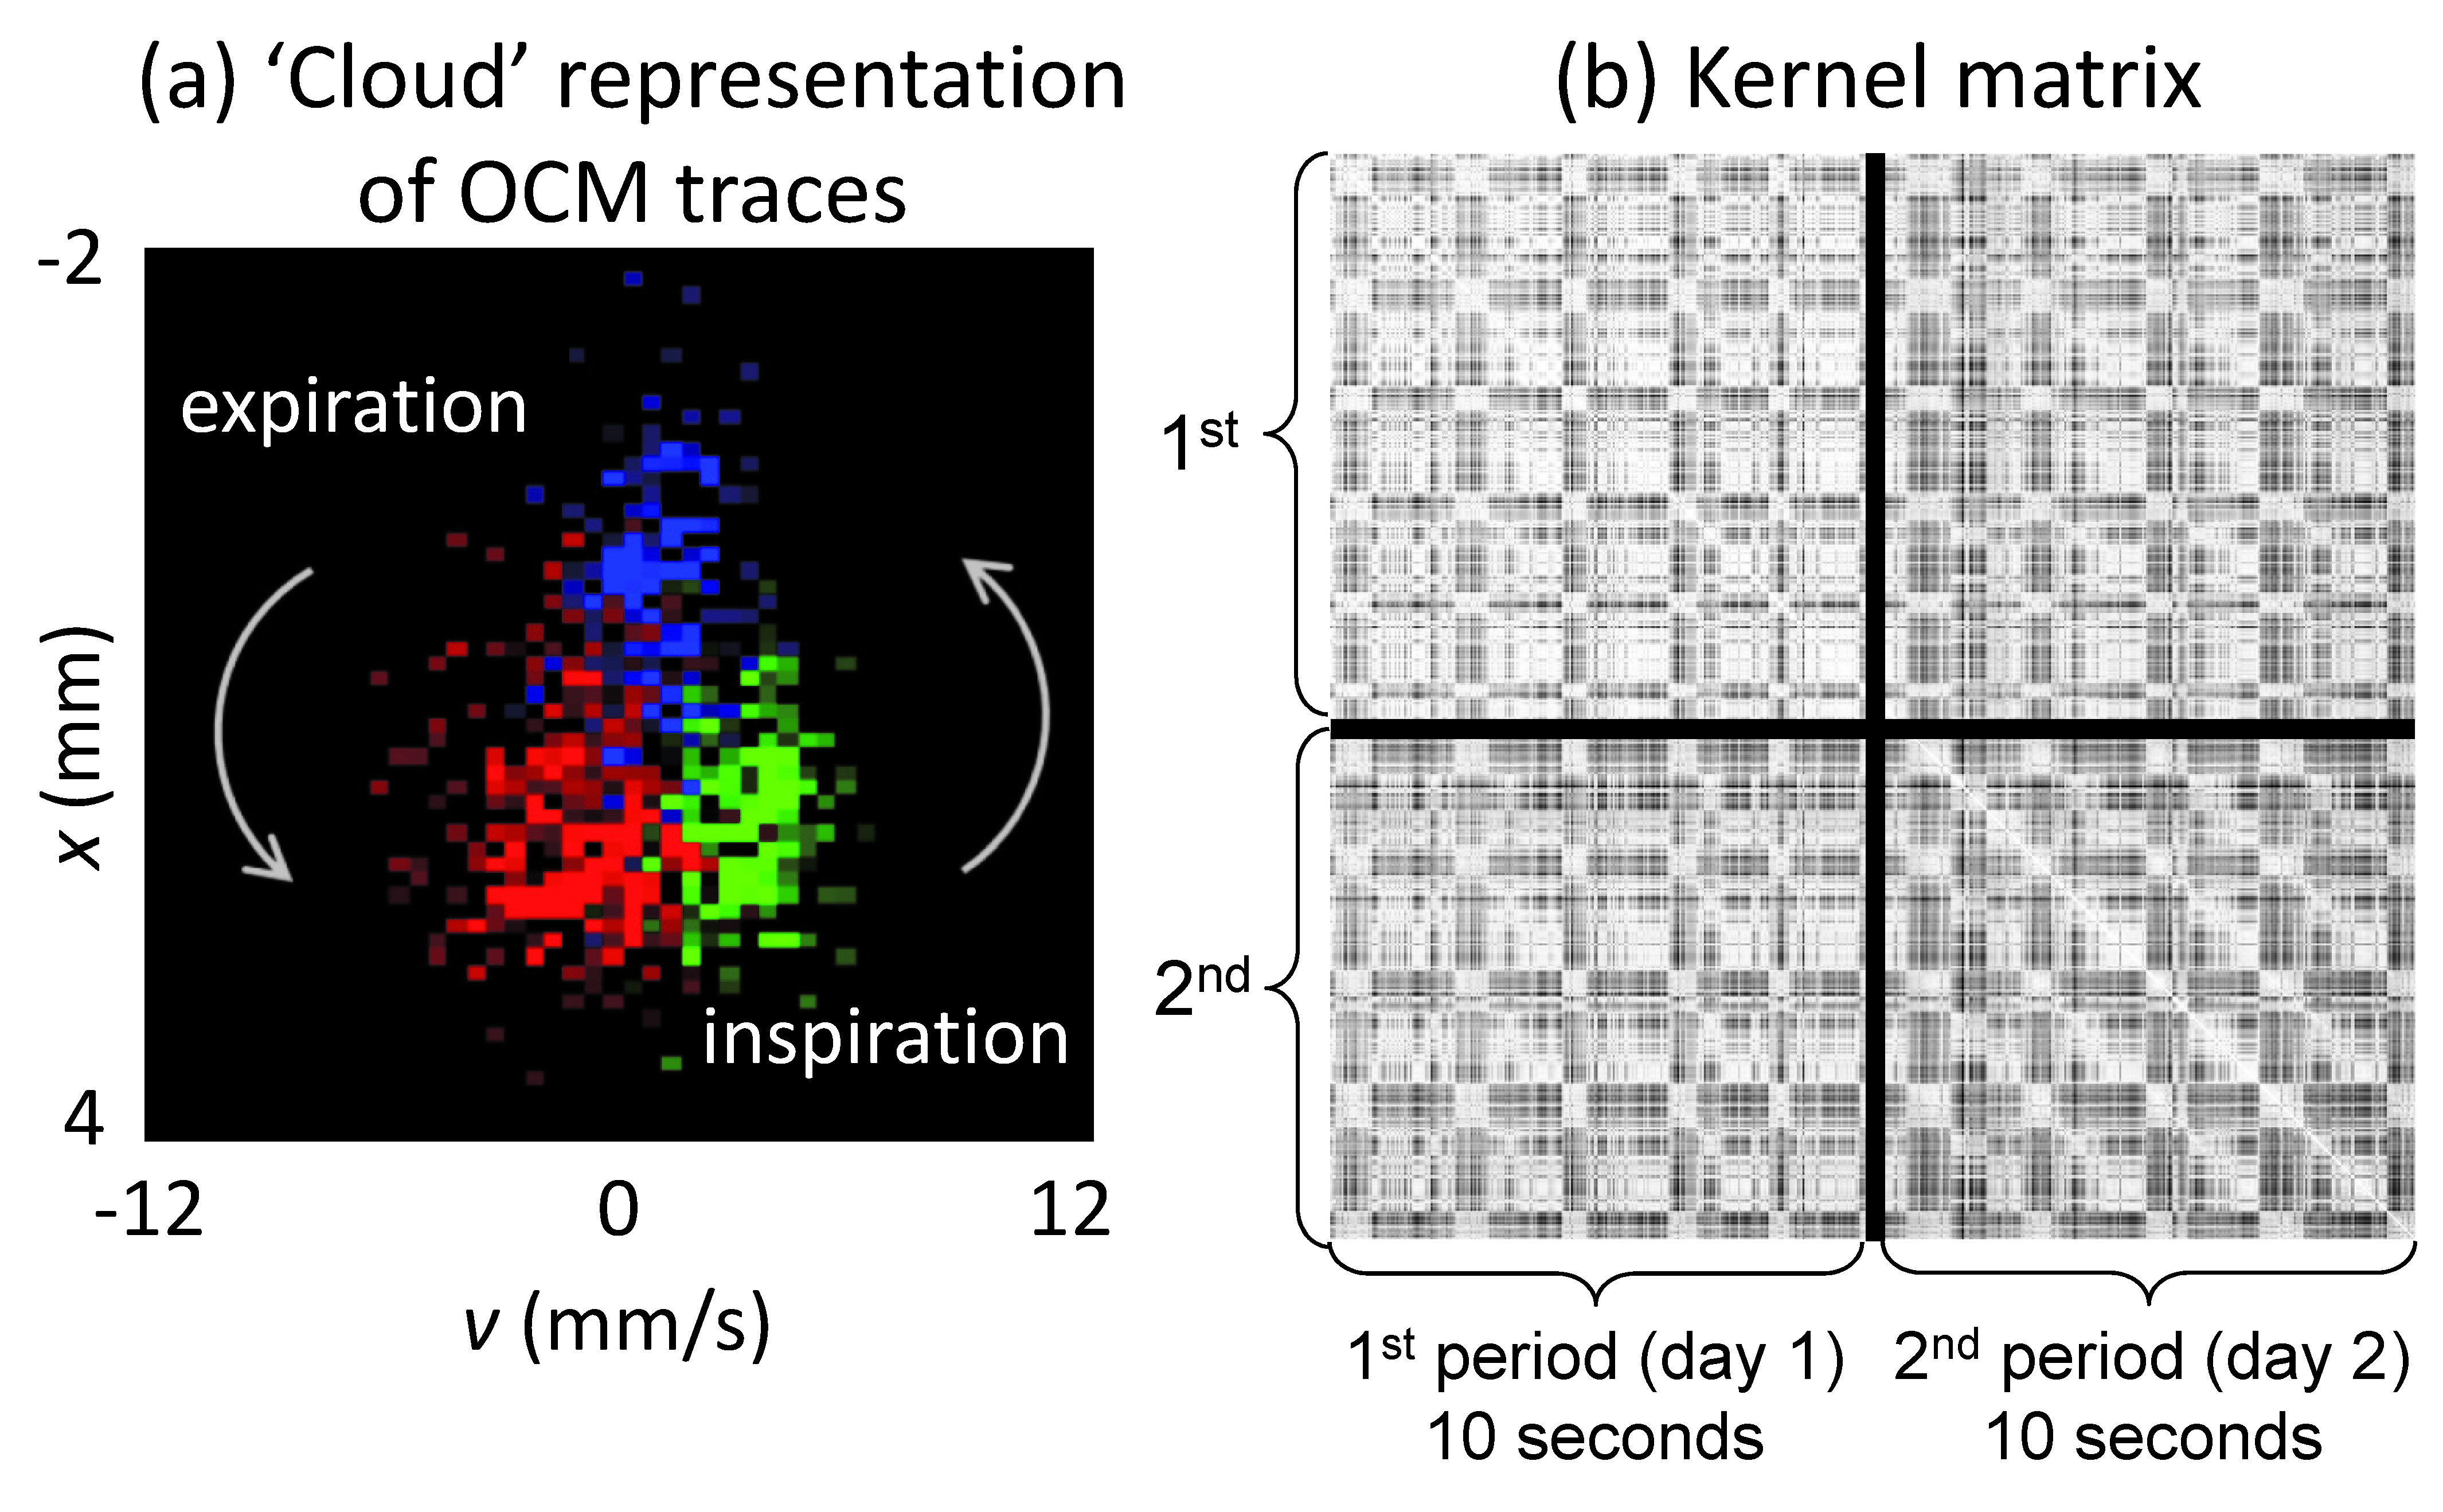
Figure 5a shows 3 distinct OCM traces represented in a displacement vs. velocity 2D space. Three color-coded traces are shown, each one acquired in about 0.2ms: during inspiration (green), at full inspiration (blue) and during expiration (red). The many different points of any given color represent signals at different depths below the sensor. A similarity matrix between OCM traces, as represented in x-v space, was developed and employed to generate Kernel matrices. The matrices in Fig. 5b have the particularity that they mix data acquired on different days, with sensors attached/re-attached.
Discussion and Conclusion
OCM sensors can capture physiological motion associated with blood flow (Fig. 3) cardiac motion (Fig. 4) or breathing (Fig. 5), depending on where it is fixed on the body (Fig. 2). The device might be especially useful at high field, where ECG detection is not an option.Acknowledgements
Support from NIH grants P41EB015898, R01CA149342 and SNSF grant P300P2_164647 is acknowledged.References
1. Niendorf T, Sodickson DK, Krombach GA, Schulz-Menger J. Toward cardiovascular MRI at 7 T: clinical needs, technical solutions and research promises. Eur Radiol 2010;20(12):2806-2816.
2. Dietrich O, Reiser MF, Schoenberg SO. Artifacts in 3-T MRI: physical background and reduction strategies. Eur J Radiol 2008;65(1):29-35.
3. Ehman RL, Felmlee JP. Adaptive technique for high-definition MR imaging of moving structures. Radiology 1989;173(1):255-263.
4. Soellinger M, Rutz AK, Kozerke S, Boesiger P. 3D cine displacement-encoded MRI of pulsatile brain motion. Magn Reson Med 2009;61(1):153–162.
5. Martin V, Drochon A, Fokapu O, Gerbeau JF. MagnetoHemoDynamics in the aorta and electrocardiograms. Phys Med Biol 2012;57(10):3177-3195.
6. Frauenrath T, Fuchs K, Dieringer MA, et al. Detailing the use of magnetohydrodynamic effects for synchronization of MRI with the cardiac cycle: a feasibility study. J Magn Reson Imaging 2012;36(2):364-372.
7. Preiswerk F, Toews M, Cheng CC, et al. Hybrid MRI-Ultrasound acquisitions, and scannerless real-time imaging. Magn Reson Med 2017;78(3):897-908.
Figures