1003
Hybrid motion sensing with a wireless device, self-synchronized to the imaging pulse sequence.1Human Biology, University of Cape Town, Cape Town, South Africa, 2Massachusetts General Hospital, Athinoula A. Martinos Center, Boston, MA, United States, 3Radiology, Harvard Medical School, Boston, MA, United States
Synopsis
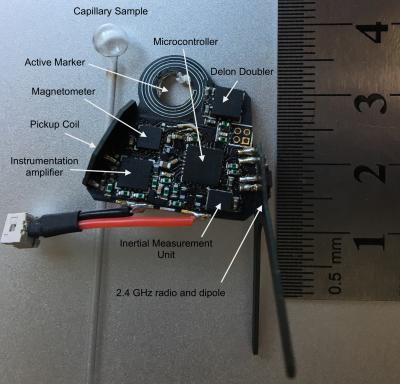
Here we combine an accelerometer, angular rate sensor, magnetometer, pickup coil and active marker in a (single) small wireless device. The active marker is used to detect radio frequency pulses, enabling synchronisation to the imaging pulse sequence to within 1 μs accuracy. Sinusoidal waveforms inserted into the imaging pulse sequence (lasting 920 μs) are then measured using the onboard pickup coil to allow real-time position and ADC-gradient timing offsets in all 3 axes. Preliminary results suggest that sub-mm accuracy is possible with very low noise (<0.3 mm) in the raw data captured. The new hardware layout has the potential to enable full prospective motion correction from a single small device that fits on the bridge of the subject's nose.
Purpose
Here we present a method to achieve full prospective motion correction by adding a gradient pick-up1 coil and active marker2 to our (VectOrient3) orientation tracking device. The hardware typically associated with pickup coils is reduced by filtering, digitising and analysing the coil voltages on the marker itself, and by wirelessly synchronising to the imaging pulse sequence using the active marker as an RF pulse detector4. Playing out a series of sinusoidal gradients yields position estimates from the gradient flux and MR signal simultaneously. The minimum play-out duration can be limited by how accurate the synchronisation between the gradients and the external analog to digital converter (ADC) is. By introducing a sinusoidal gradient excitation we aim to track the delay between each gradient axis and the wireless ADC in real-time.Method
The electrical potential induced across the pickup coil \(V(t)\) is related to position in the gradient co-ordinate frame \(\vec{D}\) as follows:
$$V(t) = \left(\vec{D}.\frac{\mathrm{d}}{\mathrm{d}t}\vec{G(t)}\right)\left(\vec{A}.\bar{b}\right).$$Where \(\vec{G(t)}\) is the gradient waveform, \(\vec{A}\) is the geometric scaling factor of the coil in the direction normal to the plane (area) of the coil, and \(\bar{b}\) is the unit vector representing the direction of the static magnetic field (gradient flux). The device (Fig 1) amplifies and filters this signal (3 pole Bessel) before digitising it with a 12-bit ADC.The active marker circuit has a 4-mm diameter hole in its center for placement of a sample [a glass bulb formed from a capillary tube, filled with Polyethylene glycol (PEG)]. The resonator is placed on the sagittal plane along with most of the active electronics. The potential induced on the active marker is rectified and doubled (using a Delon Doubler circuit) then filtered with a single pole Resistor-Capacitor (RC) filter. The rectification circuit modifies the marker’s resonance, passively detuning it from the high-power RF pulse. The output of the rectification circuit is fed into a comparator with an adjustable trigger threshold set by a digital to analog converter (DAC). Upon receiving the trigger signal from the comparator, the micro-controller starts a timer for starting ADC events.
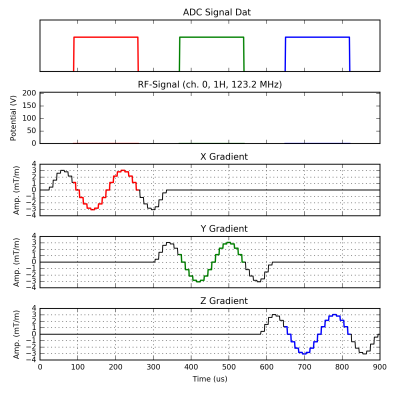
The sinusoidal gradients (Fig 2) were inserted into a non-selective 3D gradient echo pulse sequence. Each play-out lasts 160 μs which corresponds to a frequency of 6.25 kHz. The combined play-out lasts a total of 920 μs and makes little audible difference to the parent pulse sequence. The ADC samples the pickup coil potential at 200 kHz for the duration of each play-out. Based on the gradient waveform design (Fig 2, \(-\sin(\omega t)\)) we expect the following potential for the \(x,y,z\) excitations respectively:
\begin{equation}V_{x,y,z} = - \vec{A}.\bar{b} D_{x,y,z} \cos(\omega t + \theta_{x,y,z}) \end{equation}
Where \(\theta_{x,y,z}\) represents a timing offset between the gradient and the ADC acquisition window. Analysis of the waveform is performed on the raw data as it is captured; a Goertzel filter (single bin discrete Fourier transform) isolates the signal of interest at the excitation frequency (6.25 kHz). The result \(F_{x,y,z}\)(after scaling) describes the magnitude of the displacement and gradient timing offset \(\theta_{x,y,z}\) on the complex plane:
\begin{equation*}\frac{V_{x,y,z}}{\vec{A}.\bar{b}} \xrightarrow{\mathscr{F_\omega}} F_{x,y,z} = -D_{x,y,z} \mathrm{e}^{i\theta_{x,y,z}}\end{equation*}
Once the displacement and gradient leads/delays are calculated, the vector observations of gravity (from the accelerometer) and the static magnetic field (magnetometer) are combined with the angular rate using a lightweight complementary filter to give an orientation estimate. The data is packed and transmitted wirelessly to a laptop in the scanner control room. Each packet has a 2 byte acknowledge payload to allow bi-directional communication.
Discussion
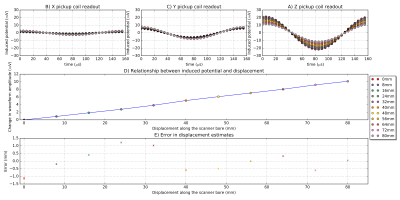
The active marker with a trigger threshold set to 0.1 V reliably captures RF pulses. The device was attached to a Lego block and moved in single step increments (8 mm) along the bore to find the relationship between coil voltage and displacement (Fig 3). The signals obtained were stable enough for sub-mm position estimates. Results were similar for motion in all three directions.
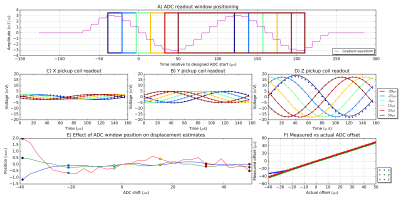
The sensitivity of the position estimates to errors in timing was examined by sweeping the ADC acquisition window through the gradient play-out in 1 μs steps (Fig 4A). The position estimates are robust to errors in ADC timing until the gradient waveform is no longer sinusoidal (Fig 4E). The readouts are able to track the offset between the ADC events on the micro-controller and each gradient axis to within 1 μs (Fig 4F).
Conclusion
Combining multiple sensors has the potential to provide insight not only about subject motion but also information on the operation of the scanner throughout the imaging sequence. Measuring subject pose using multiple modalities could enable more robust prospective motion correction.Acknowledgements
University of Cape Town through RCIPS Concept fund C17-006 , NIH grants R01HD071664, R21AG046657 and R01HD085813, and the South African Research Chairs Initiative NRF SARC06052016A
References
1. A. J. van der Kouwe, B. Fetics , D. Polenur , A. Roth and E. Nevo, Real-time prospective rigid-body motion correction with the EndoScout gradient-based tracking system, ISMRM 2009.
2. Ooi, M. B., Aksoy, M., Maclaren, J., Watkins, R. D. and Bammer, R. (2013), Prospective motion correction using inductively coupled wireless RF coils. Magn. Reson. Med., 70: 639–647. doi:10.1002/mrm.24845
3. A. van Niekerk, A. van der Kouwe and E. Meintjes, "A Method for Measuring Orientation Within a Magnetic Resonance Imaging Scanner Using Gravity and the Static Magnetic Field (VectOrient)," in IEEE Transactions on Medical Imaging, vol. 36, no. 5, pp. 1129-1139, May 2017.doi: 10.1109/TMI.2017.2652502
4. Byron, Kelly Stang, Pascal Vasanawala, Shreyas Pauly, John Scott, Greig : High Power RF Gated Wireless Power Transfer System, ISMRM 2016.
Figures


