1002
Evaluating the Accuracy of Multi-component T2 and Fractions for Luminal Water Imaging of the Prostate using 3D GRASE with Inner Volume Selection1Sunnybrook Research Institute, Toronto, ON, Canada, 2Medical Biophysics, University of Toronto, Toronto, ON, Canada, 3Division of Urology, Sunnybrook Health Sciences Centre, Toronto, ON, Canada
Synopsis
Prostate cancer can be detected using a multi-component T2 mapping technique termed luminal water imaging (LWI). The purpose of our study is: i) to accelerate the LWI acquisition by using inner volume selection (IVS) in GRASE and ii) to assess the accuracy of estimated T2 values and fractions. Simulations, phantom and in-vivo prostate experiments were performed. Results show that the estimated parameters should be interpreted with caution in noisy scenarios and at low fractions of the long T2 component. Results demonstrate that GRASE with IVS is effective for accelerating prostate LWI by at least a factor of three.
Introduction
There is a growing trend towards quantitative T2 mapping of the prostate1-3. Recently, it was demonstrated that prostate cancer can be detected using a multicomponent T2 mapping technique, termed luminal water imaging (LWI)2,3, where the T2 of the short- and long-T2 components and their volume fractions can be estimated. The short T2 component is related to the prostate tissue compartment while the long T2 component is thought to be related to the “luminal water” compartment made up of prostatic fluid in the ductal and acinar spaces3,4. However, scan durations remain relatively long even with the use of a gradient and spin echo (GRASE) sequence, which collects multiple echoes per refocusing pulse.
In our study, we use an inner volume selection (IVS) approach in GRASE5 to accelerate the prostate LWI acquisition. As the abdominal FOV is comparatively large relative to the size of the prostate, significant acceleration (>3X) is possible. The purpose of our study is two-fold: 1) to demonstrate the feasibility of using IVS-GRASE in phantom and in-vivo experiments, and 2) to assess the accuracy of fitted parameters (multi-component T2 and fractions) using Monte Carlo simulations and in-vivo experiments.
Methods
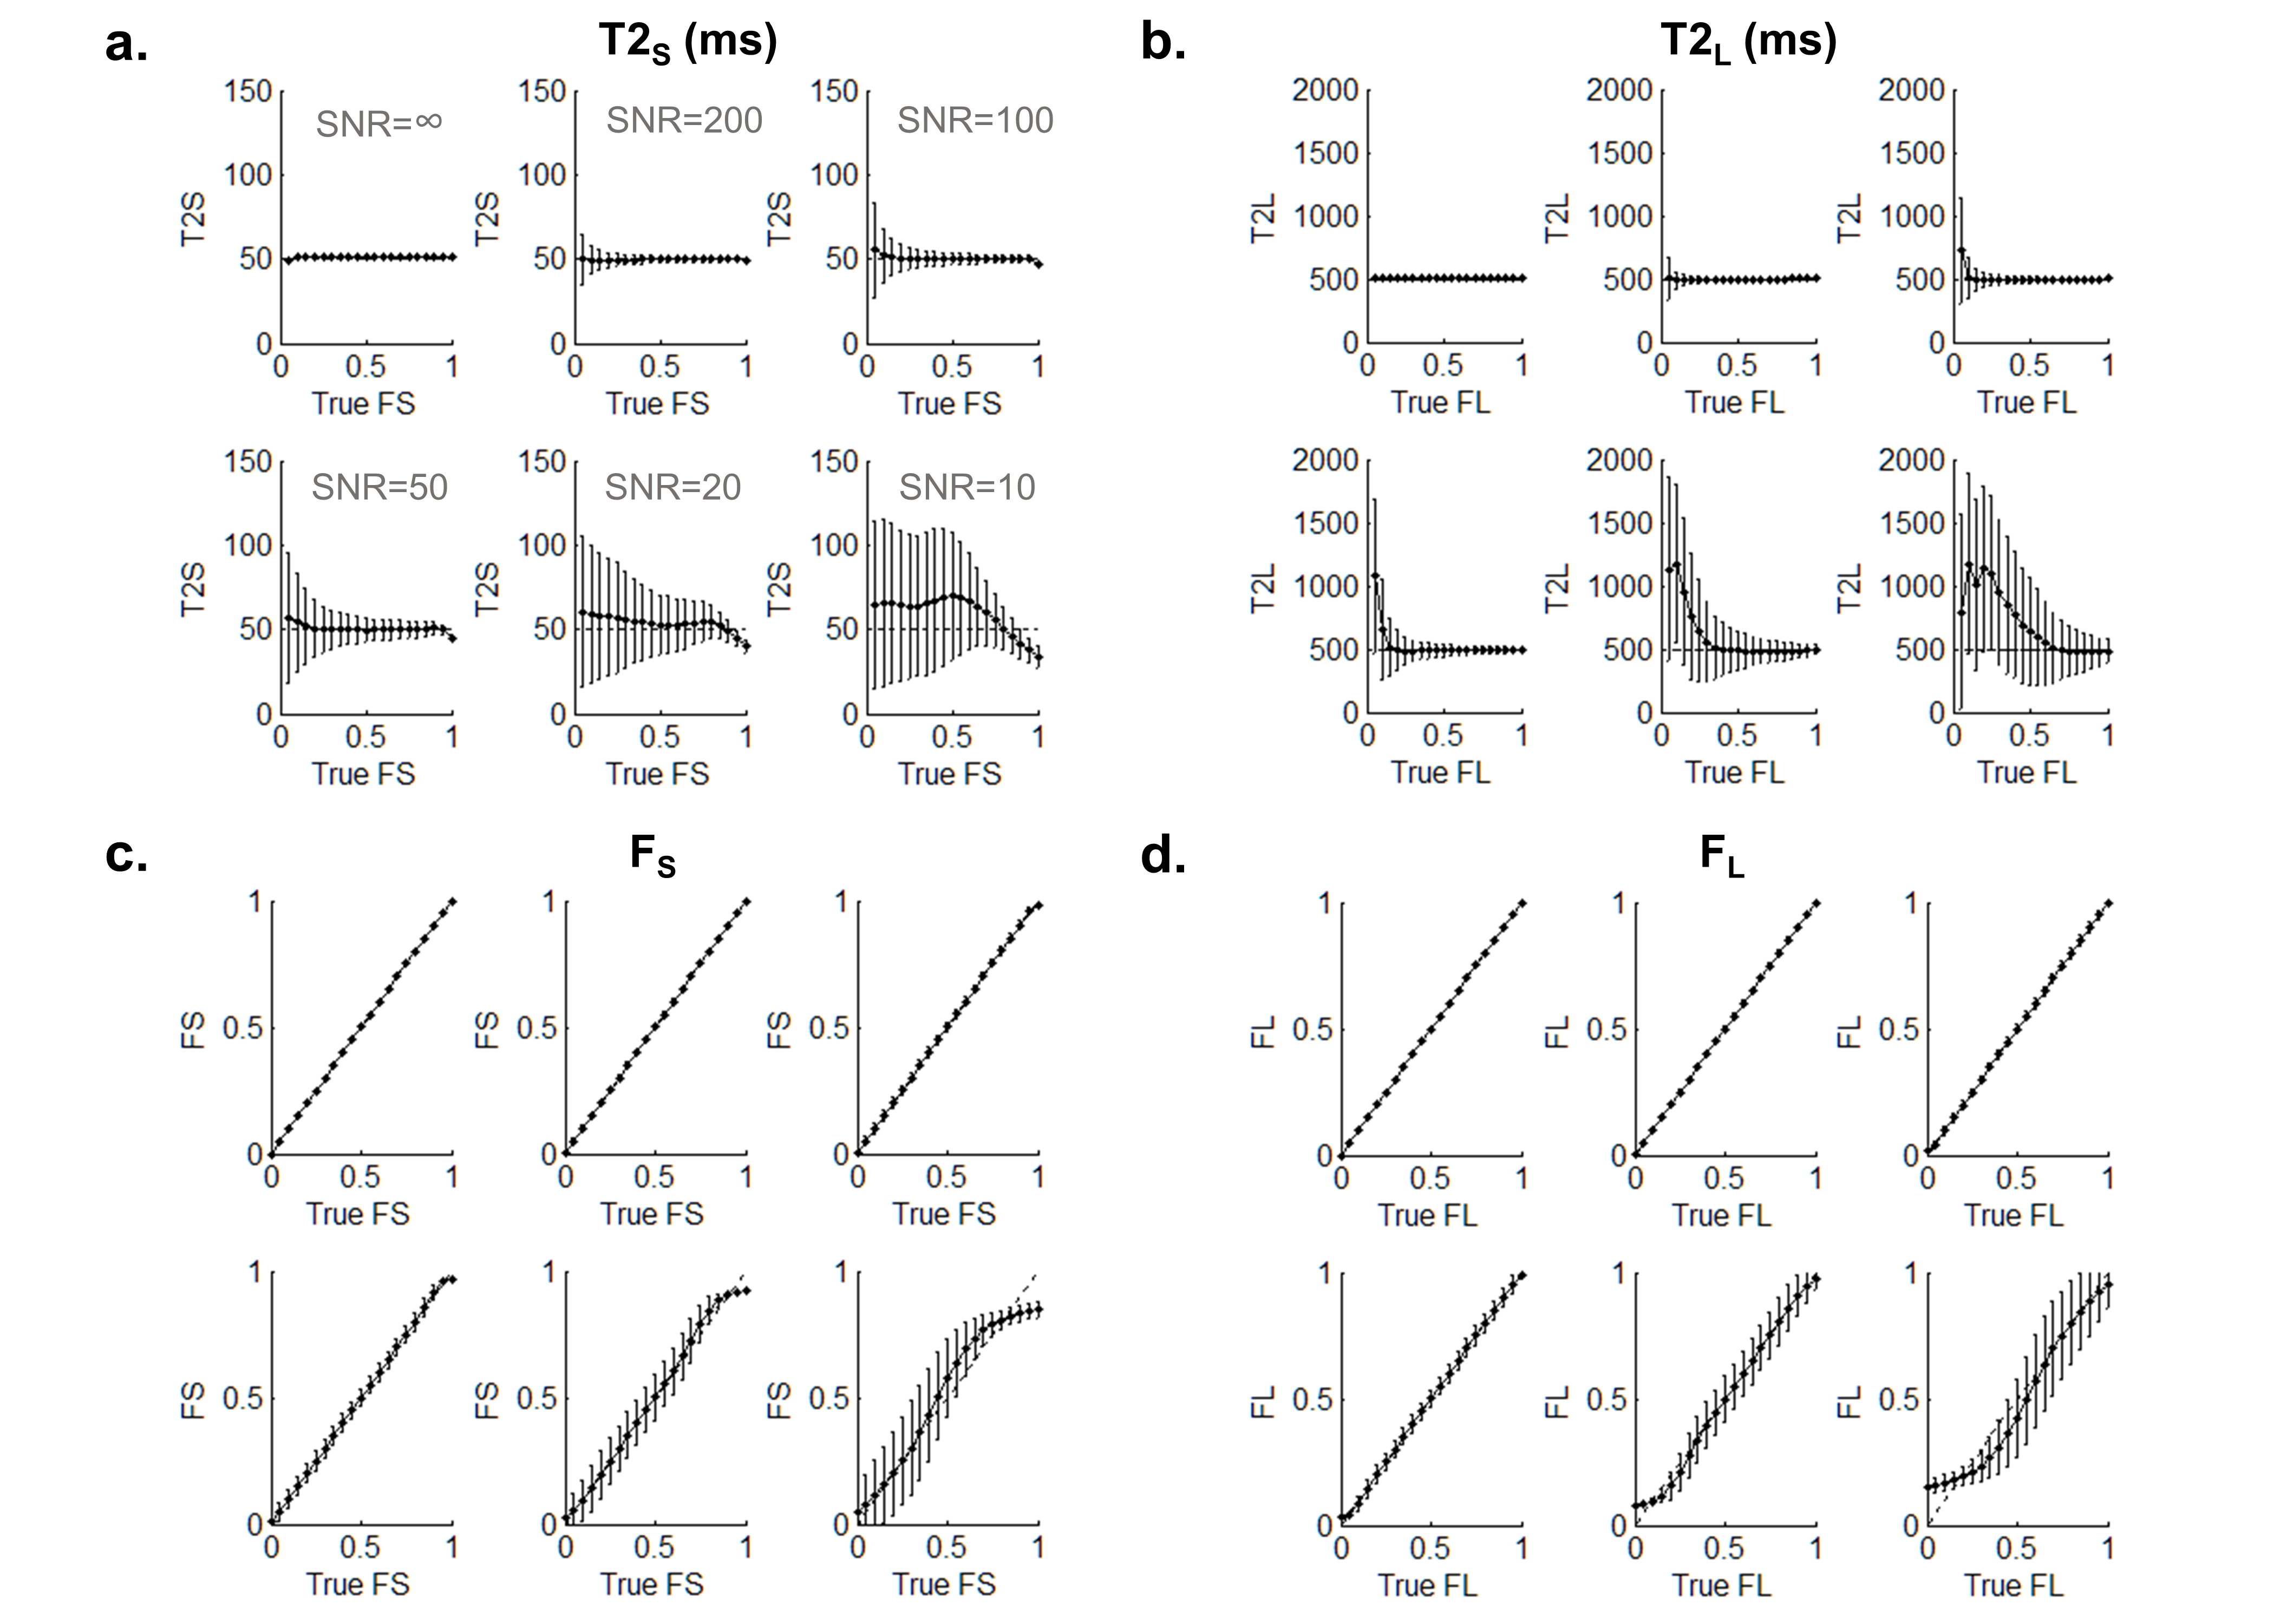
Simulations: Using Monte Carlo simulations, T2 signal decay curves were generated for varying values of FS (=1-FL) and noise levels according to the biexponential signal model: Sj(t)= FS×exp(-t/T2S) + FL×exp(-t/T2L) + Nj, where N represents Gaussian noise for the jth noise level. T2S=50ms and T2L=500ms were chosen to be in the range of values reported for the prostate2. The true fractions, FS and FL were varied from 0 to 1. Six noise levels (SNR=inf, 200, 100, 50, 20 and 10) were tested. Fitting was performed with non-negative least squares (NNLS).
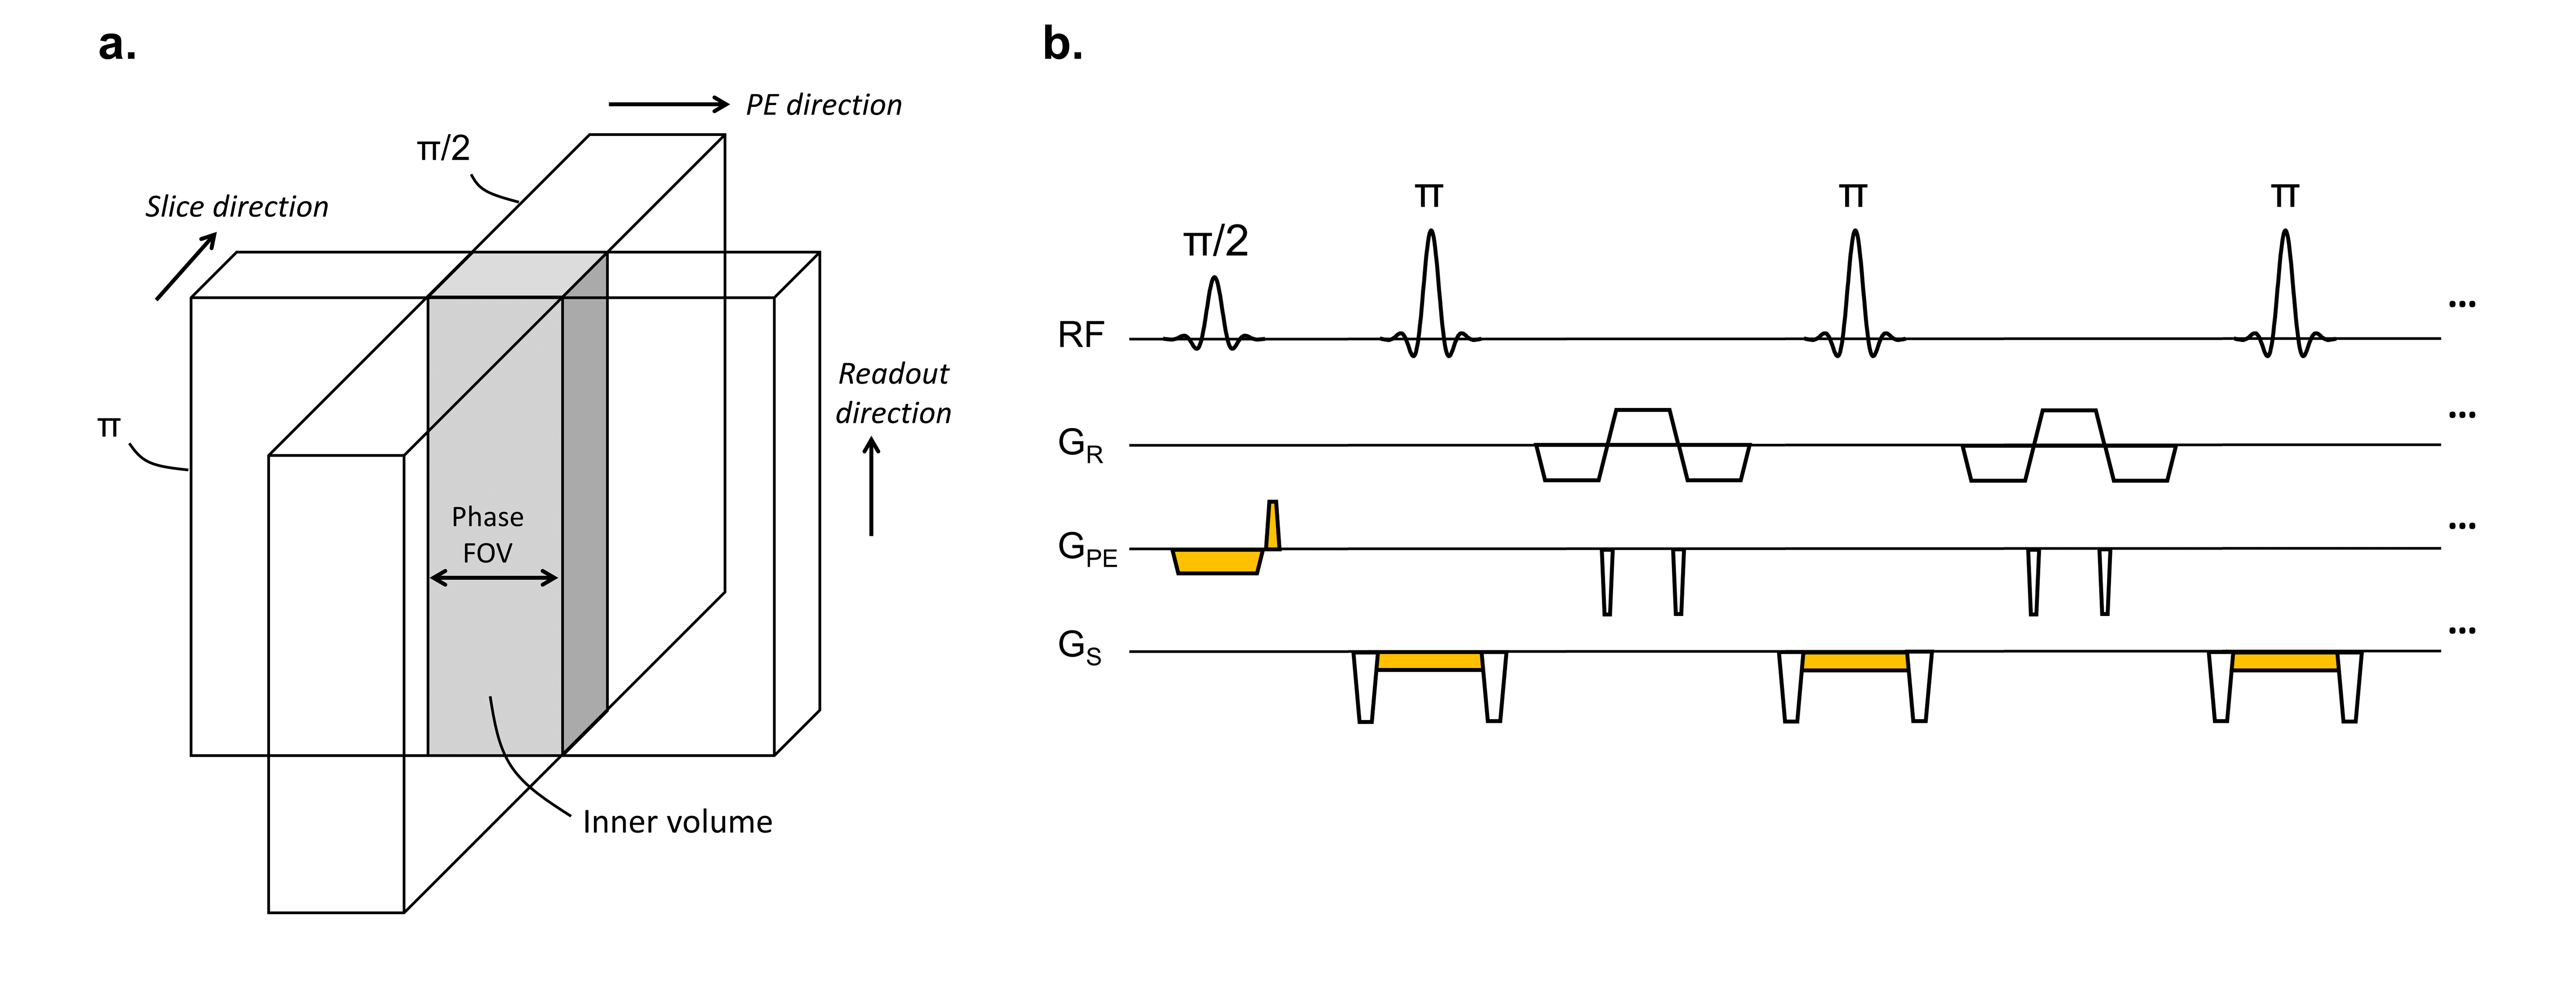
MR Imaging: All scans were performed at 3T (MAGNETOM Prisma, Siemens Healthcare). In IVS-GRASE, orthogonal RF encoding is used to refocus only the spins in the inner volume (Fig. 1). MR imaging parameters for the 3D GRASE sequence are: TR/TE = 3000/11ms, interecho spacing=11ms, FOV=60×240mm2, 8 slices, 3mm thickness, matrix size 128×128, in-plane voxel size=1.9×1.9mm2, 96 echoes, 3 echoes per refocusing pulse, rBW=610Hz/pix, transverse orientation, PE=AP (for phantom) and PE=LR (for prostate). The scan duration was 4 min 41s for each signal average using IVS. In comparison, the scan duration was 18 min for the full FOV images acquired in phantom experiments (FOV=240×240mm2).
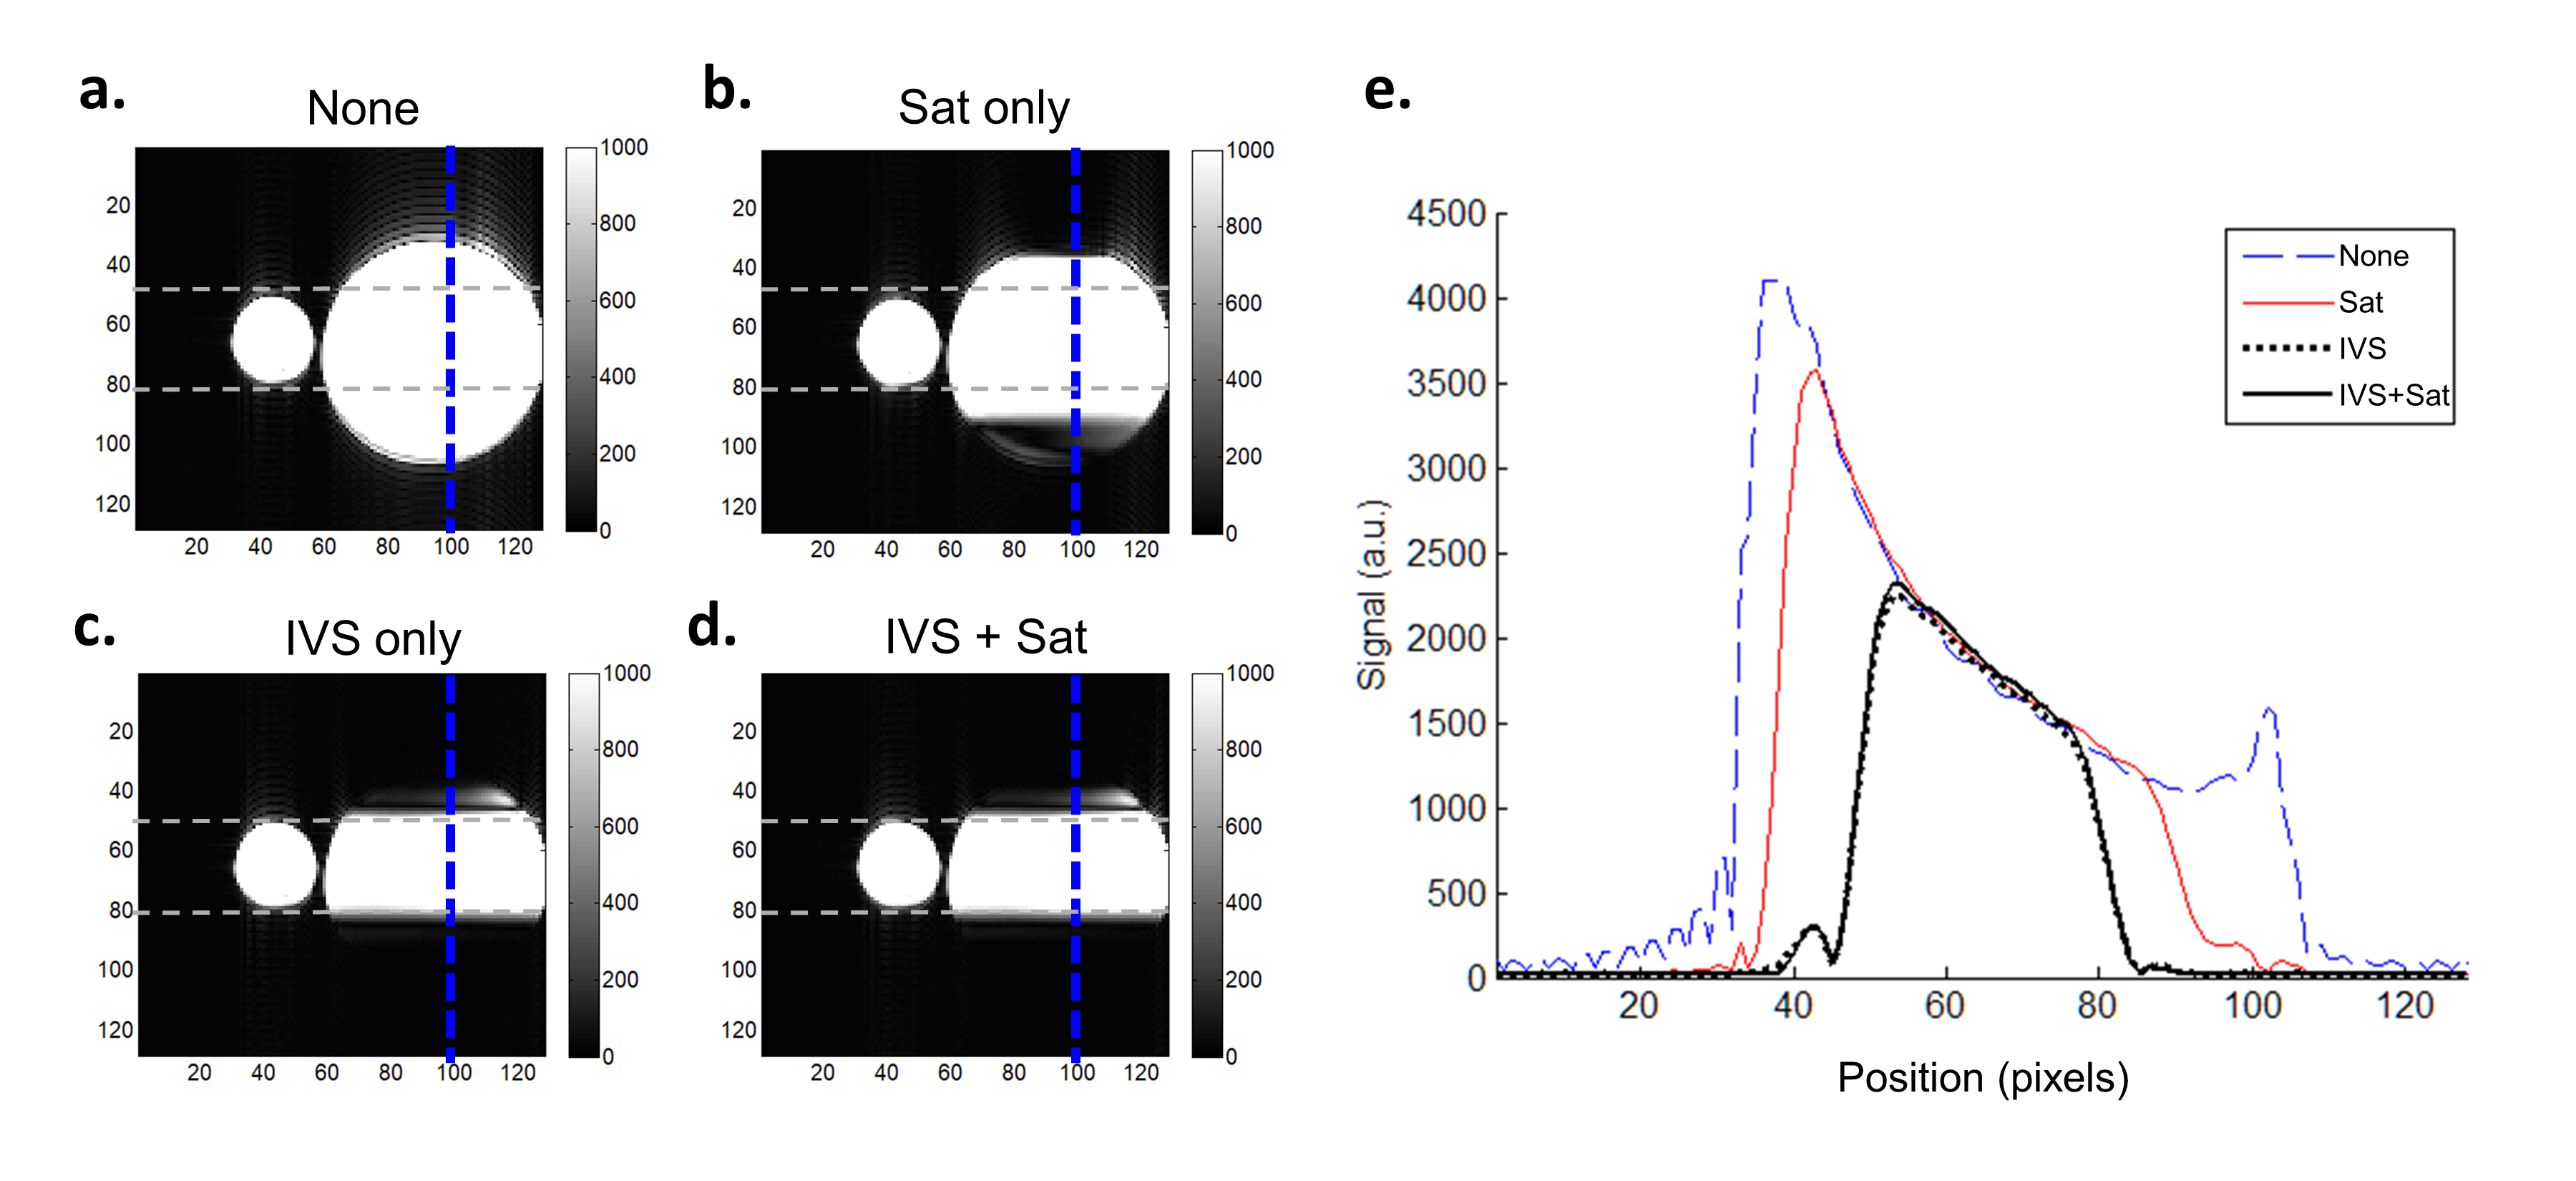
Phantom experiments: The efficacy of IVS to remove unwanted signal from the outer volume was tested in phantom experiments. Scans were performed with and without IVS and also with and without saturation (“sat”) pulses.
In vivo experiments: The study was approved by the local Research Ethics Board and informed consent was obtained from each subject. Five healthy subjects (>50 years) were scanned. In the prostate, the accuracy of multi-component parameter estimates was assessed by repeated measurements allowed by the shorter scan time with IVS.
Results and Discussion
Figure 2 shows that IVS effectively suppresses the signal from the outer volume. IVS is superior to using only sat bands, which leave residual unsuppressed signal in the outer volume. The combination of IVS+sat had minimal effect on signal.
Simulation results (Fig. 3) show that the accuracy of fitted parameters is highly dependent on the underlying fractions. There is improved accuracy of estimated T2 values (T2S and T2L) when the fractions (true FS and FL) are higher. At low SNR (=20 and 10) and at low values of true FL(< 0.3-0.5), the FS and FL curves deviate from a straight line. This suggests that estimated LWI parameters should be interpreted with caution in noisy scenarios, particularly when the fraction of the long T2 component is relatively small.
In vivo results show that most of the healthy prostate has a relatively low fraction of the long T2 component. Maps of the number of components and fractions are shown for one subject in Fig. 4a-c. Qualitatively, the maps of fractions are similar across averages, but some blurring due to motion can be seen when all averages are used. Assuming that the healthy prostate has two components2, increased averaging leads to improved accuracy as demonstrated by a higher percentage of two-component pixels compared to one-component pixels. This is shown for one subject (Fig 4a) and quantitatively, for all five subjects (Fig 4d) in the peripheral zone with mean SNR≈110 for a single average.
Conclusion
We have demonstrated that GRASE with IVS is effective for accelerating prostate LWI by at least three times. The shortened scan duration allows the LWI sequence to be easily integrated into a standard multiparametric prostate MRI protocol.Acknowledgements
We acknowledge Siemens Healthcare for the GRASE sequence.References
1. Houdt PJ, Agarwal HK, Buuren LD, Heijmink SW, Haack S, Poel HG, Ghobadi G, Pos FJ, Peeters JM, Choyke PL, Heide UA. Performance of a fast and high‐resolution multi‐echo spin‐echo sequence for prostate T2 mapping across multiple systems. Magnetic Resonance in Medicine. 2017 Jul 3.
2. Sabouri S, Chang SD, Savdie R, Zhang J, Jones EC, Goldenberg SL, Black PC, Kozlowski P. Luminal Water Imaging: A New MR Imaging T2 Mapping Technique for Prostate Cancer Diagnosis. Radiology. 2017 Apr 10:161687.
3. Sabouri S, Fazli L, Chang SD, Savdie R, Jones EC, Goldenberg SL, Black PC, Kozlowski P. MR measurement of luminal water in prostate gland: Quantitative correlation between MRI and histology. Journal of Magnetic Resonance Imaging. 2017 Jan 1.
4. Langer DL, van der Kwast TH, Evans AJ, Plotkin A, Trachtenberg J, Wilson BC, Haider MA. Prostate tissue composition and MR measurements: investigating the relationships between ADC, T2, K trans, ve, and corresponding histologic features 1. Radiology. 2010 Apr 8;255(2):485-94.
5. Feinberg DA, Harel N, Ramanna S, Ugurbil K, Yacoub E. Sub-millimeter single-shot 3D GRASE with inner volume selection for T2-weighted fMRI applications at 7 Tesla. In: Proceedings of the 16th Scientific Meeting ISMRM, Toronto 2008 (p. 2373).
Figures