0997
MRI Cine-Tagging of Cardiac-Induced Motion: Diagnostic Performance for Noninvasive Staging of Liver Fibrosis1Centre de recherche du centre hospitalier de l'Université de Montréal (CRCHUM), Montreal, QC, Canada, 2Leiden University Medical Centre (LUMC), Leiden, Netherlands, 3Department of Radiology, Radio-Oncology and Nuclear Medicine, Université de Montréal, Montreal, QC, Canada, 4Department of Medicine, Division of Gastroenterology, McGill University Health Centre (MUHC), Montreal, QC, Canada, 5Department of Gastroentology and Hepatology, Université de Montréal, Montreal, QC, Canada, 6Department of Pathology, Centre hospitalier de l'Université de Montréal (CHUM), Montréal, QC, Canada, 7Department of Pathology and Cellular Biology, Université de Montréal, Montreal, QC, Canada, 8MR Clinical Science, Philips Healthcare Canada, Markham, ON, Canada
Synopsis
Elastography techniques for staging liver fibrosis assess the right liver and require additional hardware. MRI cine-tagging evaluates the strain of liver tissue and shows promise for staging liver fibrosis without additional hardware. It can be performed routinely during MRI examinations. Strain showed high correlation with fibrosis stages (ρ = -0.60, P < 0.001). AUC was 0.78 to distinguish fibrosis stages F0 vs. ≥ F1, 0.78 for ≤ F1 vs. ≥ F2, 0.87 for ≤ F2 vs. ≥ F3, and 0.87 for ≤ F3 vs. F4. Larger studies in cohorts with specific liver disease are required to validate this technique.
Background
Liver fibrosis, which is characterized by collagen deposition in the extracellular matrix, is a hallmark feature of chronic liver disease in response to injury.1 Elastography techniques currently provide the highest diagnostic accuracy for noninvasive staging of liver fibrosis.2 However, commercially available methods require external hardware to generate shear waves and predominantly assess the right liver lobe.3 An alternative approach relies on intrinsic cardiac motion as a source of tissue deformation (i.e. strain) in the left liver lobe as a biomarker of liver fibrosis. Previous studies investigated liver strain as a surrogate biomarker of liver fibrosis in small cohorts4,5,6 or in cohorts of healthy volunteers and cirrhotic patients.4,5,7Purpose
The purpose of this study was to evaluate the diagnostic performance of magnetic resonance imaging (MRI) cine-tagging of cardiac-induced motion for staging liver fibrosis, using liver biopsy as the reference standard, in a cohort of patients with chronic liver disease.Materials and Methods
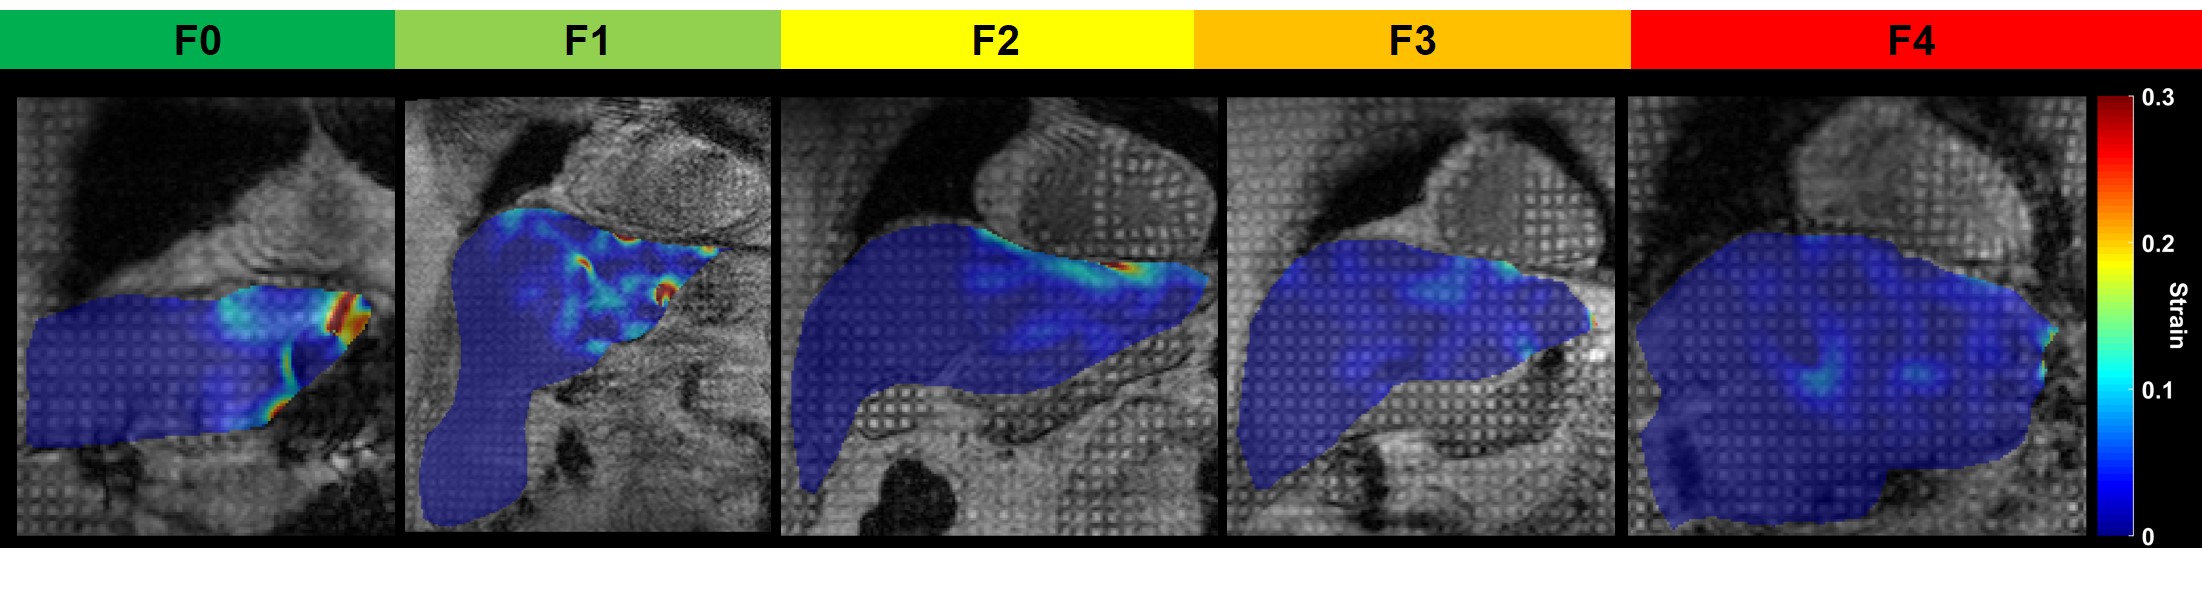
This institutional review board-approved cross-sectional study included adult patients with chronic liver disease – hepatitis C, hepatitis B, nonalcoholic steatohepatitis, or autoimmune hepatitis – undergoing liver biopsy as part of their standard of care. Participants were recruited at the hepatology clinics of the two participating institutions between October 2014 and September 2017. MRI examinations were performed on a 3.0 T clinical system (Achieva TX, Philips Healthcare, Best, Netherlands). A 2D multi-slice gradient-echo sequence with tagging was acquired with peripheral pulse-wave triggering. A spatial modulation of magnetization (SPAMM) preparation was used to generate a grid corresponding to a sinusoidal magnetization pattern in the image. The sequence parameters were: TR = 4.9 ms, TE = 2.8 ms, number of phases per cardiac cycle = 12-15, flip angle = 10°, field of view = 420 x 420 mm2, in-plane resolution = 1.3 mm x 1.3 mm, slice thickness = 8 mm, 2 coronal slices with a 16 mm gap, tag spacing = 8 mm, tag orientation = 0 and 90°, receiver bandwidth = 430 Hz/pixel, SENSE acceleration factor = 2, number of averages = 1, acquisition time of approximately 16 s per slice (depending on patient’s heart rate). Images were acquired within 2 successive breath holds at end expiration. Post-processing was performed with the harmonic phase (HARP) software (HARP 2.1 for MATLAB, John Hopkins University, Baltimore).8 The sinusoidal magnetization pattern in the images produces harmonic peaks in the Fourier domain that carry information about magnitude and phase. Since the phase is constant for a given point in a considered volume throughout time, movements of each point can be tracked using the corresponding HARP images. The strain tensor for every point in the image can be evaluated.9 Values of strain on two coronal slices were evaluated in a region-of-interest of 22 cm2 on each slice in the liver automatically selected close to the heart apex and then averaged. The pathologist was blinded to MRI cine-tagging results. The image analyst was blinded to the biopsy results. Liver strain was investigated as a surrogate biomarker of liver fibrosis. Spearman's correlation, Kruskal-Wallis test, Mann-Whitney U test, and receiver operating characteristic (ROC) analyses were performed. The 95% confidence intervals of area under ROC curves (AUC) were estimated using bootstrapping. Sensitivity, specificity, accuracy, positive predictive value, and negative predictive value for thresholds that maximized Youden's index were reported.Results
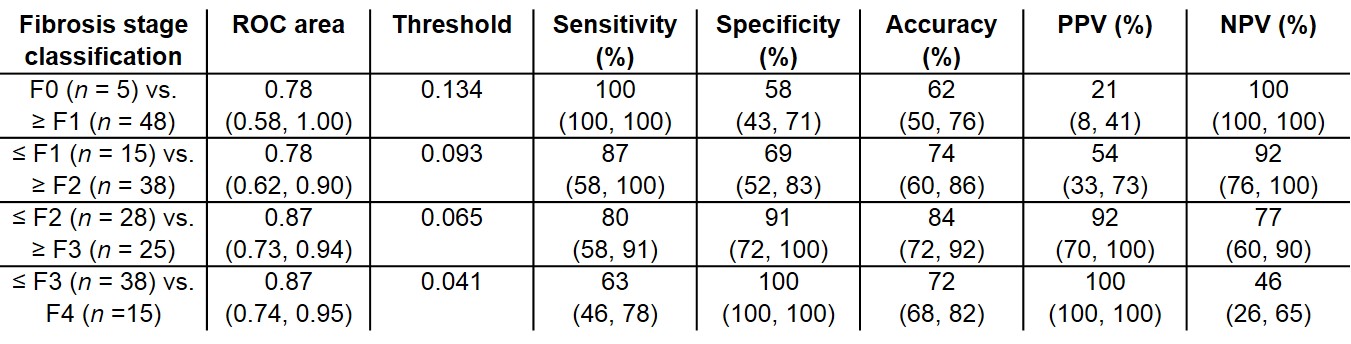
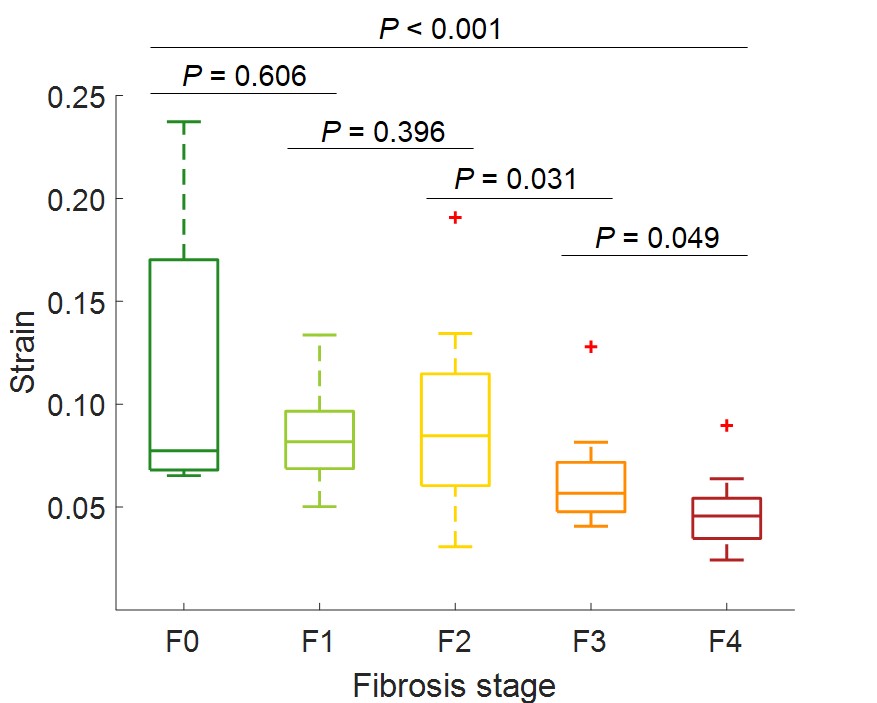
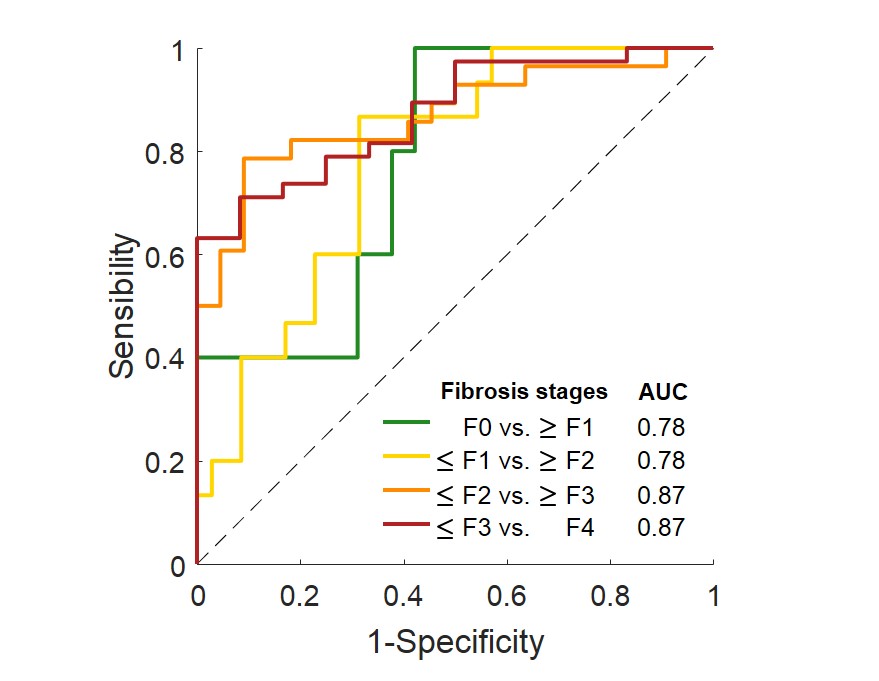
Fifty-three subjects were included. Liver strain decreased with higher histological fibrosis stage and was significantly correlated with histological fibrosis stage (ρ = -0.60, P < 0.001) (Figure 1). Strain values were significantly different between all fibrosis stages (P < 0.001) and between pairs of fibrosis stages ≤ F2 vs. ≥ F3 and ≤ F3 vs. ≥ F4 (P = 0.031, P = 0.049, respectively). Table 1 summarizes the performance of liver strain for staging liver fibrosis. Figure 2 shows a box and whisker plot of liver strain vs. fibrosis stages. Figure 3 shows ROC curves of liver strain vs. dichotomized fibrosis stages.Conclusion
Liver strain measured by MRI cine-tagging of cardiac-induced motion shows promise as a noninvasive technique for staging of liver fibrosis without additional elastography hardware. Larger studies in cohorts with specific chronic liver disease will be required to validate this technique for the staging of liver fibrosis.Acknowledgements
This work has been supported by an Operating Grant from the Canadian Institutes of Health Research (CIHR)-Institute of Nutrition, Metabolism, and Diabetes (INMD) Operating Grant (#301520).
An Tang is supported by a Career Award from the Fonds de recherche du Québec en Santé and Association des Radiologistes du Québec (FRQS-ARQ #34939) and a New Researcher Startup Grant from the Centre de Recherche du Centre Hospitalier de l'Université de Montréal (CRCHUM).
References
1. Friedman SL. Mechanisms of hepatic fibrogenesis. Gastroenterology. 2008;134(6):1655-69.
2. Petitclerc L, Sebastiani G, Gilbert G, Cloutier G, Tang A. Liver fibrosis: Review of current imaging and MRI quantification techniques. J Magn Reson Imaging. 2017;45(5):1276-95.
3. Tang A, Cloutier G, Szeverenyi NM, Sirlin CB. Ultrasound Elastography and MR Elastography for Assessing Liver Fibrosis: Part 1, Principles and Techniques. AJR Am J Roentgenol. 2015 Jul;205(1):22-32.
4. Chung S, Breton E, Mannelli L, Axel L. Liver stiffness assessment by tagged MRI of cardiac-induced liver motion. Magnetic resonance in medicine. 2011;65(4):949-55.
5. Mannelli L, Wilson GJ, Dubinsky TJ, et al. Assessment of the liver strain among cirrhotic and normal livers using tagged MRI. Journal of magnetic resonance imaging : JMRI. 2012;36(6):1490-5.
6. Harouni AA, Gharib AM, Osman NF, Morse C, Heller T, Abd-Elmoniem KZ. Assessment of liver fibrosis using fast strain-encoded MRI driven by inherent cardiac motion. Magnetic resonance in medicine. 2014.
7. Chung S, Kim KE, Park MS, Bhagavatula S, Babb J, Axel L. Liver stiffness assessment with tagged MRI of cardiac-induced liver motion in cirrhosis patients. Journal of magnetic resonance imaging : JMRI. 2014;39(5):1301-7.
8. Osman NF, Kerwin WS, McVeigh ER, Prince JL. Cardiac motion tracking using CINE harmonic phase (HARP) magnetic resonance imaging. Magnetic resonance in medicine. 1999;42(6):1048-60.
9. Liu X, Prince JL. Shortest path refinement for motion estimation from tagged MR images. IEEE Trans Med Imaging. 2010;29(8):1560-72.
Figures