0995
Changes in Pancreatic Stiffness in Obese Adults Receiving an Oral Glucose Load, as Measured by Magnetic Resonance Elastography1Shengjing Hospital of China Medical University, Shen Yang, China
Synopsis
When applying MR elastography (MRE) in pancreas, the waves propagated in individuals with high Body Mass Index (BMI) tend to travel longer distances with more challenges. In this study, we performed MRE in 18 obese subjects before and after an administration of a 75 g oral glucose load (OGL), and we found that 40Hz had better wave image quality than 60Hz and was more sensitive to detect the stiffness decrease after OGL.
Purpose
Preliminary human studies of the feasibility of pancreatic MRE have assessed low vibration frequencies ranging from 40 to 60 Hz [1-3]. However, studies on whether or not individuals with a high BMI can be evaluated by MRE, have not been published [1]. The perfusion of blood through the pancreas is normally coupled with insulin released in response to changes in the concentrations of blood glucose [4]. The blood glucose level increases markedly and peaks 30–40 min after the administration of an OGL [5]. Hence, we investigated whether or not MRE by frequencies of 40 and 60 Hz, could find significant changes in pancreatic stiffness in response to an OGL in obese subjects.Methods
Eighteen obese participants aged (mean age: 37.5 ±9.4 years; BMI: 29.0±2.2 kg/m2; 12 men/6 women) were enrolled, excluding history of pancreatitis or pancreatic mass, type 1 diabetes, alcohol or tobacco abuse and abnormal serum amylase and lipase levels. These participants underwent 2 MRE scanning sessions (session 1: before an OGL, session 2: after an OGL). Each MRE session consisted of 2 MRE scans at 40- and 60 Hz. After the first MRE session, the participant ingested 300 mL of a solution containing 75 g of glucose. Thirty-five minutes later, the participant underwent the second MRE session. All MR examinations were performed on a 3.0T MRI scanner (Signa EXCITE HD MRI System; GE Healthcare). The three-dimensional wave field was acquired by a single-shot, SE-EPI sequence with flow-compensated motion-encoding gradients. The inversion algorithm of MRE data used a direct inversion (DI), as described in previous studies [1,6]. The wave images were checked using the curled-wave data of the X, Y, and Z components in the wave field. The image quality of the waves was subjectively rated based on a 5-point scale by two observers. Scores 1 to 5 were defined as failure, poor, average, good, and excellent, respectively. Suboptimal image quality was considered to be scores of 1 and 2. The image quality scores and pancreatic stiffness values before and after an OGL were compared by the paired Wilcoxon signed-rank test.Results
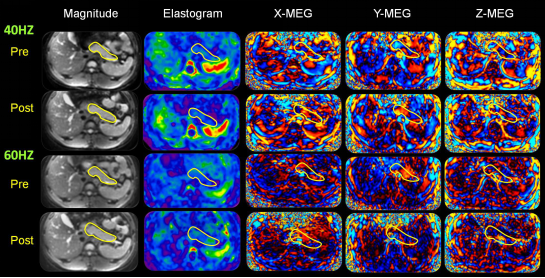
Good interobserver agreement was found for image quality at both frequencies (kappa = 0.844 for 40 Hz and 0.796 for 60 Hz). The median overall image quality scores were 4 for 40 Hz, which was significantly higher than for 60 Hz (median score: 2). At 40 Hz, pancreatic stiffness in response to oral glucose decreased by 7.4 % (pre vs post: 1.20±0.15 kPa vs 1.13±0.12 kPa; P<0.001), whereas the change in stiffness was not significant at 60 Hz (pre vs post: 2.11±0.22 kPa vs 2.14±0.35 kPa; P=0.385), as shown in Figure 1.Conclusion
MRE at 40 Hz provides good-quality images and high sensitivity to changes in the mechanical properties of pancreatic tissue in obese volunteers after an oral glucose load.Discussion
Currently, the confidence map for 3D-vector MRE based on multislice SE-EPI of either the liver or pancreas have not been widely accepted. We visually evaluated the pattern of wave propagation, illumination of the pancreas on the images of the waves, and wave magnitudes. Although visual evaluation of wave quality is a subjective process, the interobserver agreement in our study was very good [1,3]. Dittmann et al [2] addressed the hypothesis that water intake might increase vascular flow and organ perfusion, which would lead to stiffness changes in the organs of the upper abdomen. We changed the external load of water to a glucose load, which would target the pancreas. Consistent with Dittmann’s results, we also found that the pancreatic stiffness decreased. Compared with the 60 Hz frequency, wave at 40 Hz produced better-quality wave images and was more sensitive to changes in the mechanical properties of the pancreas in response to glucose uptake.
Acknowledgements
AcknowledgementsWe thank Richard Ehman and Kevin Glaser from the Mayo Clinic for providing the MRE system. We also thank Jun Chen from the Mayo Clinic for his assistance with providing the tailored pancreatic MRE driver. This work was supported by a grant from the National Natural Science Foundation of China (No. 81771893,81771802 and NIH EB1801).
References
[1] Shi Y, Glaser KJ, Venkatesh SK, et al. Feasibility of using 3D MR elastography to determine pancreatic stiffness in healthy volunteers[J]. J Magn Reson Imaging, 2015, 41(2): 369-375.
[2] Dittmann F, Tzschatzsch H, Hirsch S, et al. Tomoelastography of the abdomen: Tissue mechanical properties of the liver, spleen, kidney, and pancreas from single MR elastography scans at different hydration states[J]. Magn Reson Med, 2017, 78(3): 976-983.
[3] An H, Shi Y, Guo Q, et al. Test-retest reliability of 3D EPI MR elastography of the pancreas[J]. Clin Radiol, 2016, 71(10): 1068 e1067-1068 e1012.
[4] Jansson L, Carlsson PO. Graft vascular function after transplantation of pancreatic islets[J]. Diabetologia, 2002, 45(6): 749-763.
[5] Jansson L, Hellerstrom C. Stimulation by glucose of the blood flow to the pancreatic islets of the rat[J]. Diabetologia, 1983, 25(1): 45-50.
[6] Sugimoto M, Takahashi S, Kobayashi T, et al. Pancreatic perfusion data and post-pancreaticoduodenectomy outcomes[J]. J Surg Res, 2015, 194(2): 441-449.
Figures